
Abstract
Air leaks have a considerable impact on the energy load and durability of buildings, particularly in cold climates. In wood construction using cross-laminated timber (CLT), air leaks are most likely to be concentrated at the joints between panels and other elements. This study used simulations of heat, air, and moisture transfers through a gap between two CLT panels causing air leakage in winter conditions under a cold climate. A real leakage occurrence was sized to validate the simulations. The aim of this work was to assess the impact on the energy loads and the durability of an air leak, as either infiltration or exfiltration, for different gap widths and relative humidity levels. The results showed that infiltrations had a greater impact on the energy load than exfiltrations but did not pose a threat to the durability, as opposed to exfiltrations. Gap sizes in CLT may vary, but the effect on the energy load was sensitive to the leakage path in the rest of the wall. As expected, a combination of winter exfiltration and a high level of interior relative humidity was particularly detrimental.
Download PDF
Full Article
Modeling the Impact of Assembly Tolerances Regarding Air Leaks on the Energy Efficiency and Durability of a Cross-laminated Timber Structure
Ulysse Martin,* Pierre Blanchet,* and André Potvin
Air leaks have a considerable impact on the energy load and durability of buildings, particularly in cold climates. In wood construction using cross-laminated timber (CLT), air leaks are most likely to be concentrated at the joints between panels and other elements. This study used simulations of heat, air, and moisture transfers through a gap between two CLT panels causing air leakage in winter conditions under a cold climate. A real leakage occurrence was sized to validate the simulations. The aim of this work was to assess the impact on the energy loads and the durability of an air leak, as either infiltration or exfiltration, for different gap widths and relative humidity levels. The results showed that infiltrations had a greater impact on the energy load than exfiltrations but did not pose a threat to the durability, as opposed to exfiltrations. Gap sizes in CLT may vary, but the effect on the energy load was sensitive to the leakage path in the rest of the wall. As expected, a combination of winter exfiltration and a high level of interior relative humidity was particularly detrimental.
Keywords: Cross-Laminated Timber; Energy efficiency; HAM analysis; Air leakage; Durability assessment
Contact information: Chaire Industrielle de Recherche sur la Construction Ecoresponsable en Bois (CIRCERB), Pavillon Gene-H-Kruger, Université Laval, 2425, rue de la terrasse, Québec, Canada;
* Corresponding authors: ulysse.martin.1@ulaval.ca; pierre.blanchet@sbf.ulaval.ca
INTRODUCTION
Wooden materials are the basis of the building system that shelter most of the population in the USA and Canada (McKeever and Elling 2015). The choice of wood for residential buildings is obvious. Wood is a renewable and sustainable material, making it the perfect choice during times of environmental instability. The durability of a wooden structure is affected by the size of the element. For example, a post and beam structure is less prone to fail than a stud-built structure. The durability also means that the wooden elements can be reused for a new building if the building where it first served is demolished. Cross-laminated timber (CLT) is a new way of using wood for large residential projects and commercial buildings. CLT has applications and strength characteristics (based strength/density ratio) similar to concrete, but with the benefits of wooden materials.
CLT building construction is a viable and cost-effective alternative to steel or concrete systems for building mid-rise buildings, in both residential and non-residential sectors (Lehmann 2012; Laguarda Mallo and Espinoza 2014). CLT allows the construction of taller wood buildings, which has been demonstrated in many North American cities recently (Portland, New York, Vancouver, Quebec City), thus opening a market that has not yet been significantly penetrated by wood products in Canada or the USA (Crespell and Gaston 2011). Wooden products offer the additional advantage of being more environmentally friendly than the materials they tend to replace. The ecological footprint of CLT buildings is smaller than that of their concrete counterparts (O’Connor et al. 2011), due to the renewable nature of wood, the shorter building time required, and reduced waste on the building site (Laguarda Mallo and Espinoza 2014). In Europe, where CLT originated, the demand for CLT has increased in the last 25 years (Schickhofer 2015). If the North American CLT market follows the same trend and a growing demand for renewable and durable building materials occurs, the demand and applications for CLT should increase in the future (Natural Resources Canada 2016). It would be of interest to analyze the CLT building system while it is in its growing phase and to provide recommendations as the market develops in North America.
There are numerous methods of assembling CLT panels. The simple method selected in this work consisted of fastening two flat surfaces with butt-joints, which could also be used in angles and flat junctions. CLT panel assembly commonly leads to the creation of gaps at the junction of two panels. Such gaps are referred to as an “assembly tolerance” when under control, or “gap” when not under control. A tolerance is permitted at the design stage to ease assembly on the construction site. Whenever the gap exceeds the tolerance, it creates a void that can be distributed through the whole length and thickness of the panel. At this point, the CLT system no longer serves as a physical barrier to air movement, caused by a pressure differential between on both sides of the wall. In the event of leakage or defect in the vapor barrier and air barrier layers, a gap in the CLT can act as a shortcut for air transfer through the wall, in the form of infiltration or exfiltration.
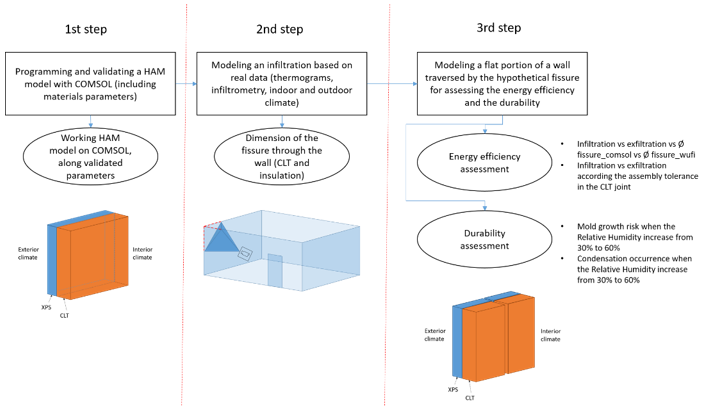
Fig. 1. Representation of the division of the work flow and visual representation of the model used for each steps.
Infiltration and exfiltration cause a significant loss of energy, hence causing an increase in energy consumption in the short term. Exfiltration may also have an impact on the durability of the envelope over the longer term and lead to an accumulation of moisture within the wall (Ojanen and Kumaran 1996). Wood is an organic material subject to biodegradation. Under certain conditions of temperature and relative humidity, mold, rot, and insects are the main threat to its durability (Viitanen and Ritschkoff 1991). The structural integrity of the wall, and thus of the entire structure, can be threatened.
The aim of this paper was to model an assembly gap in a CLT wall to analyze its impact in conjunction with an air leak on energy efficiency and durability. To achieve this objective, the work was divided into three steps, the final modelling, which the results are from, is the last and third step. The two first steps, which were required to properly set the final modeling, are the following. The first step involved simulations of the required hygrothermal parameters for the building materials, known as boundary conditions and software capability for computing the different dynamic physical phenomena. The second step involved modeling the behavior of a gap in the wall, with leakage size being the most determinant factor of infiltration/exfiltration. The surface of the leakage was first estimated for an existing CLT building located in the province of Quebec, Canada using thermal imagery of an infiltration and simulations. The three stages of the work are presented in the Fig. 1 along with a visual representation of the model used for each steps.
EXPERIMENTAL
Envelope Composition
As shown in Fig. 2, a simplified envelope was used to facilitate modeling.
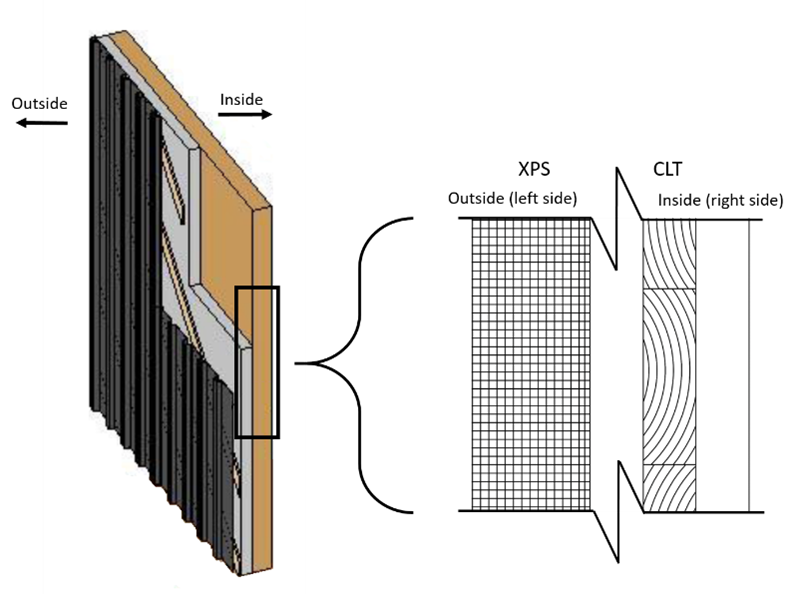
Fig. 2. Complete envelope (left) (Pineault and Bérubé-Dufour 2016); edge view simplified (right)
It excluded the external face, which does not play a key role in hygrothermal transfers through the wall, given that the air layer behind the face is vented to the outside. The CLT is the structural material, and the extruded polystyrene (XPS) provides insulation. The CLT also serves as a vapor barrier due to its low vapor permeability and its thickness (Lepage 2012). In practice, however, it is widely recommended to use a vapor barrier that is designed for this specific job (Skogstad et al. 2011).
In the first part of the study, a temporary home for workers built with CLT was taken as a reference. The thickness of the three-ply CLT panels was 97 mm, and the thickness of the insulation was 70 mm. In the second part, a permanent residential building with standard insulation (R24 = 4.23 RSI) was considered. CLT and insulation thicknesses were 97 mm and 101.6 mm (4 inches), respectively.
To simplify the model, the thickness of insulation was considered as one homogeneous layer instead of multiple layers. Simulations with WUFI software (Fraunhofer IBP, Holzkirchen, Germany) showed no significant differences between one or two layers of the insulation material for a given overall thickness.
Hygrothermal Parameters of Materials and Climatic Conditions
Hygrothermal parameters
The Heat Air and Moisture (HAM) model requires six main parameters, i.e., thermal conductivity, heat capacity, density, moisture content, permeability, and the diffusion coefficient of water vapor. These parameters vary substantially according to the relative humidity.
The CLT was manufactured by Chantier Chibougamau (Quebec, Canada) from selected Spruce-Pine-Fir (SPF) lumber, mostly black spruce (Picea mariana Mill). In this study, due to the lack of more specific data, black spruce was assumed to share similar hygric properties with European spruce of the same genus used in European CLT. Thermal conductivity and heat capacity were measured following the ASTM C518-17 (2017) and ASTM C1784-14 (2014) standards, respectively, using a FOX 314 Heat Flow Meter from TA Instruments. The density was obtained from the manufacturer of the CLT (Nordic Structures 2015). Water vapor permeability for wood was taken from Wu (2007), who used Canadian spruce (Picea mariana) in conjunction with the manufacturer’s data (Nordic Structures, 2017). The CLT moisture content function was derived from WUFI software. The diffusion coefficient was obtained from Krus and Vik (1999).
The thermal conductivity and water vapor permeability values of the XPS insulation used for modeling were provided by Owens Corning (FOAMULAR® 150 Rigid Foam Insulation, 2011). The other properties were extracted from the WUFI database, except the diffusion coefficient, which was determined by curve fitting with WUFI and the COMSOL Multiphysics modeling tool (a multiphysics simulation software). As for the solid materials, the hygrothermal properties of the air gap were related to the temperature and relative humidity. Thermal conductivity, heat capacity, and moisture content were also obtained from WUFI. The density of moist air was calculated with the perfect gas law for a mixture of two species. The permeability of stagnant air was calculated as suggested by Schirmer (1938) as cited by Wu (2007). The diffusion coefficient of water vapor in air came from Cussler (2009) in conjunction with the values found by Mostinsky (2011).
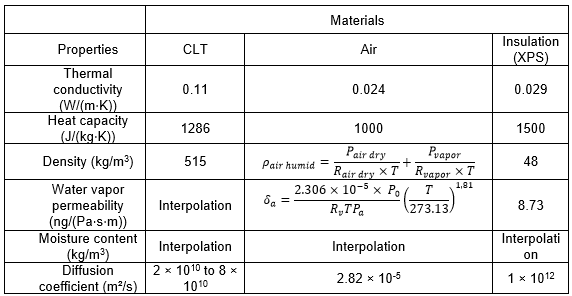
The parameters used in COMSOL are summarized in Table 1 for the different materials in the envelope. In Table 1, Pair/vapor represents the pressure (Pa) of the dry air or vapor, Rair/vapor is the specific gas constant for the dry air or the water vapor (J⋅mol−1⋅K−1), T is the temperature (K), Pa is the ambient air (Pa) pressure, and P0 is the standard atmospheric pressure (1 atm Pa).
Table 1. Hygrothermal Properties of Materials Used for the Simulations
Climatic conditions
The temperature used to simulate exterior climate conditions was -12 °C, the average January temperature in Quebec City, Quebec, Canada. The temperature used in simulation was set steady for simplification purpose. The measurements were taken at the Jean-Lesage airport meteorological base (ASHRAE 2009). The relative humidity, which was set at 80%, was based on measurements taken in January in Quebec at a similar temperature.
In the absence of external facing, the outside conditions were applied directly to the insulation. Simulations with WUFI showed that the temperature and relative humidity behind the external facing are close to exterior conditions. Interior conditions were based on ASHRAE Standard 55 (2013), which sets a range of temperature and relative humidity conditions for thermal comfort.
Modeling and Validation
COMSOL Multiphysics, which was selected as the main modeling tool, is not specialized in hygrothermal modeling but it allows simultaneous use of HAM and Computational Fluid Dynamic (CFD) while using CFD data to update the HAM model.
COMSOL is more efficient in addressing complex domain geometry than WUFI. To validate COMSOL results, simulations with the two tools were compared in both steady and transient states. WUFI is a reference in the domain and has been validated multiple times in in situ studies.
Gap Sizing
This section describes the method to determine the gap parameters subsequently used in this research. The method is based on thermograms of a corner showing evidences of an infiltration and modeling of the same corner. Thermal imagery and infiltration analyses were conducted by Pineault and Bérubé-Dufour (2016) following the ONGC-149-GP-2MP and ASTM E1827–11 standards, respectively. Instead of regarding the gap’s path in the wall as complex, it was assumed that the gaps in CLT and in the insulation were aligned, which makes it the worst-case scenario. The modeling of the walls and the gap were carried out on COMSOL with boundary conditions set to reflect measured data and observations. As the size of the gap increased, so did the leakage rate, cooling the surface on each side of the assembly. Such cooling was observed on thermal imagery and could be estimated with the color scale represented in Fig. 3. With multiple COMSOL iterations, the width of the gap in the insulation was determined. The assembly tolerance between CLT panels was set at 2 mm, in accordance with in situ observations.
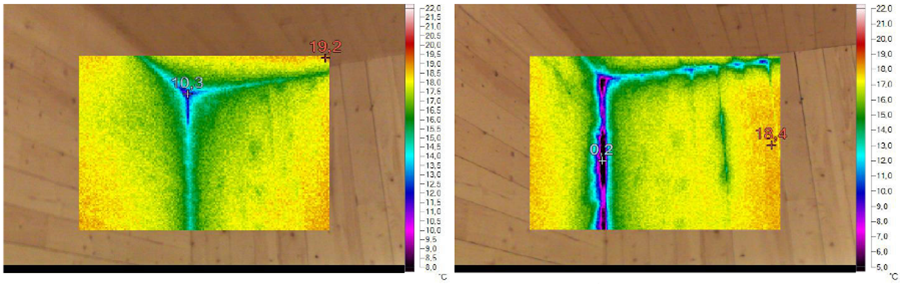
Fig. 3. Thermal imagery taken from the inside during a blower door test at 4 Pa and 50 Pa
To assess the impact of an infiltration/exfiltration at the junction between two panels, the size (or surface) of the gap section must be known in both the CLT and the insulation. The size of a gap was determined from thermographic pictures from an angle junction in a CLT building with the CLT left visible, as shown in Fig. 3. More simply put, the case of a gap in a corner (angle) wall of CLT was used for the sizing. A thermogram was taken at 4 Pa of depressurization/vacuum (exterior minus interior) and another at 50 Pa to force infiltration. The modeling results shown in Fig. 4 allows the observation of the temperature drop across the wall and along the interior wall’s surface.
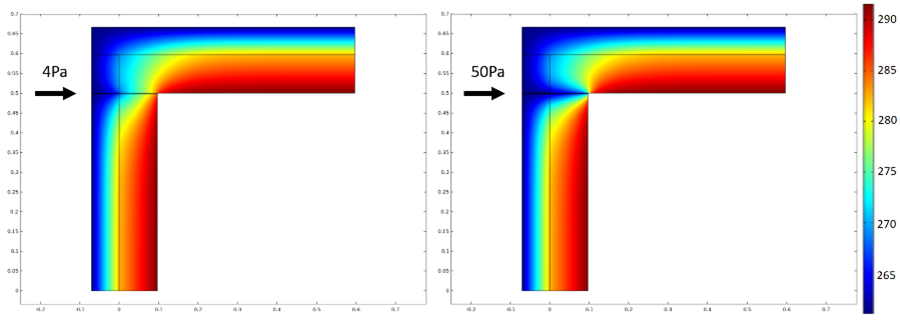
Fig. 4. Effect of air infiltration on wall temperature, seen in cross section, for 4 Pa and 50 Pa after 45 min
Energy Efficiency
The heat flux (Eq. 1) through the wall is the sum of the conduction flux (Eq. 2), the convection flux (Eq. 3), and the radiative flux (Eq. 4). The radiation, Eq. 4, was not considered because it was found to be negligible compared to the other two transfer modes (~ 1.2 E-3 W / m²).
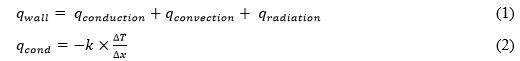
where k is the thermal conductivity (W/(m⋅K)), ΔT (K) is the temperature difference across the length Δx (m).
![]()
where h is the heat transfer coefficient (W/(m2⋅K)) .
![]()
In Eq. 4, ε is the emissivity of the material and σ is the Stefan-Boltzmann constant (5.670367×10⁻⁸ W⋅m−2⋅K−4).
The heat flux due to the air leakage can be estimated by Eq. 5. The air leakage for both infiltration and exfiltration is caused by a pressure differential of 4 Pa and CFD calculation was done using COMSOL. The total heat flux per square meter is described by Eq. 6 and was calculated in COMSOL.
![]()
where ṁ is the mass flow rate (kg⋅s−1) and Cp is the heat capacity of the air at constant pressure (J⋅kg−1⋅K−1).
![]()
where A represents the area (m2) of its subscript.
The overall heat transfer coefficient, U-value (W/(m2⋅K)) as defined in Eq. 7, was also used. It helped with comparisons between different envelope characteristics, independently of the temperature difference on each side of the wall.
![]()
In Eq. 7, Requi ((m2⋅K)/W) is the equivalent resistance of the wall.
Durability
Favorable conditions for the growth of mold and rot on Picea wood have been described (Hukka and Viitanen 1999; Viitanen and Ojanen 2007). With the temperature and relative humidity profiles obtained from simulations, it was possible to identify conditions favorable to mold growth.
WUFI uses a special type of graph (temperature on x-axis and relative humidity on y-axis) to show whether a chosen position in the wall is at risk at any time in the simulation. In the case considered here, the temperature and relative humidity were constant. Points were placed in space rather than over time to determine if conditions were favorable to mold growth developed in the wall. In the case of air exfiltration modeling, the relative humidity ranged from 30% to 60%, which is considered acceptable according to Standard 55 (ASHRAE 2013). In addition to the mold risk, the risk of condensation (relative humidity = 100%) in the wall was monitored.
RESULTS AND DISCUSSION
The results are presented in the following four sections: the validation of the model, the sizing of the gap, the simulation of energy efficiency, and the assessment of durability.
Model Validation
Figures 5-A, B, and C show the temperature and relative humidity curves through the thickness of the wall without a gap, such as modeled with WUFI and COMSOL. Boundary conditions were the same in both cases. The materials were the same; however, COMSOL used the parameters presented in Table 1 while WUFI used parameters from its materials database.
In Fig. 5-A the impact of using two insulating panels in a skin/core/skin configuration was simulated for comparisons with the simplified model shown in Fig. 5-B. The water vapor permeability of the skin being different from that of the core, the relative humidity profile was not linear. However, Fig. 5-A and Fig. 5-B show no difference in the relative humidity at the boundary with the CLT, which supports the decision to model a single layer of insulation with homogeneous properties. A difference in relative humidity profiles was observed between Fig. 5-B and Fig. 5-C. The difference between WUFI and COMSOL was under 5% in the XPS. It was greater in the CLT, as COMSOL tends to overestimate relative humidity in comparison to WUFI.
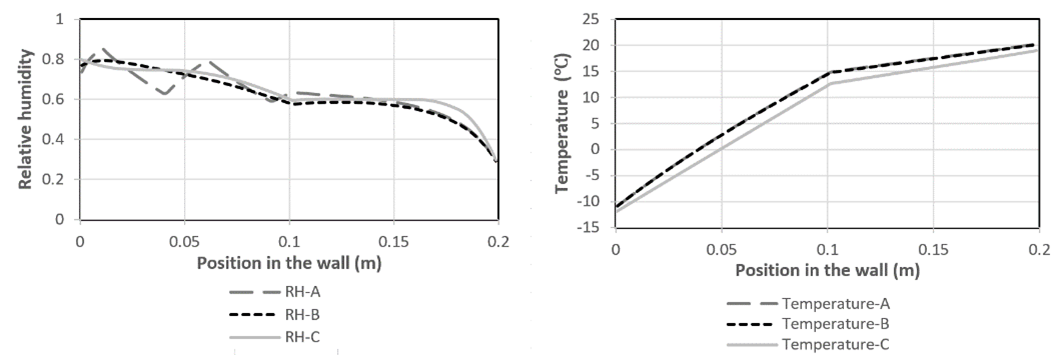
Fig. 5. (A) WUFI modeling of the impact of using two insulation panels, considering the skin/core/skin effect. (B) WUFI modeling of using one insulation panel, without the skin effect. (C) COMSOL modeling with parameters from the literature
The results from both models were close enough to validate the parameters used in the COMSOL model. This validation was mandatory to allow using COMSOL in complex cases with confidence.
In Wu (2007), the author noticed that it was rare to find hygrothermal parameters for specific building materials. There are different building systems used across the world and even if wood is a common material; it is used under various forms made from various species. Al Sayegh (2012) and Lepage (2012) showed that differences between CLTs from various origins (Europe and Canada) and the differences mainly came from the cracks in the wood and the way boards were glued together, this having an effect on the permeability of the panels. Ozolins et al. (2013) evaluated hygrothermal properties of multi-layered walls in cold climate using COMSOL and WUFI and confirmed the results with in-situ measurements. He concluded that both COMSOL and WUFI allowed a representative modeling under cold climate conditions. WUFI modeling was also validated by Winter et al. (2012) for massive wooden structures in a cold climate.
Gap Sizing
Table 2 contains data on the range of temperatures observed with the thermal camera imaging along the wall, and the temperature calculated with COMSOL for the wall at an angle connection.
Table 2. Approximate Temperature Observed Through Thermography and Modeling for 4 Pa and 50 Pa of Vacuum (infiltration) with the Dimensioned Gap

Figure 6-A is the cross-view of the angle connection of two walls simulated. The air leak path in the insulation is simplified to be aligned with the butt-joint junction in the CLT. Figure 6-B presents the average temperature on the interior edge of the gap for different gap widths in the insulation layer. It can be noticed that the temperature decreased with increasing width. For a 4 Pa pressure difference, a 0.72 mm gap width yielded a temperature in the target range.
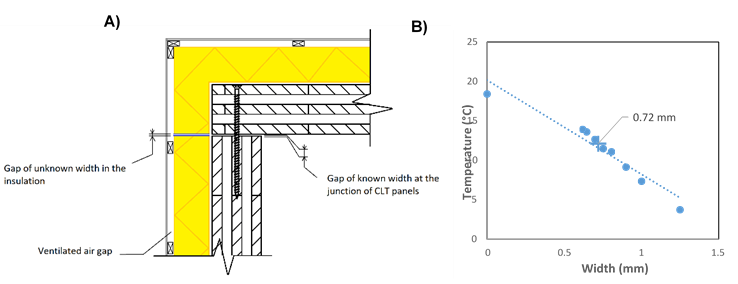
Fig. 6. A) Cross-view of the right-angle butt-joint junction showing the simulated air leak through the insulation. B) Average temperature on the edge of the gap (inside) at 4 Pa for different gap widths in the insulation layer
Figure 7 shows the temperature profile along the surface of the wall, with the angle and the gap in the middle. The surface temperature near the edge of the gap for a 50 Pa depression also fell within the range of observable temperatures on the thermograms.
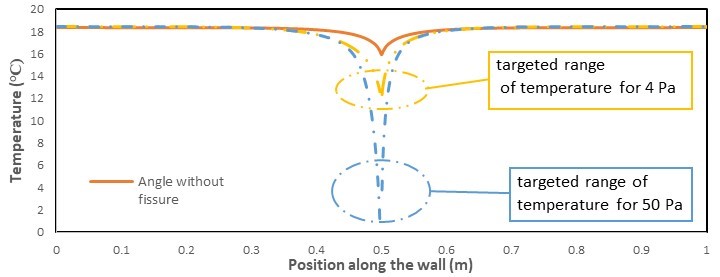
Fig. 7. Temperature profile along the surface of the wall with infiltration induced by 4 Pa and 50 Pa of depression.
The gap widths shown in Table 3 served as a reference for the estimation of assembly tolerance impact, i.e., that of gap width variations in the CLT layer.
Table 3. Reference Gap Widths in the CLT and Insulation Layer
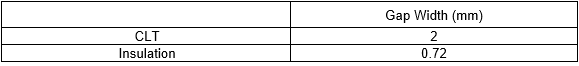
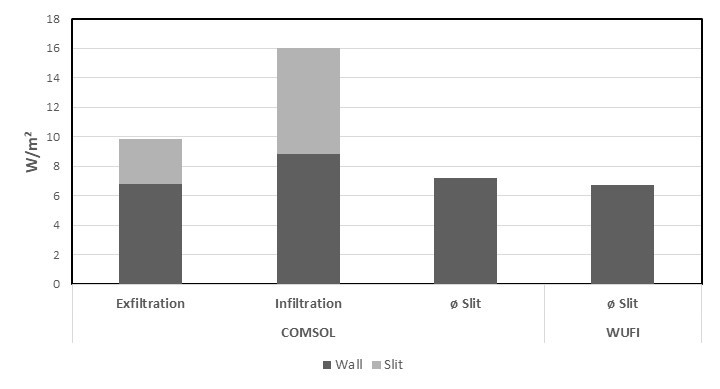
Fig. 8. Heat flux through the wall in cases of an exfiltration, an infiltration, and without any gap. The light gray area represents the heat flux specific to the convection.
Energy Efficiency
Figure 8 presents the average heat flux (W/m²) when exfiltration or infiltration occurs through a wall, and for a wall without any gap. The data were obtained from the COMSOL simulations. The infiltration and exfiltration were induced by a pressure difference of 4 Pa. A simulation with WUFI is also provided for comparison purposes. In the case of a wall without a gap, the results were similar for COMSOL and WUFI.
The dark gray part represents the heat flux through the wall. The light gray represents the heat flux through the gap, in cases of exfiltration and infiltration. It can be observed, that the heat flux through the wall was slightly greater with an infiltration than in the two other cases. This may be due to the cooling being induced by the infiltration. When the wall was cooler, the heat flux was greater. The part of heat flux passing through the gap was greater with infiltration (7.16 W) than with exfiltration (3.05 W).
Figure 9 represents the overall heat transfer coefficient (U) calculated from the above-mentioned flux values. As can be observed, the occurrence of infiltration or exfiltration led to deterioration of the insulating capacity of the wall. Values set in standards for Quebec (Régie du bâtiment du Québec 2012) and for PassivHaus (CanPHI 2012) are shown for comparison. PassivHaus is a standard for very high energy efficient buildings.
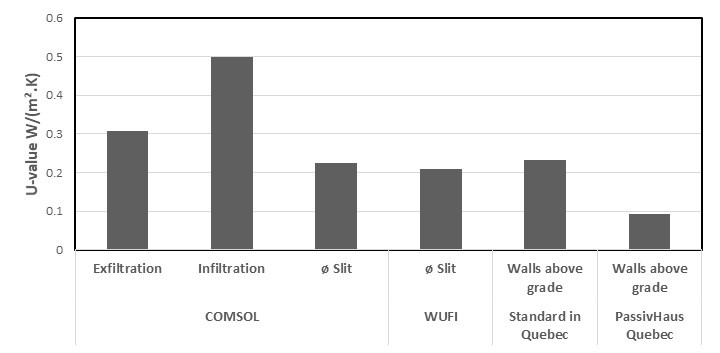
Fig. 9. Overall heat transfer coefficient, U, calculated from the above-mentioned heat flux values, compared with Quebec and PassivHaus standards
Figure 10-A is a schematic representation of the simulated case of the butt-joint junction presenting an air leakage. The screws used to fasten the boards are not modeled in the simulation. Figure 10-B shows how the heat transfer coefficient changed when the gap in the CLT increased from 0 mm to 20 mm. The heat flow increased (hence the value of U increased) as the gap expanded from 0 mm to 3 mm, after which it stabilized.
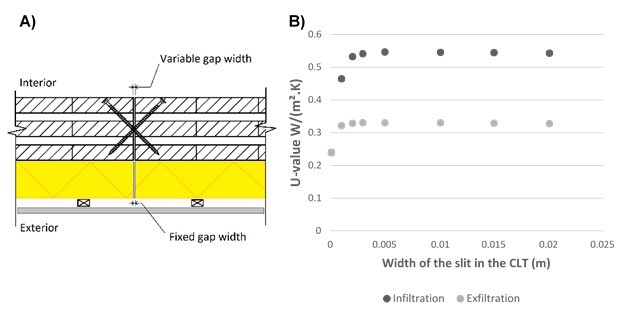
Fig. 10. A) Schematic illustration of the composition of the simulated wall B) Overall heat transfer coefficient for the wall with an increasing gap from 0 mm to 20 mm
Figure 11 presents the velocity of the air in the middle of the gap, as it flows across the wall, for both infiltration (left to right) and exfiltration (right to left), obtained from CFD modeling on COMSOL.
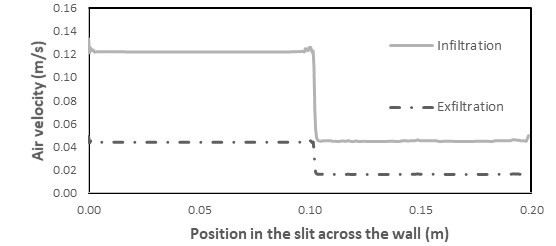
Fig. 11. Maximum velocity of the air in the gap across the wall
Flux lines are illustrated on Fig. 12, for both exfiltration (left) and infiltration (right). This representation helps to show the magnitude of the heat transfer from the wall to the fluid in the case of infiltration.
Bhattacharyya and Claridge (1995) explained that the heat flux induced by the occurrence of exfiltration/infiltration is the difference of the enthalpy between two environments at different temperatures multiplied by the leakage rate, alternatively it can be calculated with specific heat as shown in (Eq. 5), which is taken from McQuinston et al. (2005).
The difference between heat flux of infiltration and exfiltration is partly due to the difference in leakage rate. Indeed, even if the pressure difference is the same, the geometry of the gap does not allow the same velocity of the fluid. As shown on Fig. 11, in the case of exfiltration, air velocity increased with the contraction of the path. Conversely, air velocity decreased as the air path expanded. Even though the air velocity at the outlet was the same in both infiltration and exfiltration modes, the section of the gap was such that the flow rate was greater for infiltration than exfiltration.
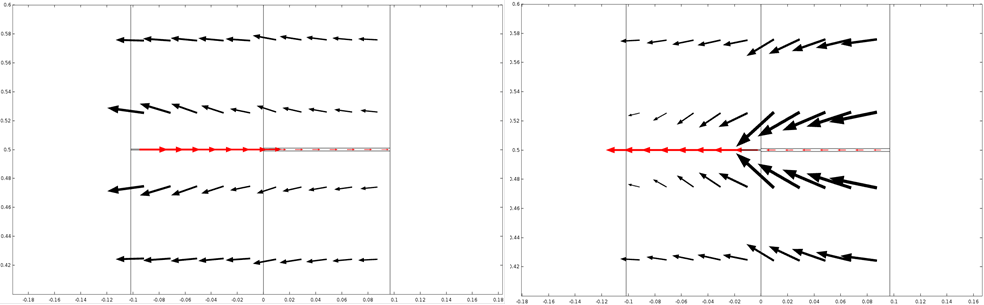
Fig. 12. Graphical representations of heat flux vectors seen on the cross-section of the wall (top view) with the gap at the center for exfiltration (left) and infiltration (right)
Buchanan and Sherman (2000) noticed, however, that the heat exchanges between the wall and the air running through the gap were not negligible. The wall is insulated from the exterior, which makes it warm (8 °C on average). An infiltration of cold air has more impact on the wall than an exfiltration of cold air, in terms of energy, as can be observed with the vectors of the flux shown in Fig. 12. Figure 9 clearly shows that, without a gap, the wall meets the Quebec standard, but not the PassivHaus standard. In both cases, the gap downgraded the insulating capacity of the wall.
As shown in Fig. 10, a plateau was attained as soon as the gap reached 3 mm, with both infiltration and exfiltration. This plateau is caused by the mass flow rate reaching a maximum for the parameters applied. The pressure drop rate in the gap was inversely proportional to the width of the gap, and it decreased as the gap widened. Beyond 3 mm, there was no more change in the pressure drop rate, which had an impact on the mass rate flow.
The difference between exfiltration and infiltration is also partly due to a difference in mass flow rates. In the case of exfiltration, there was a sudden contraction of the flow path, while for infiltration it was a sudden enlargement, thus there were different behaviors from a flow perspective (Massey and Ward-Smith 2005). Ojanen and Kumaran (1996) showed that the relative humidity differential between the exterior and interior environments did not have a significant impact on heat flux, but had an important impact on the moisture content of the material. Furthermore, given that infiltrated air is dryer than interior air, modern mechanical systems must humidify the fresh air to compensate, which is costly in energy.
Durability
Figure 13 shows how temperature and relative humidity conditions in the air and the wall can be favorable to mold growth, as described by Hukka and Viitanen (1999), for different values of exfiltrated air humidity (represented by the curves). It can be observed that the air relative humidity (RH) of 30% (lowest curve labeled RH-30) does not induce any risk, as all the dots are below the threshold for mold growth. The curves for air relative humidity values of 40%, 50%, and 60% are in part above the threshold, which means that, in case of exfiltration, these relative humidity levels can induce a risk of mold growth in the wall, on the surface of the gap. The higher the line is above the threshold line, the faster mold will be able to grow. The curves correspond to the temperature and relative humidity levels of positions in the wall along the gap, as shown as the line a on Fig. 14. These conditions become more favorable for mold as the relative humidity increases.
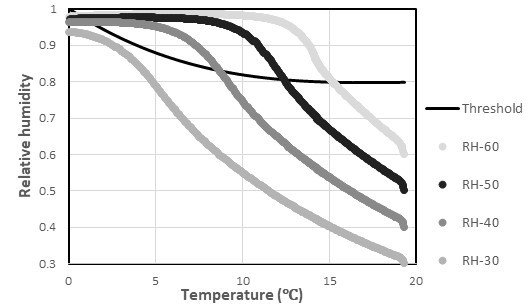
Fig. 13. Graphic representation of favorable conditions for mold growth in the wall due to exfiltration, for different air relative humidity values
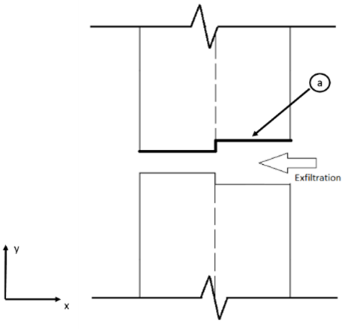
Fig. 14. Schematic representation of measurements taken along the gap, not to scale
Figure 15 shows the positions in the wall where conditions are favorable for mold growth. The y-axis represents the relative humidity of the exfiltrated air entering the gap. The vertical line traces the transition between CLT on the right and XPS on the left, showing that the spreading of the mold increases until reaching the CLT layer at a relative humidity between 50% and 60%.
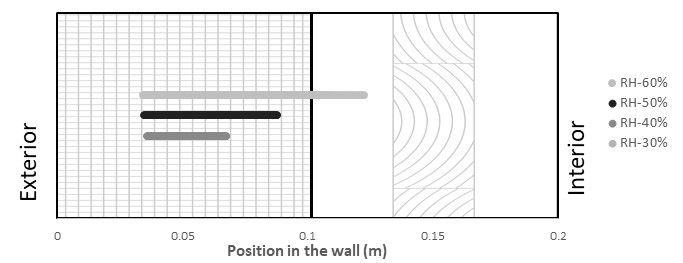
Fig. 15. Position in the wall of locations where there is a risk of mold growth. The black vertical line represents the boundary between the XPS (left) to the CLT (right)
Figure 16 represents the dew point curves (Tdp) of the exfiltrated air according to different relative humidities and the surface temperature of the wall in the slit (Tsurface), represented by the upper curve. Condensation forms on surfaces when the air is saturated in water vapor at the surface temperature, in other words when the dew point equals the surface temperature, as shown in the figure by lines superposed with the Tsurface curve. This figure shows that condensation occurs in every case of simulated exfiltration, near the outlet of the gap. The increase in relative humidity near the outlet is due to the temperature drop. It appears that condensation occurs only in the insulation layer.
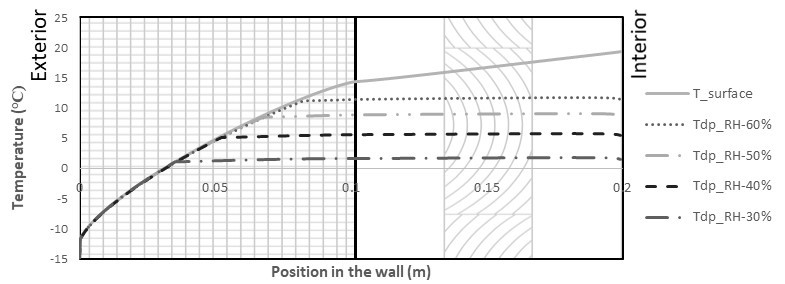
Fig. 16. Dew point of the exfiltrated air for its different relative humidities according to the position in the wall along the gap and temperature in the gap. The black vertical line represents the boundary between the XPS (left) to the CLT (right).
Condensation in winter can be a cause of moisture accumulation. Moisture condenses and solidifies as ice when the temperature falls below 0°C. Warmer weather causes the ice to melt and create favorable conditions for mold (Winter et al. 2012). In an in-situ study, Winter (2012) observed that diffusion through the wall was not enough to create an accumulation of ice under the external face. It seems clear, however, that air exfiltration will cause moisture accumulation in the wall near the outlet of the gap whenever the relative humidity reaches or exceeds 30%.
As regards to durability, infiltration was not found to represent a risk in winter because the dry exterior air did not lead to moisture accumulation (results not shown).
This work confirms the desirability to avoid any air movement in the wall through either infiltration or exfiltration, as concentrated air leakage entails serious consequences. In combination with a specific membrane, the CLT provides safety if it is continuous. To prevent the energy loss and durability problems identified in this research, the design of CLT assemblies should anticipate wood shrinkage and other causes for gaps. If necessary, overlapping assemblies, elastic/adhesive sealing membranes, or adhesives should be considered.
The simulations presented in this report were designed to replicate real conditions, while doing simplifications wherever possible. For that reason, temperature and humidity conditions varying in the short and long terms were not modeled in this work.
Variation of temperature and humidity conditions throughout the day was not implemented, as it was deemed unnecessary complication in the scope of evaluating the difference of efficiency between variations of a wall. Nevertheless it would be an interesting investigation for further research on the kinetic of humidification in the wall.
The scope of this study did not permit the specific measure of each parameters of the local CLT. As they are tenuous to evaluate with confidence without proper equipment and founding, this work employed experimental parameters from various literature deemed to be trustworthy and close enough to the used material.
It would also be of interest to simulate the effects of a gap under a range of climate conditions over a longer period.
CONCLUSIONS
In terms of energy efficiency, infiltration was found to have the worst impact, significantly downgrading the U-value of the surrounding wall. Gaps should be kept as small as possible, preferably under 1 mm (which leads to a leak rate of 63 L/h for 4Pa of differential pressure), to mitigate the effects on energy loss.
This research indicates that exfiltration can lead to mold growth in the wall when the indoor relative humidity reaches or exceeds 40%. If the relative humidity of the exfiltrated air reaches 60%, the conditions favorable for mold growth will extend to the CLT layer and may lead to biological deterioration in the long term, as mold growth is slower in insulation if it is not an organic material.
In all the relative humidity conditions used in the simulations, exfiltration induced the occurrence of condensation in the wall, near the outlet of the gap. This leads to moisture accumulation and, eventually, mold growth on any organic materials constituting the external face or insulation’s bracing. However, an event of humidification can be followed by a drying period, which stop the growth of mold. Mold needs an extended humid and warm period to settle in.
ACKNOWLEDGMENTS
The authors are grateful to the Natural Sciences and Engineering Research Council of Canada for financial support through its ICP and CRD programs (IRCPJ 461745-12 and RDCPJ 445200-12) as well as the industrial partners of the NSERC industrial chair on eco-responsible wood construction (CIRCERB).
REFERENCES CITED
Al Sayegh, G. (2012). Hygrothermal Properties of Cross-Laminated Timber and Moisture Response of Wood at High Relative Humidity, Master’s Thesis, Carleton University, Ottawa, Canada.
American Society of Heating Refrigerating and Air-Conditioning Engineers (ASHRAE) (2009). Handbook – Fundamentals, Atlanta, GA, USA.
ASHRAE Standard 55-2013 (2013). “Thermal environmental conditions for human occupancy,” American Society of Heating, Refrigerating and Air-Conditioning Engineers, Atlanta, GA, USA.
ASTM C1784-14 (2014). “Standard test method for using a heat flow meter apparatus for measuring thermal storage properties of phase change materials and products,” ASTM International, West Conshohocken, PA.
ASTM C518-17 (2017). “Standard test method for steady-state thermal transmission properties by means of the heat flow meter apparatus,” ASTM International, West Conshohocken, PA.
Bhattacharyya, S., and Claridge, D. E. (1995). “The energy impact of air leakage through insulated walls,” ASME. J. Sol. Energy Eng. 117(3), 167-172. DOI: 10.1115/1.2847761
Buchanan, C. R., and Sherman, M. H. (2000). A Mathematical Model for Infiltration Heat Recovery, Lawrence Berkeley National Lab (LBNL), Berkeley, CA.
Canadian Passive House Institut (CanPHI). (2012). “Design fundamentals (http://www.passivehouse.ca/ project/maison-bombardier), accessed on October 2017.
Crespell, P., and Gaston, C. (2011). The Value Proposition for Cross-Laminated Timber, FPInnovations, Montréal, Canada.
Cussler, E. L. (2009). Diffusion Mass Transfer in Fluid Systems, Cambridge University Press, Cambridge, UK.
FOAMULAR® 150 Rigid Foam Insulation. Owens Corning, 2011. Accessed on September 11, 2017. – http://www.foamular.com/foam/products/foamular-150.aspx.
Hukka, A., and Viitanen, H. A. (1999). “A mathematical model of mould growth on wooden material,” Wood Science and Technology 33(6), 475-485.
Krus, M., and Vik, A. (1999). “Determination of hygric material properties and calculation of the moisture balance of wooden prisms,” in: Proceedings of the 5th Symposium Building in the Nordic Countries, Göteborg, Sweden, pp. 313-320.
Laguarda Mallo, M. F., and Espinoza, O. (2014). “Outlook for cross-laminated timber in the United States,” BioResources 9(4), 7427-7443. DOI: 10.15376/biores.9.4.7427-7443
Lehmann, S. (2012). “Sustainable construction for urban infill development using engineered massive wood panel systems,” Sustainability 2012(4), 2707-2742. DOI: 10.3390/su4102707
Lepage, R. T. M. (2012). Moisture Response of Wall Assemblies of Cross-Laminated Timber Construction in Cold Climates, Master’s Thesis, University of Waterloo, Canada.
Massey, B., and Ward-Smith, J. (2005). Mechanics of Fluids, CRC Press, Boca Raton, FL, USA.
McKeever, D. B., and Elling, J. (2015). Wood Products Other Building Materials Used in New Residential Construction in the United States. APA – The Engineered Wood Assoc., Tacoma, WA, 131 pp.
McQuinston, F., Parker, J. D., and Spitler, J. D. (2005). Heating Ventilating and Air Conditioning, Wiley, Hoboken, NJ, USA.
Mostinsky, I. L. (2011). “Diffusion coefficient,” (http://www.thermopedia.com/content/696/), Accessed on January 2017.
Natural Resources Canada (2016). “Cross-laminated timber,” (http://www.nrcan.gc.ca/forests/industry/products-applications/15829), Accessed on September 11, 2017.
Nordic Structures, (2015). Guide pour la Construction non Résidentielle: Nordic X-LAM. Montréal, p. 44.
Nordic Structures (2017). Perméabilité à la Vapeur d’Eau, Nordic X-Lam, Montréal, p. 1.
O’Connor, J., Mahalle, L., and Berry, A. (2011). “Environmental performance of cross-laminated timber,” in: Cross-laminated Timber Handbook, FPInnovations, Montreal, Canada.
Ojanen, T., and Kumaran, K. (1996). “Effect of exfiltration on the hygrothernal behaviour of a residential wall assembly,” Journal of Thermal Insulation and Building Envelopes 19, 215-227.
Ozolins, A., Jakovics, A., and Ratnieks, A. (2013). “Moisture risks in multi-layered walls – Comparison of COMSOL-Multiphysics and WUFI-Plus models with experimental results,” in: COMSOL Conference, Rotterdam, Netherlands, p. 6.
Pineault, D., and Bérubé-Dufour, M. (2016). Rapport Final (SEP490945-15): Vérification de la Performance et Optimisation des Maisons de Chantier Fabriquées en CLT, SEREX, Amqui, Canada.
Régie du bâtiment du Québec (2012). Code de Construction du Québec: Partie 11: Efficacité Énergétique, Gouvernement du Québec.
Schickhofer, G. (2015). “Glued wood products for structural use, cross laminated timber,” in: 3rd European Forest Week (SILVA2015), Engelberg, Switzerland, p. 41.
Schirmer, R. (1938). Die Diffusionswiderstandszahl von Wasserdampf-Luftgemischen und die Verdampfungsgeschwindigkeit, VDI Beiheft Verfahrenstechnik, p. 170.
Skogstad, H. B., Gullbrekken, L., and Nore, K. (2011). “Air leakages through cross laminated timber (CLT) constructions,” in: NSB 2011 9th Nordic Symposium on Building Physics, Tampere, Finland, pp. 89-96.
Viitanen, H., and Ojanen, T. (2007). “Improved model to predict mold growth in building materials,” in: American Society of Heating, Refrigerating and Air-Conditioning Engineers.
Viitanen, H., and Ritschkoff, A. C. (1991). Mould Growth in Pine and Spruce Sapwood in Relation to Air Humidity and Temperature, Swedish University of Agricultural Sciences, Uppsala, Sweden.
Winter, S., Schulte-Wrede, M. and Jebens, K. (2012). “Highly insulated wooden structures in Nordic climate,” in: World Conference on Timber Engineering, Auckland, New Zealand, p. 8.
Wu, Y. (2007). Experimental Study of Hygrothermal Properties for Building Materials, Master’s Thesis, Concordia University, Montréal, Canada.
Article submitted: March 13, 2018; Peer review completed: August 10, 2018; Revised version received: November 21, 2018; Accepted: November 22, 2018; Published: November 28, 2018.
DOI: 10.15376/biores.14.1.518-536