
Abstract

Paper, or a pulp fiber sheet, is biodegradable and it can be a promising alternative to plastics, thus avoiding a serious form of marine pollution. However, its degradability in marine environments has not been well studied. This study investigated how a network of pulp fibers disintegrates in seawater compared with soil. Samples of pulp fiber sheets were exposed to seawater and soil for 4 months under stationary conditions at 25 °C. Digital photo images and scanning electron microscopy (SEM) images were used for morphological and color change investigations, while Fourier transform infrared (FT-IR) analysis was used to compare the chemical components of the samples before and after degradation. The area of the sample decreased by 22.3% in the seawater. The degradation rate in seawater was much lower than in the soil. The degradation mechanism in seawater was different from that in the soil because of the different microorganisms in each environment.
Download PDF
Full Article
Morphology and Color Change of Pulp Fiber Sheet in Seawater and Soil
Akane Hosaka,a Makoto Yoshida,b Yoshiki Horikawa,b and Ryota Kose b,*
Paper, or a pulp fiber sheet, is biodegradable and it can be a promising alternative to plastics, thus avoiding a serious form of marine pollution. However, its degradability in marine environments has not been well studied. This study investigated how a network of pulp fibers disintegrates in seawater compared with soil. Samples of pulp fiber sheets were exposed to seawater and soil for 4 months under stationary conditions at 25 °C. Digital photo images and scanning electron microscopy (SEM) images were used for morphological and color change investigations, while Fourier transform infrared (FT-IR) analysis was used to compare the chemical components of the samples before and after degradation. The area of the sample decreased by 22.3% in the seawater. The degradation rate in seawater was much lower than in the soil. The degradation mechanism in seawater was different from that in the soil because of the different microorganisms in each environment.
Keywords: Degradation; Pulp fiber sheet; Fungi; Bacteria; Marine environment; Soil environment; SEM; FT-IR
Contact information: a: Department of Environmental and Natural Resource Sciences, Faculty of Agriculture, Tokyo University of Agriculture and Technology, Fuchu, Tokyo 183-8509 Japan; b: Division of Natural Resources and Ecomaterials, Institution of Agriculture, Tokyo University of Agriculture and Technology, Fuchu, Tokyo 183-8509 Japan; *Corresponding author: kose@cc.tuat.ac.jp
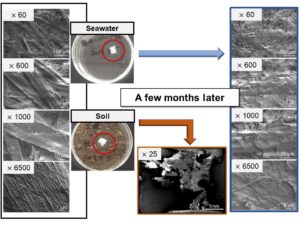
GRAPHICAL ABSTRACT
INTRODUCTION
The use of plastics has adverse effects on the ecosystem because their feedstock is unrenewable, and their life cycle generates CO2 (Akiyama et al. 2003; Dharmaraj et al. 2021). Plastics pollute oceans by suffocating marine animals and carrying harmful chemicals into the food chain (Ng et al. 2018; Tanaka et al. 2020; Bandini et al. 2021). The biodegradation of plastics derived from petroleum is very slow because of their artificially synthesized hydrophobic structure; therefore, fragmented plastics remain in the ocean for a long time and negatively impact marine and terrestrial lives (Geyer et al. 2017; Kumar et al. 2021).
Paper or pulp fiber sheets have recently gained considerable attention as potential alternatives to plastic for several reasons. First, paper retains the natural structure of cellulose molecules, and therefore, it is expected to be more environmentally friendly than plastics (Liu et al. 2020). Second, pulp fiber sheets are produced using wood as a renewable material, which as an inedible resource does not have a negative effect on food security (Taha et al. 2016). Third, the production and supply chain of pulp fiber sheets are well consolidated in the market (FAO 2019).
A pulp fiber sheet is a network of tightly attached pulp fibers consisting of bundles of cellulose microfibrils (Seidlhofer et al. 2021). Degradation of cellulose at the molecular level has been studied for decades, and it is known that fungi and other microorganisms produce cellulose-degrading enzymes (Nair et al. 2011; Liu et al. 2012; Bentil et al. 2018). Also, some studies investigated the effect of cellulase on wastepaper (van Wyk and Leogale 2001). However, these studies do not describe the initial stages of degradation, which start from the exposure of pulp fiber sheet, as a network of cellulosic fibers, to different environments.
Moreover, the degradability of pulp fiber sheet is well known in composts, or in soil but not in the marine environment, where the temperature, oxygen content, and microbial communities are significantly different from those of compost. Some cellulosic fibers such as cotton and rayon are biodegradable in sea and lake water if they are small enough to be easily depolymerized (Zambrano et al. 2020). However, no study investigated how the cellulosic materials with higher-order structures start degrading in seawater until now.
This study investigated the decomposition behavior and the intermediate state of the pulp fiber sheet, or the intricate network of pulp fibers in the first stages of degradation in seawater. Such consideration is important so that the amount of pulp fiber sheet allowed to be released into the ocean without negatively affecting the marine environment will be revealed. In the case of pulp fiber sheets, understanding the degradation process of the pulp fiber network is crucial.
The pulp fiber sheet was prepared and exposed to seawater in shallow containers. Soil and sterilized seawater were used for comparison purposes. This study highlighted the effect of marine microorganisms on the pulp fiber sheet; hence, factors such as light and waves were not taken into consideration.
EXPERIMENTAL
Materials
Softwood bleached kraft pulp treated by PFI mill was used to prepare pulp fiber sheets with density of 0.69 g/cm3 according to ISO 5269-1 (2005), which were then cut into 1 cm² pieces. Seawater (brackish water with salinity of 9.11 psu) was sampled in Tokyo Bay at the wharf of Tokyo University of Marine Science and Technology in Tokyo on May 17, 2019 and dispensed into several bottles. All bottles were placed in a deep freezer and removed as needed. Unfreezing was performed by incubating the bottles at room temperature overnight. Sterilized seawater was prepared by autoclaving seawater for 20 min at 121 °C. The soil sample was taken from a farm on the campus of the Tokyo University of Agriculture and Technology on August 5, 2019.

Fig. 1. Experimental state of pulp fiber sheets in (a) seawater, (b) sterilized seawater, and on (c) soil
Methods
Incubation of samples
The experiment began on August 5, 2019. Each culture dish was filled with either seawater (15 mL), sterilized seawater (15 mL), or soil (30 g). A 1 cm² pulp fiber sheet was placed at the bottom of the dish or on top of the soil (Fig. 1). Eleven replicates were tested for each condition (33 samples in total). The dishes were stored in an incubator to keep the temperature constant at 25 °C, and the first-day samples were denoted as “day 0.” The soil samples were humidified by spraying water over time during the 129 days of the experiment.
Measurement of pulp fiber sheet area with time
To track the changes in the samples, photos were captured using a camera (Canon PowerShot SX720 HS; Canon Inc., Tokyo, Japan) approximately every two weeks. For samples with seawater and sterilized seawater, a Gel Imager (mini-boxN 3-360-0894, KENIS Ltd., Osaka, Japan) was used to maintain a fixed distance between the dish and the camera and to shut out the light from the outside. A light board (33364, VANCO, Osaka, Japan) was used to maintain constant illumination inside the device (Fig. 2). For the samples in seawater and sterilized seawater, the change in area was quantified using the captured images and image analysis software Image-Pro Premier Office 9.1 (Media Cybernetics, Inc., MD, USA). The area of each sample was measured by counting pixels in the images.

Fig. 2. Camera, gel imager, and light board used for capturing images
Quantification of color change
The color change was analyzed using Image-Pro Premier Office 9.1. The intensities of colors (red, green, and blue) observed on days 0 and 129 were converted into graphs. The prominent peaks that appeared in these graphs were used to quantify the change in color. For example, Fig. 3 shows the intensity of the red color on days 0 and 129. The horizontal axis represents the intensity of red color. The horizontal axis 0 indicates the most intense red, whereas the horizontal axis 255 indicates pure white. The vertical axis represents the number of pixels. On day 0, a prominent peak was observed at 223, whereas on day 129, a prominent peak was observed at 155. The change in color was calculated using Eq. 1,
 (1)
(1)
where CC is change in color (%), is the peak intensity of day 0, and is the peak intensity of day 129. In this case, the percentage change in color is 30%.

Fig. 3. Number of pixels at different intensities of red color on day 0 and day 129
Scanning electron microscopy (SEM)
Observation of the pulp fiber sheets at the microscale was performed using a SEM device (JSM-7100, JOEL Ltd., Tokyo, Japan). Day 100 samples were prepared by soaking the samples in seawater or by placing them on soil for 100 days and freeze-drying overnight. The day 0 sample was prepared by soaking samples in Milli-Q water for half a day followed by freeze-drying overnight. All samples were vapor-deposited with platinum using an ion sputter (JFC-1100, JOEL Ltd., Tokyo, Japan) for 4 min before observation.
Fourier transform infrared (FT-IR) analysis
To obtain information about the chemical composition on the surface of the samples, FT-IR analysis of the pulp fiber sheets was performed using a PerkinElmer Frontier system (Perkin Elmer, Inc., Waltham, USA) equipped with an ATR accessory. Day 100 samples were prepared in the same manner as for the SEM observation, and day 0 sample were prepared by soaking the sample in seawater for 2 h before freeze-drying overnight.
RESULTS AND DISCUSSION
Difference in Morphology and Color of Sheets in Seawater and Soil
Figure 4a shows the result of samples in seawater. While reddish-purple stains and the growth of yellow-green hyphae were observed in the samples placed on the soil by day 44 (Fig. 4c), brown or yellow color changes were observed in the samples in seawater. By day 101, two of the samples in the soil disappeared or became invisible (data not shown), and the remaining samples showed an appreciable reduction in area. In comparison, most of the samples in seawater retained their original sizes. The samples with brownish color on day 44 became dark brown by day 101 (Fig. 4a, samples 3, 4, 5, 6, 9, 10, and 11), but those with yellow or no color change on day 44 did not become brown by day 101 (Fig. 4a, samples 2, 7, and 8).
Figure 4d and 4e show the different patterns of degradation in seawater. The sample before degradation is Fig. 4h. In seawater, some samples showed a decrease in area (Fig. 4d), while the other samples retained their original shapes even after 101 days (Fig. 4e).
This result suggested that, in the stationary state, the degradation of the network of a pulp fiber sheet in seawater takes a longer time than that in soil. However, in a natural marine environment, water currents may be agitated, so the speed of degradation can be different from that of stationary condition. Further studies are required to examine the effects of water currents.


Fig. 4. Morphology and color of pulp fiber sheets on days 0, 44, 72, and 101 in (a) seawater, (b) sterilized seawater and (c) soil. (c) represents 11 samples placed on the soil. The images at the bottom are magnified images of (d) sample 6 and (e) sample 7 of day 101 in Fig. 4a, (f) sample 5 and (g) sample 7 of day 101 in Fig. 4b. (h) indicates the day 0 sample
SEM was employed to observe the surface of the samples at the microscale. Figure 5 shows the SEM images of the day 0 sample (Fig. 5a) and samples exposed to seawater (Fig. 5b) and soil (Fig. 5c) for 100 days. The sample exposed to soil displayed partial disintegration of the pulp fiber network and the deterioration of fibers within the network. In contrast, the samples exposed to seawater retained the network of pulp fibers without evident deterioration of the fibers, even after 100 days. Additionally, fibers can deteriorate without significantly disintegrating the pulp fiber network in the soil. These differences in morphological change would reflect the differences in the organisms that play a crucial role in degrading the pulp fiber sheet in each medium. Bacteria, the main decomposers in seawater, are known to form biofilms on the surface of their substrate; hence, it can be assumed that they degrade the sample sheet gradually from the surface or the edges of the sheet (Haider et al. 2019). In contrast, fungi, the primary decomposers in soil, directly attack the substrate by extending their hyphae. That might be why they degrade the sample sheet randomly (Ye et al. 2020; Gutierrez-Medina et al. 2021).

Fig. 5. SEM images of (a) day 0 sample and day 129 samples in (b) seawater and (c) soil
Morphological Comparison of Sheets in Seawater and Sterilizing Seawater
Figure 6 compares the samples in seawater on day 0 and day 100 at different magnifications. At higher magnifications, thin layers over pulp fibers (Fig. 6, right column) were observed only on day 100 samples.

Fig. 6. SEM images of the day 0 (left column) and day 100 (right column) samples in seawater. The magnifications are ×60 (a, b), ×1000 (c, d), and ×6500 (g, h)
In Fig. 4b, none of the samples in sterilized seawater showed a change in color by day 101, but the adhesion of yellow or dark-colored substances was observed in samples 1, 4, 6, 7, and 9 of Fig. 4b, and a transparent and gelatinous coating was observed in samples 2 of Fig. 4b. These findings suggested that such adhesion was due to the contamination of microorganisms during the experiment or marine fungi whose spores (Ruiz et al. 2021) survived the one-time autoclaving (Huesca-Espitia et al. 2016). The comparison of the degradation behaviors in seawater and sterilized seawater is shown in Fig 4d, 4e, 4f, and 4g. Unlike in seawater (Fig. 4d, 4e), the samples in sterilized seawater showed only slight changes in their sizes, shapes, and colors (Fig. 4f, 4g).
Figure 7 shows the results of image analysis of samples in seawater and sterilized seawater. The seawater samples showed a decrease in area by approximately 22.3% on average, whereas sterilized seawater showed a decrease in area by approximately -0.8% on average. The slight increase in the pulp fiber sheet area in sterilized seawater can be explained by the swelling of the pulp fiber network when it was exposed to water. Based on the photographic images and image analysis, it is suggested that the microorganisms in the media were related to the extent of degradability.
Figure 8 shows the image analysis results in terms of color change for samples in seawater and sterilized seawater. Color analysis (red, green, and blue) of the samples in seawater revealed that the color intensity increased by 20.8%, 33.3%, and 46.3% on average, respectively. In sterilized seawater, the color intensity increased by 1.2%, 1.7%, and 2.1% on average, respectively. An increase in color intensity reflects the color changes, as observed in Fig. 4. Various marine bacteria produce pigmented metabolites such as carotene, prodigiosin, and melanin (Soliev et al. 2011). The metabolites derived from marine microorganisms may have caused a color change.

Fig. 7. Change in the areas of the samples in seawater and sterilized seawater after 129 days. The area of the day 0 sample was set as 100% in each condition.

Fig. 8. Color change ratio (red, green, blue) of pulp fiber sheet after 129 days in seawater (3 bars on the left) and sterilized seawater (3 bars on the right)
Figure 9 shows the FT-IR spectra of the samples soaked in seawater for 2 h (day 0 sample) and 100 days (day 100 sample). In the spectrum of day 0 sample, a prominent band was obtained at 1054 cm⁻¹, which is attributed to the C3-O3H stretching of cellulose and hemicellulose molecules (Horikawa et al. 2019; Vallejo et al. 2021). In the spectrum of day 100 sample, however, prominent bands were obtained at 2957, 2926, 2873, 1725, 1636, 1541, 1133, and 1105 cm⁻¹.
Based on the information given in the studies by Maquelin et al. (2002) and Ariafar et al. (2019), the bands observed in the spectrum of day 100 sample corresponded to protein, lipids, polysaccharides, and nuclei, which are the components of bacterial cells and biofilms (Sauer et al. 2007; Percival et al. 2011) produced by bacteria. Specifically, the bands at 2957 cm⁻¹ and 2926 cm⁻¹ correspond to CH₃ and CH₂ antisymmetric stretching of lipids respectively and the band at 2873 cm⁻¹ corresponds to the CH₃ symmetric stretching of protein. The bands at 1541 and 1133 cm⁻¹ correspond to amide II consisting of 60 % N-H bending and 40 % C-N stretching (protein) and CO-O-C antisymmetric stretching (carbohydrates and nucleic acids), respectively (Ariafar et al. 2019). As for the bands at 1725 and 1636 cm⁻¹, they are consistent with >C=O stretching of carbonic acid and amide I of -pleated sheet structure of protein respectively (Maquelin et al. 2002). The band at 1105 cm⁻¹ may correspond to either PO₂⁻ symmetric stretching or C-N⁺-C stretching of nucleic acids or C-OH stretching of oligosaccharide (Ariafar et al. 2019; Maquelin et al. 2002).
Based on the FT-IR analysis, it is more likely that the layers and substances observed in the SEM images were derived from bacteria rather than from the degraded cellulose of the pulp. Comparative image analysis of the samples placed in sterilized seawater and SEM images as well as FT-IR analysis suggested that the color change of the pulp fiber sheet in seawater was caused by the bacteria contained in seawater rather than the chemical components of seawater itself.

Fig. 9. FT-IR spectrum of samples placed in seawater for 0 day (broken line) and 100 days (solid line)
The present study did not consider the effect of the papermaking additives on the specimens, brightness conditions, nor water currents in the ocean. These factors may be taken into consideration in future studies.
CONCLUSIONS
It is essential to know the time scale and intermediate state of the degradation of pulp fiber sheet when it is used as an eco-material. This study evaluated the changes over time in terms of the structure and color of pulp fiber sheets in seawater, soil, and sterilized seawater. In the stationary experimental setting, the extent of the area change of the pulp fiber sheet samples in seawater was much smaller than that in the soil.
- The mechanisms of degradation were different in soil and seawater. The SEM images, the comparison with sterilized seawater in terms of morphology and color change, and the FT-IR spectra suggested that the morphological changes of samples in seawater were different from those in soil because of bacteria, the main decomposers in marine environments. It was found important to consider the behaviors of the pulp fiber network in addition to the behaviors of fibers themselves when degradation of pulp fiber sheet is discussed. Furthermore, in investigation and comparison of degradation in different environments, it is important to pay attention to microorganisms who play a major role in degradation in each environment.
- To properly understand how to use paper products as the eco-material, it is necessary to consider the various environments in which such products may end up and the organisms responsible for decomposition in those environments.
ACKNOWLEDGMENTS
The authors thank Dr. Hideshige Takada from Tokyo University of Agriculture and Technology for preparation of the seawater sample used in this study. The authors also would like to thank Editage (www.editage.com) for English language editing.
REFERENCES CITED
Akiyama, M., Tsugea, T., and Doi, Y. (2003). “Environmental life cycle comparison of polyhydroxyalkanoates produced from renewable carbon resources by bacterial fermentation,” Polymer Degradation and Stability 80, 183-194. DOI: 10.1016/S0141-3910(02)00400-7
Ariafar, M. N., Iğci, N., Akçelik, M., and Akçelik, N. (2019). “Investigation of the effect of different environmental conditions on biofilm structure of Salmonella enterica serotype Virchow via FTIR spectroscopy,” Archives of Microbiology 201, 1233-1248. DOI: 10.1007/s00203-019-01681-5
Bandini, F., Hchaichi, I., Zitouni, N., Missawi, O., Cocconcelli, P. S., Puglisi, E., and Banni, M. (2021). “Bacterial community profiling of floating plastics from South Mediterranean sites: First evidence of effects on mussels as possible vehicles of transmission,” Journal of Hazardous Materials 411, 125079. DOI: 10.1016/j.jhazmat.2021.125079
Bentil, J. A., Thygesen, A., Mensah, M., Lange, L., and Meyer, A. S. (2018). “Cellulase production by white-rot basidiomycetous fungi: solid-state versus submerged cultivation,” Applied Microbiology and Biotechnology 102 (14) 5827-5839. DOI: 10.1007/s00253-018-9072-8
Dharmaraj, S., Ashokkumar, V., Hariharan, S., Manibharathi, A., Show, P. L., Chong, C. T., and Ngamcharussrivichai, C. (2021). “The COVID-19 pandemic face mask waste: A blooming threat to the marine environment,” Chemosphere 272, DOI: 10.1016/j.chemosphere.2021.129601
FAO STAT. (2019). “Forestry Production and Trade. Production of paper and paperboard,” (http://www.fao.org/faostat/en/#data/FO), Accessed 19 May 2021.
Geyer, R., Jambeck, J. R., and Law, K. L. (2017). “Production, use, and fate of all plastics ever made,” Science Advances 3 (7), DOI: 10.1126/sciadv.1700782
Guti´errez-Medina, B., and Vazquez-Villa, A. (2021). “Visualizing three-dimensional fungal growth using light sheet fluorescence microscopy,” Fungal Genetics and Biology 150, DOI: 10.1016/j.fgb.2021.103549
Haider, T. P., Vçlker, C., Kramm, J., Landfester, K., and Wurm, F. R. (2019). “Plastics of the future? The impact of biodegradable polymers on the environment and on society,” Angew. Chem. Int. Ed. 58, 50-62. DOI: 10.1002/anie.201805766
Horikawa, Y., Hirano, S., Mihashi, A., Kobayashi, Y., Zhai, S., and Sugiyama, J. (2019). “Prediction of lignin contents from infrared spectroscopy: Chemical digestion and lignin/biomass ratios of Cryptomeria japonica,” Applied Biochemistry and Biotechnology 188, 1066-1076. DOI: 10.1007/s12010-019-02965-8
Huesca-Espitia, L. C., Suvira, M., Rosenbeck, K., Korza, G., Setlow, B., Li, W., Wang, S., Li, Y. -q., and Setlow, P. (2016). “Effects of steam autoclave treatment on Geobacillus stearothermophilus spores,” Journal of Applied Microbiology 121, 1300-1311. DOI: 10.1111/jam.13257
ISO 5269-1 (2005). “Pulps — Preparation of laboratory sheets for physical testing — Part 1: Conventional sheet-former method,” International Organization for Standardization, Geneva, Switzerland.
Kumar, M., Chen, H. Y., Sarsaiya, S. Qin, S. Y., Liu, H. M., Awasthi, M. K., Kumar, S., Singh, L., Zhang, Z. Q., Bolan, N. S., et al. (2021). “Current research trends on micro- and nano-plastics as an emerging threat to global environment: A review,” Journal of Hazardous Materials 409. DOI: 10.1016/j.jhazmat.2020.124967
Liu, W., Liu, H., Liu, K., Du, H., Ying Liu, Y., and Si, C. (2020). “Paper-based products as promising substitutes for plastics in the context of bans on non-biodegradables,” BioResources 15(4), 7309-7312. DOI: 10.15376/biores.15.4.7309-7312
Liu, H. Q., Feng, Y., Zhao, D.Q., and Jiang, J. X. (2012). “Evaluation of cellulases produced from four fungi cultured on furfural residues and microcrystalline cellulose,” Biodegradation 23 (3) 465-472. DOI: 10.1007/s10532-011-9525-6
Lu, X., Liu, Q., Wu, D., Al-Qadiri, H. M., Al-Alami, N. I., Kang, D-H., Shin, J-H., Tang, J., Jabal, J. M. F., Aston, E. D., and Rasco, B. A. (2011). “Using of infrared spectroscopy to study the survival and injury of Escherichia coli O157:H7, Campylobacter jejuni and Pseudomonas aeruginosa under cold stress in low nutrient media,” Food Microbiology 28. 537-546. DOI: 10.1016/j.fm.2010.11.002
Maquelin, K., Kirschner, C., Choo-Smith, L.-P, Braak, N. v. d., Endtz, H.ph., Naumann, D., and Puppels, G. J. (2002). “Identification of medically relevant microorganisms by vibrational spectroscopy,” Journal of Microbiological Methods 51(3), 255-271. DOI: 10.1016/S0167-7012(02)00127-6
Nair, M. P. D., Padmaja, G., and Moorthy, S. N. (2011). “Biodegradation of cassava starch factory residue using a combination of cellulases, xylanases and hemicellulases,” Biomass & Bioenergy 35 (3) 1211-1218. DOI: 10.1016/j.biombioe.2010.12.009
Ng, E-L., Lwanga, E. H., Eldridge, S. M., Johnston, P., Hu H-W., Geissen, V., and Chen, D. (2018). “An overview of microplastic and nanoplastic pollution in agroecosystems,” Science of the Total Environment 627, 1377-1388. DOI: 10.1016/j.scitotenv.2018.01.341
Percival, S. L., Malic, S., Cruz, H., and Williams, D. W. (2011). “Introduction to Biofilms,” in: Biofilms and Veterinary Medicine, Springer Series on Biofilms, Vol. 6, S. Percival, D. Knottenbelt, and C. Cochrane (eds.), Springer, Berlin, pp. 41-68. DOI: 10.1007/978-3-642-21289-5_2
Ruiz, V., Alonso, R., Salvador, M., Condón, S., and Condón-Abanto, S. (2021). “Impact of shoulders on the calculus of heat sterilization treatments with different bacterial spores,” Food Microbiology 94. DOI: 10.1016/j.fm.2020.103663
Sauer, K., Rickard, A. H., and Davies, D. G. (2007). “Biofilms and biocomplexity,” Microbe 2 (7), 347-353. DOI: 10.1128/microbe.2.347.1
Seidlhofer, T., Czibula, C., Teichert, C., Hirn, U., and Ulz, M. H. (2021). “A compressible plasticity model for pulp fibers under transverse load,” Mechanics of Materials 153 DOI: 10.1016/j.mechmat.2020.103672
Soliev, A. B., Hosokawa, K., and Enomoto, K. (2011). “Bioactive pigments from marine bacteria: Applications and physiological roles,” Evidence-Based Complementary and Alternative Medicine 2011, DOI: 10.1155/2011/670349
Taha, M., Foda, M., Shahsavari, E., Aburto-Medina, A., Adetutu, E., and Ball, A. (2016). “Commercial feasibility of lignocellulose biodegradation: Possibilities and challenges,” Current Opinion in Biotechnology 38, 190-197. DOI: 10.1016/j.copbio.2016.02.012
Tanaka, K., Watanuki, Y., Takada, H., Ishizuka, M., Yamashita, R., Kazama, M., Hiki, N., Kashiwada, F., Mizukawa, K., Mizukawa, H., et al. (2020). “In vivo accumulation of plastic-derived chemicals into seabird tissues,” Current Biology 30(4), 723-728.e1–e3. DOI: 10.1016/j.cub.2019.12.037
Vallejo, M., Cordeiro, R., Dias, P. A. N., Moura, C., Henriques, M., Seabra, I. J., Malça, C. M., and Morouço, P. (2021). “Recovery and evaluation of cellulose from agroindustrial residues of corn, grape, pomegranate, strawberry-tree fruit and fava,” Bioresources and Bioprocessing 8, 25. DOI: 10.1186/s40643-021-00377-3
van Wyk, J. P. H., and Leogale, P. B. (2001). “Saccharification of wastepaper mixtures with cellulase from Penicillium funiculosum,” Biotechnology Letters 23 (22) 1849-1852. DOI: 10.1023/A:1012706708176
Ye, R., Xu, S., Wang, Q., Fu, X., Dai, H., and Lu, W. (2020). “Fungal diversity and its mechanism of community shaping in the milieu of sanitary landfill,” Frontiers of Environmental Science & Engineering 15, 77. DOI: 10.1007/s11783-020-1370-6
Zambrano, M. C., Pawlak, J. J., Daystar, J., Ankeny, M., and Goller, C. C. (2020). “Aerobic biodegradation in freshwater and marine environments of textile microfibers generated in clothes laundering: Effects of cellulose and polyester-based microfibers on the microbiome,” Marine Pollution Bulletin 151. DOI: 10.1016/j.marpolbul.2019.110826
Article submitted: June 9, 2021; Peer review completed: July 24, 2021; Revised version received and accepted: August 24, 2021; Published: August 31, 2021.
DOI: 10.15376/biores.16.4.6943-6953