
Abstract
The wood grade used for Chinese zither panels is primarily determined through an artificial experience method, and the number of related practitioners is decreasing annually. In this study, a method using an improved BP neural network is proposed to assess the wood grade for Chinese zither panels. Abnormal spectral samples were first removed based on the Mahalanobis distance method. Normalization and Savitzky Golay second derivatization were applied to the remaining data set. According to the spectral peak, the spectral data were divided into three bands, which were applied to the model proposed in this paper, and the most critical spectral region for judging the wood grade of Chinese zither panels was obtained. Through principal component analysis, the appropriate feature variables were selected and applied to the experimental model for an analysis to reduce the calculated amount in the experiment. When the number of principal components was 6, the classification accuracy of unknown samples was 96.7%. Compared with the PLS model, the proposed model is more robust and accurate and has fewer losses. The experimental results indicated that the proposed method effectively identifies the wood grade used in Chinese zither panels.
Download PDF
Full Article
Neural Network for Classification of Chinese Zither Panel Wood via Near-infrared Spectroscopy
Yinglai Huang,a Shiyu Meng,a Sung-Wook Hwang,b Kayoko Kobayashi,b and Junji Sugiyama b,c,*
The wood grade used for Chinese zither panels is primarily determined through an artificial experience method, and the number of related practitioners is decreasing annually. In this study, a method using an improved BP neural network is proposed to assess the wood grade for Chinese zither panels. Abnormal spectral samples were first removed based on the Mahalanobis distance method. Normalization and Savitzky Golay second derivatization were applied to the remaining data set. According to the spectral peak, the spectral data were divided into three bands, which were applied to the model proposed in this paper, and the most critical spectral region for judging the wood grade of Chinese zither panels was obtained. Through principal component analysis, the appropriate feature variables were selected and applied to the experimental model for an analysis to reduce the calculated amount in the experiment. When the number of principal components was 6, the classification accuracy of unknown samples was 96.7%. Compared with the PLS model, the proposed model is more robust and accurate and has fewer losses. The experimental results indicated that the proposed method effectively identifies the wood grade used in Chinese zither panels.
Keywords: Near infrared spectroscopy; Improved neural network; Chinese zither panels; Mahalanobis distance
Contact information: a: Northeast Forestry University, College of Information and Computer Engineering, Harbin, 150040, China; b: Kyoto University, Research Institute for Sustainable Humanosphere, Kyoto, 606-8501, Japan; c: Nanjing Forestry University, College of Materials and Engineering, Nanjing, 210037, China; *Corresponding author: sugiyama.junji.6m@kyoto-u.ac.jp
INTRODUCTION
The Chinese zither is one of the most unique and important national musical instruments in China, and it is deeply loved for its high-quality sound. At present, the Chinese zither used in performances is uniform in shape and structure. It is 163 cm long and has a total of 21 strings (Fu 2016). It vibrates when plucking the strings, and the vibrations spread to the panel through bridges, producing a beautiful melody. Paulownia wood, known for its low density, straight grain, and good dimensional stability, is widely used in the production of Chinese zither panels, although its grading has been conducted empirically.
Currently, relevant staff members with a rich amount of experience judge the color, luster, texture, and shackles of the wood according to the QB/T 1207.3-2011 industry standard (2011), and they have conducted a large number of analyses to obtain the grade of the wood used for Chinese zither panels. However, the number of experienced practitioners is declining each year, and the experience method applied is being subject to subjective judgments, which cannot meet the needs of the vast instrument market. Therefore, it is of particular importance to propose a scientific, time-saving, and accurate method for judging the wood used for Chinese zither panels.
Near infrared spectroscopy (NIR) is characterized by fast, simple, and non-destructive measurements (Pasquini 2018). The absorption bands in the near-infrared region are mainly caused by low-energy electron transitions as well as frequency doubling and the combined frequency absorption of hydrogen-containing radical stretching vibrations (Leblon et al. 2013; Horikawa et al. 2015). NIR spectroscopy has many advantages including multiple spectroscopic methods, many types of measuring accessories available, and an easy operation (Ren et al. 2013). It has been widely used in many fields such as agricultural production and the food industry (Cortés et al. 2017), and it has a wide range of applications in wood science (Braga et al. 2011; Yu et al. 2018). For example, NIR was used to study Tsuga heterophylla (Watanabe et al. 2010) and Abies lasiocarpa (Watanabe et al. 2012), and successfully used to carry out detection of wet-pockets. In order to classify green hem-fir timber more quickly and accurately, Watanabe et al. (2011) established a model with a high classification accuracy using NIR and PLS, and these findings clearly demonstrate that NIR spectroscopy has potential to estimate average moisture of green timber indirectly. He et al. (2013) studied the feasibility of using NIR to rapidly determine the lignin and extract content of both softwood and hardwood. Lazarescu et al. (2016) applied BP neural network and partial least square models combined with NIR to easily separate fir and hemlock, and the classification accuracy was relatively high. Hwang et al. (2016) extended NIR to classify and identify pine trees traditionally used in Korean architecture. Sohi et al. (2017) successfully applied NIR and multivariate statistical modeling to separate green chain sub-alpine fir lumber from a spruce-pine-fir mix. Tham et al. (2018) applied capacitance and NIR to predict the solid wood density and water content. Thus, there are many NIR applications for the assessment of wood species and their properties.
Given this background, the grading of paulownia wood for Chinese zither panels was investigated because the NIR can be used to characterize the structure as a reflection of the variation in the main wood components. In this paper, an improved BP neural network is proposed to judge the grade of the wood in Chinese zither panels. The improved BP model uses a chaotic sequence generated through logistic mapping to initialize the weight, setting the learning rate through an exponential decay and using the Softmax classification strategy.
EXPERIMENTAL
Wood Materials
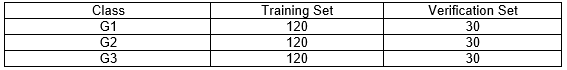
The Paulownia wood used in this experiment was provided by Qionghua National Musical Instrument Company Limited (China). It was treated to meet the requirements for the production of Chinese zither panels. One hundred and fifty pieces of advanced product (G1), intermediate product (G2), and common product (G3) were selected. That is, a total of 450 samples were used for the training and verification of experiments. The training set and the verification set samples were selected according to the principles that the ratio of the training set and the verification set was 4:1 and the random number seed mechanism was used. The specific settings of the training and verification sets are shown in Table 1.
Table 1. Dataset Division
NIR Acquisition
The NIR spectra in reflection mode were obtained using a PerkinElmer Spectrum 100 N system (Waltham, MA, USA), with a spectral resolution of 16 cm-1 and spectral interval of 10000 to 4000 cm-1.
Software
The software used in the analysis of this study was Python 3.6, and the changes in accuracy and loss values were observed through the TensorFlow environment.
Spectral Pretreatment
Because the data within the 10000 to 7000 cm-1 area was noisy, the spectral region used for the experimental analysis was 7000 to 4000 cm-1. After a comprehensive consideration, the combination of normalization and Savitzky Golay second derivatization (41 points, 7-order function) was applied as the spectral pretreatment (Lei and Pan 2014).
Principal Component Analysis
When applying NIR spectroscopy data for analysis, the calculations of multi-dimensional spectral data are extremely complicated. Using a data compression operation, principal component analysis (PCA) was applied in this experiment. This multivariate analysis technique is widely used in science and engineering. The analysis rotates a dataset to convert raw data variables into new uncorrelated variables. The new variables are called the principal components, which are a linear combination of the original data variables. The variables involved in the experimental calculations are selected based on the degree of interpretation of the original data using the new variables. PCA can be applied to maintain the original spectrum information while reducing dimensionality.
Elimination of Outliers
When collecting the spectral samples of the plates, the presence of abnormal samples is usually caused by external factors such as manual error. The outliers caused by such samples have a significant influence on the establishment of the model and the experimental results, and it is therefore necessary to detect abnormal samples and eliminate them before conducting an experimental numerical analysis. The detection of such outliers in this particular study is based on the Mahalanobis distance method. The specific formula for this is shown in Eq. 1, Where  is the sample point vector,
  is the experimental sample mean vector, and the covariance matrix is
  .
.
 (1)
(1)
Because the dimensions of the entire spectral region are too large, principal component analysis is applied to the spectral data. The first three principal component features are then selected as the input of the Mahalanobis distance calculation. A scatter plot of these three principal component variables is shown in Fig. 1. The outliers are marked in red, and five abnormal sample data were successfully excluded (one, one, three from G1, G2, and G3 classes, respectively). Thus, the final training dataset used for the experiment consisted of 355 spectra.

Fig. 1. Anomaly samples detection
Model
This paper improves the traditional BP neural network model (Zhang et al. 2012) as follows. The selection of the initial weight has a considerable influence on the model, and the appropriate initial weight accelerates its convergence speed. In this paper, the chaotic sequence generated by a one-dimensional Logistic sequence was used to initialize and improve the weight of the BP model. The mapping equation is shown in Eq. 2. When the system parameter  is greater or equal to 3.56, the sequence enters a chaotic state, and thus
  and
and  were chosen in this study.
 (2)
(2)
As the transfer function between the input and the hidden layers of the model, a ReLU function was applied. The learning rate was set to the exponentially decaying learning rate, which achieves a large learning speed at the beginning of the iteration and has a finer learning precision during the later iterations. The initial value of the learning rate was set to 0.01, and the attenuation index was set to 0.96. Because Gradient Descent method is slow to train and easily falls into the local optimal solution, the model selects the Adam algorithm, which increases the robustness of the model.
This model redefines the loss function of the experimental model. That is, a regular item is added after the objective function or cost function. The specific formula for this is shown in Eq. 3, where  is the model weight,
  is the coefficient of the regular item, cross_entropy is the cross entropy function of the model.
 (3)
(3)
The model is classified by the Softmax function, and the G1, G2, and G3 products are [1 0 0], [0 1 0], and [0 0 1], respectively. The batch data method was used to train the neural network with a batch size of 40, and the total number of iterations was 30.
RESULTS AND DISCUSSION
Spectral Analysis and Assignment
The raw spectral data are visualized in Fig. 2. The trend of the spectra curves is in the same direction, and the bands of the near infrared spectrum are wide. Therefore, the spectrum could not be accurately distinguished by the naked eye alone.

Fig. 2. Raw spectral data (7000 to 4000 cm-1)
The main components of wood are cellulose, lignin, and hemicellulose (Schwanninger et al. 2011). These compounds are mainly composed of O-H, C-H, and CH2 groups. The absorption of organic matter in the NIR range is mainly the overtone absorption of hydrogen-containing groups. The wavenumber region of 7000 to 6000 cm-1 is mainly controlled by the first overtone of the O-H bond stretching vibration generated by carbohydrates (Poletto et al. 2012). The wavenumber region of 6000 to 5000 cm-1 is dominated by the first overtone of aromatic C-H stretching vibrations and O-H combination bands. The absorption peak at 5196 cm-1 is caused by the O-H bond stretching and deformation vibration (Tsuchikawa 2007), and the bands at 5980 cm-1 are aromatic groups of lignin. The spectral band of 4968 to 4000 cm-1 is more difficult to distribute, and the 4402 cm-1 absorption peak is caused by the C-H bond stretching vibration and deformation vibration, corresponding to cellulose and hemicellulose.
The average spectrum of each grade of wood for Chinese zither panels was calculated, and the curve is shown in Fig. 3. Within the 6998 to 6574, 5060 to 4854, and 4354 to 4102 cm-1 spectral bands, the absorbance of the G2 class is noticeably lower than that of the G1 and G3 classes. Within the 6002 to 5608 cm-1 spectral band, the absorbance of the G1 class is noticeably lower than that of the G2 and G3 classes, and these bands may be the key region for judging the wood grade used in Chinese zither panels.

Fig. 3. Average spectrum of different grades of wood samples
Spectral Denoising
Normalization and Savitzky Golay second derivative operations were applied to the spectral data, which is shown in Fig. 4. Although the signal was inverted, the peaks of the second derivative spectrum remained in the same location as the peaks of the raw spectral data, which magnified the difference between different grades of panel wood. Therefore, the second derivative spectrum clearly showed the change in the original spectrum. The spectral data exhibited clear absorption peaks at approximately 5294, 4960, 4360, and 4158 cm-1, respectively. Shoulder peaks appeared at 5764, 5240, and 4818 cm-1.

Fig. 4. Spectral data preprocessing
Dimensionality Reduction to Extract Spectral Information
This study explored the spectral bands characterizing the grade of wood used in Chinese zither panels. According to the characteristics of the absorption and shoulder peaks of the spectral data, the three bands of 4818 to 4000, 5764 to 4818, and 7000 to 5764 cm-1 were considered. For convenience, A represents 7000 to 5764 cm-1, B indicates 5764 to 4818 cm-1, and C represents 4818 to 4000 cm-1. Because the spectral data dimensions were too large, the calculation was also large, and thus PCA was conducted on the three regions. The ratio of information in one principal component to the total information in the original variables is called the percentage of the total cumulative variance of the principal component interpretation, and the effect of PCA on extracting the spectral information is shown in Fig. 5.

Fig. 5. Cumulative interpretation degree of principal components
When the cumulative degree of interpretation reaches 80% or more, the extracted data can be used to represent all the spectral information. The number of principal components selected by A, B, C, and all experimental data were 16, 2, 6, and 6, respectively.
Judging Feature Spectral Blocks
The three spectral blocks were applied to the proposed improved BP neural network model according to the number of extracted principal components. The classification accuracy of the test set was used as a measurement index to determine the characteristic spectral range of the wood for the Chinese zither panel of different grades. The specific changes are shown in Table 2.
Table 2. Spectral Band Performance

As shown in Table 2, the accuracy of the experiment using data C was 90.5%. Experiments with the C-band data showed the highest accuracy. The amount of data involved in the calculation was relatively small, i.e., the spectral data of the 4000 to 4818 cm-1 range, which is the most critical spectral region for judging the wood grade of Chinese zither panels because it contains almost all of the key feature information. The B and C bands are sub-critical spectral bands. However, all spectral data should still be used in the experiment. The correct classification accuracy of all the spectral data of the Chinese zither panel is the highest, and the entire spectral band contains the most comprehensive feature information.

Fig. 6. The ability of the proposed model to learn spectral information. (a) Before model extraction, (b) after model extraction
Model Evaluation
To characterize the ability of the proposed model to learn the key features of spectral data, t-SNE (Bunte et al. 2012) was used to visually compare the preprocessed spectral data with the variables after neural network extraction. The first two dimensions of the information features were visualized, and the ability of the model to extract information is shown in Fig. 6. The data that was not extracted by the model had a disordered distribution and was difficult to distinguish. However, most of the data that was extracted by the proposed model was clearly concentrated in the respective regions. This result proved that the proposed model structure designed in this study properly learned the key information of different grades of wood for Chinese zither panels.
To evaluate the performance of the proposed model, it was compared with the partial least squares discriminant analysis (PLS-DA) model, which is a method for multi-dependent variables and multiple independent variables, and is often applied to NIR. In the PLS-DA model, the grade variable values of the premium (G1), intermediate (G2), and popular products (G3) were set to 0, 1, and 2, respectively, and the sample level was judged using ± 0.5 of the sample prediction value as the boundary point. After an experimental analysis, among the 90 prediction set samples, the accuracy of the PLS-DA model was 91.1%. The performances of the PLS-DA model and the improved BP model are shown in Table 3. The classification results were obtained by averaging the results from 3 replicate experiments. The spectral band obtained in this study is the key band for distinguishing different grades of panel wood. The proposed method can therefore be used to effectively judge the grade of wood for Chinese zither panels.
Table 3. Model Evaluation

Applying the model proposed in this paper to the test dataset, the corresponding changes in accuracy and loss values are shown in Fig. 7. The loss function is the core part of the empirical risk function and is an important part of the structural risk function. A smaller loss function results in better robustness of the model. Figure 7 shows that the loss value of the test set is close to 0.66. In conclusion, the model proposed in this paper is robust and has a high accuracy for discriminating the wood grade for Chinese zither panels.

Fig. 7. Model performance. (a) Accuracy, (b) loss
CONCLUSIONS
- The Mahalanobis distance method was applied for eliminating outlier samples. New feature variables calculated through the denoising method and PCA applied to the near infrared spectral data of Paulownia wood were used in an improved BP neural network model.
- The spectral range of 4000 to 4818 cm-1 is the spectral characteristic band distinguishing the wood grade of the Chinese zither panels.
- Compared with a traditional artificial experience method and the PLS method, the improved BP neural network model is time-saving, with a higher recognition rate of up to 96.7%, and a stronger robustness.
- This research indicates that the application of near infrared spectroscopy and neural network for a fast grade determination of wood used in Chinese zither panels is feasible, and this study provides a new method for quickly identifying the grade of Chinese zither panels.
ACKNOWLEDGMENTS
The authors are grateful for funds from the National Natural Science Foundation of China (31670717), Natural Science Foundation of Heilongjiang Province (C2016011), and Fundamental Research Funds for the Central University (2572018BH03).
REFERENCES CITED
Braga, J. W., B., Pastore, T. C. M., Coradin, V. T. R. C., Camargos, J. A. A., and da Silva, A. R. (2011). “The use of near infrared spectroscopy to identify solid wood specimens of Swietenia macrophylla (Cites Appendix II),” IAWA Journal 32(2), 285-296. DOI: 10.1163/22941932-90000058
Bunte, K., Haase, S., Biehl, M., and Villmann, T. (2012). “Stochastic neighbor embedding (SNE) for dimension reduction and visualization using arbitrary divergences,” Neurocomputing 90, 23-45. DOI: 10.1016/j.neucom.2012.02.034
Cortés, V., Rodríguez, A., Blasco, J., Rey, B., Besada, C., Cubero, S., Salvador, A., Talens, P., and Aleixos, N. (2017). ”Prediction of the level of astringency in persimmon using visible and near-infrared spectroscopy,” Journal of Food Engineering 204, 27-37. DOI: 10.1016/j.jfoodeng.2017.02.017
Fu, M.-J. (2016). “On the sound quality and decorative aesthetics of Guzheng from the perspective of production,” Entertainment Technology 5, 11-13.
He, W., and Hu, H. (2013). “Rapid prediction of different wood species extractives and lignin content using near infrared spectroscopy,” Journal of Wood Chemistry and Technology 33(1), 52-64. DOI: 10.1080/02773813.2012.731463
Horikawa, Y., Mizuno-Tazuru, S., and Sugiyama, J. (2015). “Near-infrared spectroscopy as a potential method for identification of anatomically similar Japanese diploxylons,” Journal of Wood Science 61, 251-261. DOI: 10.1007/s10086-015-1462-2
Hwang, S.-W., Horikawa, Y., Lee, W.-H., and Sugiyama, J. (2016). “Identification of Pinus species related to historic architecture in Korea using NIR chemometric approaches,” Journal of Wood Science 62(2), 156-167. DOI: 10.1007/s10086-016-1540-0
Lazarescu, C. Hart, F., Pirouz, Z., Panagiotidis K., Mansfield, S., Barrett,
J. D., and Avramidis, S. (2016). “Wood species identification by near-infrared spectroscopy,” International Wood Products Journal 8(1), 32-35. DOI: 10.1080/20426445.2016.1242270
Leblon, B., Adedipe, O., Hans, G., Haddadi, A., Tsuchikawa, S., Burger, J., Stirling, R., Pirouz, Z., Groves, K., Nader, J., and LaRocque, A. (2013). “A review of near-infrared spectroscopy for monitoring moisture content and density of solid wood,” The Forestry Chronicle 89(5), 595-606.
Lei, L.-P., and Pan, C.-D. (2014). “Curve smoothing and denoising based on Savitzky-Golay algorithm,” Computer and Information Technology 22(05), 30-31.
Pasquini, C. (2018). “Near infrared spectroscopy: A mature analytical technique with new perspectives–A review,” Analytica Chimica Acta 1026,1-154. DOI: 10.1016/j.aca.2018.04.004
Poletto, M., Zattera, A. J., and Santana, R. M. C. (2012). “Structural differences between wood species: Evidence from chemical composition, FTIR spectroscopy, and thermogravimetric analysis,” Journal of Applied Polymer Science 126(S1), 337-344. DOI: 10.1002/app.36991
QB/T 1207.3-2011 (2011). “Zheng,” Ministry of Industry and Information Technology of the People’s Republic of China, Bejing, China.
Ren, G., Wang, S. Ning, J., Xu, R., Wang, Y., Xing, Z., Wan, J., and Zhang, Z. (2013). “Quantitative analysis and geographical traceability of black tea using Fourier transform near-infrared spectroscopy (FNIRS),” Food Research International 53(2), 822-826. DOI: 10.1016/j.foodres.2012.10.032
Schwanninger, M., Rodrigues, J. C., and Fackler, K. (2011). “A review of band assignments in near infrared spectra of wood and wood components,” Journal of Near Infrared Spectroscopy 19, 287-308. DOI: 10.1255/jnirs.955
Sohi, A., Avramidis S., and Mansfield S. (2017). “Near-infrared spectroscopic separation of green chain sub-alpine fir lumber from a spruce-pine-fir mix,” BioResources 12(2), 3720-3727.
Tham, V. T., H., Inagaki, T., and Tsuchikawa, S. (2018). ”A novel combined application of capacitive method and near-infrared spectroscopy for predicting the density and moisture content of solid wood,” Wood Sci. Technol. 52(1), 115-129. DOI: 10.1007/s00226-017-0974-x
Tsuchikawa, S. (2007). “A review of recent near infrared research for wood and paper,” Applied Spectroscopy Reviews 42(1), 43-71. DOI: 10.1080/05704920601036707
Watanabe, K., Hart, F., Mansfield, S.D., and Avramidis, S. (2010). “Detection of wet-pockets on the surface of Tsuga heterophylla (Raf.) Sarg. by near infrared (NIR) spectroscopy,” Holzforschung 64, 55-60. DOI 10.1515/HF.2010.014
Watanabe, K., Mansfield, S. D., and Avramidis, S. (2011). “Application of near-infrared spectroscopy for moisture-based sorting of green hem-fir timber,” Journal of Wood Science 57, 288-294. DOI:10.1007/s10086-011-1181-2
Watanabe, K., Mansfield, S. and S. Avramidis (2012). “Wet-pocket classification in Abies lasiocarpa using visible and near infrared (Vis-NIR) spectroscopy,” European Journal of Wood and Wood Products 70(1-3), 61-67.
Yu, H. Liang, H., Lin, X., and Zhang, Y. (2018). “Nondestructive determination of the modulus of elasticity of Fraxinus mandschurica using near-infrared spectroscopy,” Optical Engineering 57(4), 046103. DOI: 10.1117/1.OE.57.4.046103
Zhang, Y. Q., Qu, W., Chen, J. W., Liu, J. R., and Guo, D. S. (2012). “A multi-input Sigmoid excitation function neural network weight and structure determination method,” Application Research of Computers 29(11), 4113-4116+4151.
Article submitted: March 5, 2019; Peer review completed: June 2, 2019; Revised version received: November 4, 2019; Accepted: November 5, 2019; Published: November 11, 2019.
DOI: 10.15376/biores.15.1.130-141