
Abstract
Establishing an appropriate NOX production and decomposition model is of practical significance to the grate firing of biomass fuel. This study used the CHEMKIN software package to simulate the combustion process of biomass pyrolysis and char combustion. Through rate of production (ROP) analysis and simplification based on GRI-Mech3.0, the 15-step reaction mechanism of volatile-N converting into NOX and the 12-step reaction mechanism of char-N converting into NOX were specified. It was found that in the NOX generated from the fuel, N was mainly in the form of NO and N2O. HCN and NH3 were the important intermediate products. NH3 was mainly converted into NO and some converted into N2O, while HCN mainly consumed NO and produced N2O. According to the transfer characteristics of the biomass fuel nitrogen, the NOX production and decomposition model of the biomass fuel nitrogen in grate furnace firing was established. A simulation computation on the NOX production was implemented for an actual furnace. The established model was confirmed reliable through the comparison of field test data and simulation results.
Download PDF
Full Article
NOx Emission Model for the Grate Firing of Biomass Fuel
Bo Lou,a Yi Xiong,a,* Maodong Li,b Jinfei Ni,b Xiaocong Wang,b and Kuo Ma b
Establishing an appropriate NOX production and decomposition model is of practical significance to the grate firing of biomass fuel. This study used the CHEMKIN software package to simulate the combustion process of biomass pyrolysis and char combustion. Through rate of production (ROP) analysis and simplification based on GRI-Mech3.0, the 15-step reaction mechanism of volatile-N converting into NOX and the 12-step reaction mechanism of char-N converting into NOX were specified. It was found that in the NOX generated from the fuel, N was mainly in the form of NO and N2O. HCN and NH3 were the important intermediate products. NH3 was mainly converted into NO and some converted into N2O, while HCN mainly consumed NO and produced N2O. According to the transfer characteristics of the biomass fuel nitrogen, the NOX production and decomposition model of the biomass fuel nitrogen in grate furnace firing was established. A simulation computation on the NOX production was implemented for an actual furnace. The established model was confirmed reliable through the comparison of field test data and simulation results.
Keywords: CHEMKIN; Biomass; Fuel nitrogen NOx; Reaction mechanism; Simulation calculation
Contact information: a: School of Electric Power, South China University of Technology, Guangzhou, 510641, P. R. China; b: Guangzhou Special Pressure Equipment Inspection and Research Institute, Guangzhou, 510633, P. R. China; *Corresponding author: 294056138@qq.com
INTRODUCTION
With the large-scale application of biomass fuel throughout the world, especially in China, the amount of NOx produced from biomass combustion has become a noticeable problem (Tian et al. 2002). Many studies have reported on the generation mechanism of NOx (Hämäläinen et al. 1994; Hansson et al. 2004; de Jong et al. 2007; Zhou et al. 2013). Due to the complicated production and decomposition mechanism of NOx, most of these studies found discharge paths of nitrogen in biomass and contributions of volatile nitrogen and char nitrogen in NOx production. On this basis, several NOx production and decomposition models for coal combustion was established (Beerling et al. 1995; Chen et al. 2001) by using a chemical reaction kinetic model; however, there have been few reports of the modeling of fuel nitrogen in coal transferring into NOx (Wu et al. 2013), and even fewer models concerning NOx emission from biomass combustion are available. Through experiment, Widmann et al. (2004) reported that NH3 and HCN were precursors of nitrogen transferring into NOx in biomass fuel, which were used to calculate the empirical model of biomass combustion on a fixed bed. The calculated results from the model were then used as the boundary condition and combined with a NOx postprocessor for follow-up calculation. This NOx postprocessor was performed with the Eddy Dissipation Concept in combination with a detailed reaction mechanism with 50 species as well as 253 elementary reactions (Widmann et al. 2004); however, calculating the flow conservation equation for such a detailed reaction mechanism was a time-consuming task. Zhou et al. (2006) made mathematical modeling and experimental verification of NO production from biomass combustion on a fixed bed. The established model included an evaporation sub-model, pyrolysis sub-model, combustion sub-model of volatile matter and char, as well as a nitrogen transfer sub-model. NO, NH3, HCN, and HNCO were assumed as the nitrogenous components precipitated from the volatile matters. Twenty chemical reactions were included, of which 12 belonged to the fuel nitrogen reaction network. The char nitrogen transferred into NO directly during char combustion. This model didn’t give full consideration for the effect of intermediate elementary reactions on NOx production.
The present study made a detailed simulation on the fuel nitrogen transfer of biomass pyrolysis reaction and char combustion by using a CHEMKIN (PRO 4.5) software package. GRI-Mech3.0 was used as the gas-phase dynamic model, including 53 substances and 325 elementary reactions. Among them, 106 elementary reactions involved nitrogenous substances and could describe the NOx production process completely. Next, the transfer paths of fuel nitrogen as well as the main intermediate reactions of HCN and NH3 transferring into NOx were disclosed through rate of production (ROP) reaction rate analysis, concluding the simplified reaction mechanism of fuel nitrogen. Subsequently, the production and decomposition model of NO and N2O were established by combining the biomass combustion model and the heterogeneous reaction of NOx. In contrast to previous models, which converts char N directly into NOx, char N also could be precipitated as HCN and NH3 in this model. Proportions of HCN and NH3 were adjusted to calculate the reaction mechanism. Moreover, NO reduction of alkyl and char in the volatile components were taken into account. This model not only could describe combustion characteristics accurately, but also saved computation time significantly. Finally, the model was verified by NOx production data in an actual furnace in a factory in southern China.
EXPERIMENTAL
Structure of Reciprocating Grate Incinerator
Figure 1 shows the structure of the reciprocating grate steam incinerator in a factory in southern China used in this study. The rated evaporation was 2 t/h, and the saturated steam temperature was 194 °C. The combustion region size was 3.498 m (L) x 1.276 m (W) x 0.839 m (H). The grate was 2.7 m (L) x 1.0 m (W) (Lou et al. 2014). Air was blown into the incinerator from the bottom, while the hot flue gas flowed onto the heated surface from the space between the arch and the incinerator wall.
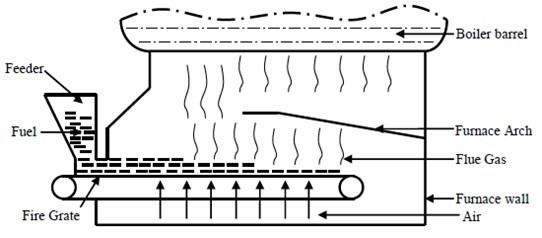
Fig. 1. Structure of the incinerator
Materials
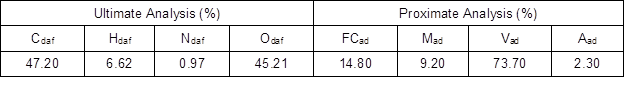
The fuel used in the incinerator was biomass briquette, which had been compressed from typical biomass available in southern China. The main components of the biomass included sawdust and sugarcane bagasse, with bagasse being the main component. Table 1 shows the ultimate analysis and proximate analysis.
Table 1. Ultimate and Proximate Analysis of Biomass Fuel
Components of the biomass pyrolysis gas
The components of the pyrolysis gas were calculated by using the volatile matter combustion model presented by David Merrick (Merrick 1983a, b). Hydrocarbons with a higher carbon number than ethane were processed as “equivalent ethane substances.” During the calculation, it was assumed that the C2 hydrocarbons were composed of C2H4 and C2H6. Nitrogenous substances were composed of HCN and NH3. In order to better adapt to the volatile pyrolysis properties, we had adjusted the calculation parameters, for example, the mass fraction of oxygen in the volatile products CO or CO2 to total oxygen content in the biomass. The David Merrick model established equations on the basis of elemental balance. Its matrix is expressed as,
![]()
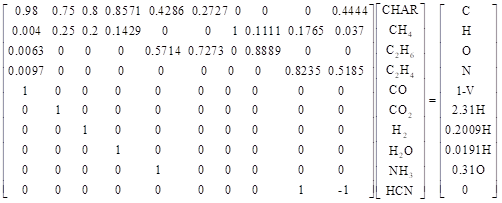
where Am is the coefficient matrix of the mode; m is the mass fraction matrix of the pyrolysis products; and b is the vector constant matrix. In linear equations, the first four equations are the elemental balance of C, H, O, and N. The fifth equation is the mass fraction of residual char. The 6th through 9th equations are used to define the yields of CH4, C2H6, C2H4, and CO in the volatile components. The last equation adjusts the mass ratio of HCN and NH3 according to fuel changes or temperature changes.
Fuel type, temperature, and heating rate are the main influencing factors of the distribution of N emitted from the biomass pyrolysis. During pyrolysis, the production rate of volatile N increases with rise in temperature, while the production rate of char N decreases (Leppalahti 1995; Glarborg et al. 2003; Zhou et al. 2006; Abelha et al. 2007). Zhou et al. (2006) reported about a 25% production rate of char N under a 900 to 1200 K straw pyrolysis temperature. Glarborg et al. (2003) pointed out that when the pyrolysis temperature of straw and ligniform biomass reached 850 to 900 K, about 80% of the nitrogen precipitated as a volatile matter. Tian et al. (2005) studied quick pyrolysis of bagasse and found that the cumulative yield mass ratio of HCN and NH3 in a fixed bed reactor under 600 °C was about 0.75. Hansson et al. (2004) made a quick pyrolysis on leaves and reported 0.8 HCN/NH3 at 900 °C and 1.2 HCN/NH3 at 1000 °C. During the quick pyrolysis of bagasse, Tan et al. (2000) determined that the HCN production rate was 53% and the NH3 production rate was 12.5% under 800 °C. Many studies (Hansson et al. 2003; Becidan 2007; Tian et al. 2007) have demonstrated that the production rate of HCN and HCN/NH3 ratio increased with increase in temperature.
Fuel type has an important effect on the migration of N during pyrolysis. Glarborg et al. (2003) deemed that with the increasing of O/N in fuel, HCN/NH3 would decrease. Aho et al. (1993) also discovered from the pyrolysis test of biomass fuel and coal that HCN/NH3 decreased with the increase of O/N in fuel; however, Hansson et al. (2004) declared that there is no evident relationship between HCN/ NH3 and O/N in fuel.
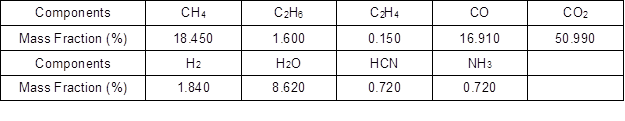
The HCN/NH3 ratio information gained by Stubenberge et al. (2008), the production rate of HCN and NH3 calculated by Tan et al. (2000), and the relationship between HCN/NH3 and temperature reported by Hansson et al. (2004) were combined with temperature changes in an actual furnace. It was determined that the distribution ratio of N in volatile matters and char were equal to the proximate analyzed mass fraction ratio of volatile matters and char; additionally, the HCN/NH3 mass ratio in the pyrolysis gas was 1. Table 2 shows the calculated mass fractions of the components in the biomass pyrolysis gas.
Table 2. Composition of Pyrolysis Gas
Methods
CHEMKIN simulation
In this study, the transfer paths of fuel nitrogen to NOx were studied with the PSR (Perfectly Stirred Reactor) model of CHEMKIN. The PSR model is a transient or steady-state perfectly stirred reactor, known as a continuously stirred tank reactor (CSTR). In the PSR reactor, the reactants are completely mixed with slow diffusion under the stirring effect of high intensity turbulent, this is similar to the in-bed combustion of gas.
For the CHEMKIN simulation of pyrolysis gas combustion, flows of 10 combustors were applied for model calculation. For furnace type comparison and verification, the excess air coefficient, the mass velocity of pyrolysis, and mass velocity of air were chosen as 1.2, 4.92, and 25.15 g s-1, respectively. The temperature of the simulation object was 1183 K, the temperature of the cooling smoke was 500 K, and the combustor pressure was 1 atm. The rate of production (ROP) of the simulated results was analyzed, getting the rate of production and the rate of decomposition of the products in different elementary reactions. The ROP curve could then be represented intuitively.
For the CHEMKIN simulation of char N combustion, it is believed that after the main volatile matters precipitate, N also can be precipitated as HCN and NH3 during char combustion (Chaiklangmuang et al. 2002). The precipitated gas will mix with surrounding oxidizing agents. Glarborg et al. (2003) found that pyrolysis of bagasse and char were conducive to HCN production; therefore, the HCN/NH3 mass ratio precipitated from char would be larger than that from volatile matters–the value was 1.588 in this simulation. The relative amounts of CO and N-species in the airflow were determined by their relative proportions in the char. Simulation conditions were the same as those for pyrolysis gas combustion.
NOx production and decomposition model
During biomass combustion, the precipitation of fuel nitrogen takes place in two stages. Some of it is burned with the precipitation of volatile matters, while the rest is char N left on the char, which is further oxidized into NO and N2O during char combustion.
First, during the precipitation of volatile matters, protein/amino acid and nitrogen heterocyclic are decomposed upon heating and precipitated with volatile matters (Becidan 2007). The gas-phase nitrogen products are mainly HCN and NH3. The emission rate of N is proportional to the pyrolysis rate of biomass.
According to the De’Soete model (Visona et al. 1996a, b), the HCN and NH3 emission rates of volatile matters can be expressed as (Eqs. 1 and 2),
![]() (1)
(1)
 (2)
(2)
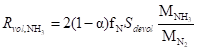
where α is the mass fraction of HCN in the nitrogen component released by the volatile matters; fN is the mass fraction of nitrogen in the biomass; MHCN, MN2, and MNH3 represent the molecular weights (g mol-1) of HCN, N2, and NH3, respectively; and Sdevol is the emission rate of volatile matters (kg m-3 s-1).
Second, during char combustion, since char N is solidified in aryl-nitrogen benzene or azole, it is believed that char N is precipitated as HCN and NH3 during char combustion. The emission rate of N is proportional to the char combustion rate. The HCN and NH3 emission rates can be approximately expressed as (Eqs. 3 and 4),
![]() (3)
(3)
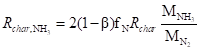 (4)
(4)
where β is the mass fraction of HCN in the nitrogen components released by the char and Rchar is the char combustion rate, kg m-3 s-1.
The dynamic model of the chemical reaction of HCN and NH3 transferring into NO and N2O is the reaction mechanism of N transferring into NOx simulated by CHEMKIN.
Thermal NOx refers to the nitrogen oxides generated from high-temperature oxidization of N2 in air. According to the Zeldovich mechanism (Zevenhoven and Kilpinen 2002), the formation rate of thermal NOx can be expressed as (Eq. 5):
![]() (5)
(5)
NO and N2O will be decomposed upon exposure to reducing gases. In the CHEMKIN simulation, the heterogeneous reduction reaction is not considered. Here, the heterogeneous reduction reaction (Zhou et al. 2006) of char to NO as well as the decomposition reaction of N2O catalyzed by char bed material (Jensen et al. 1995) is considered (Eqs. 6 and 7):
![]() (6)
(6)
![]() (7)
(7)
The reaction rate of reaction 6 can be expressed as (Eq. 8) (Schouten et al. 1995)
![]() (8)
(8)
where ci is the concentration of component i.
The dynamic parameters of reaction 7 can be expressed as (Eq. 9) (Jensen et al. 1995):
![]() (9)
(9)
The initial concentration of OH and H can be calculated from the initial concentration of H2O. The reaction is (Eq. 10):
![]() (10)
(10)
The standard equilibrium constant is (Eq. 11):
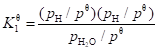 (11)
(11)
The initial concentration of O can be calculated from concentration of O2. The reaction is (Eq. 12):
![]() (12)
(12)
The standard equilibrium constant is (Eq. 13):
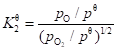 (13)
(13)
In Eqs. 11 and 13, pi is the partial pressure (Pa) of smoke component i and pθ is the standard pressure (Pa). The initial concentrations of OH, H, and O can be calculated with the initial concentration of the nitrogen components being zero.
A MATLAB programming simulation of actual 2t/h biomass grate firing was implemented by using the abovementioned production and decomposition model of NOx (NO and N2O). Due to the complicated reaction, a post-processing method was applied to calculate the production characteristics of NOx. It is believed that oxygen consumption, heat formation, and gas-phase parameters of its chemical reaction do not influence the previous primary combustion reaction.
RESULTS AND DISCUSSION
CHEMKIN Simulation on Pyrolysis Gas Combustion
According to the abovementioned ROP analysis, using the reaction rate of the first combustor as the representative, 10 reactions with the maximum rate of NO production or decomposition in the biomass pyrolysis gas were found in the 106 reactions. The reaction rate parameters are listed in Table 3.
Table 3. Elementary Reaction and Reaction Rate Parameters
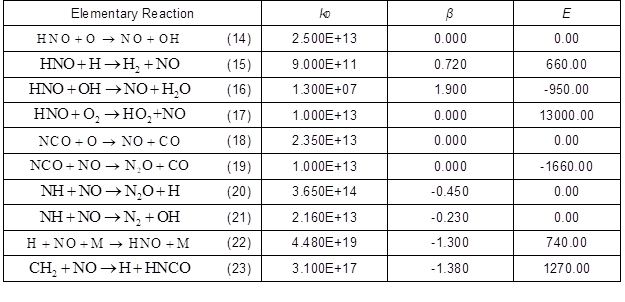
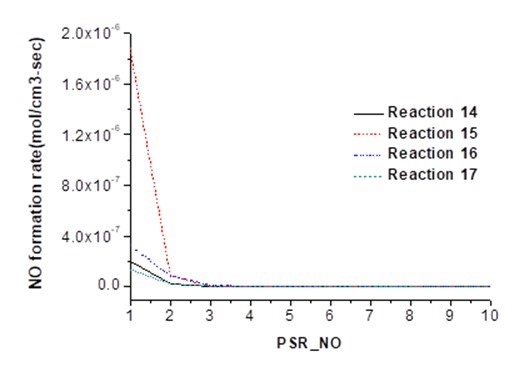
Fig. 2. Influence of reaction 14, 15, 16, and 17 on NO production
The ROP of NO in reactions 14, 15, 16, and 17 are shown in Fig. 2, where the label PSR_NO stands for the number of 10 combustors. The HNO reaction presents the highest net generation rate of NO, which is mainly contributed by reaction 15. This reveals the dominant role of hydrogen in NO production. The GRI mechanism analysis shows that HNO is converted by NH3 in the pyrolysis gas.
Figure 3 shows the ROP of NO in reaction 18 and the decomposition rate of NO in reaction 19. In reaction 18, NCO generates NO under the effect of the active group O, showing a ROP of 1.27×10⁻⁷ mol cm-3 s-1. In reaction 19, NCO decomposes to NO at a decomposition rate of 1.53×10⁻⁷ mol cm-3 s-1, which represents that NCO can decompose NO and generate N2O. The GRI mechanism analysis shows that NCO is generated through HCN conversion in pyrolysis gas. Thus, HCN in volatile matter mainly produces N2O.
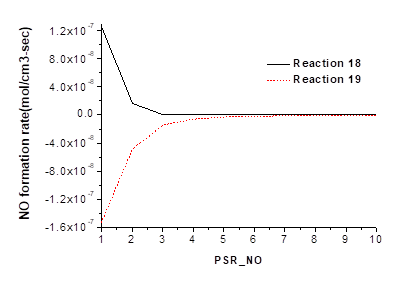
Fig. 3. Influence of reactions 18 and 19 on NO production
The decomposition rate of NO in reactions 20, 21, 22, and 23 are shown in Fig. 4. The decomposition rates of NO by NH in reactions 20 and 21 are 4.59×10⁻⁷ mol cm-3 s-1 and 1.35×10⁻⁷ mol cm-3 s-1, respectively.
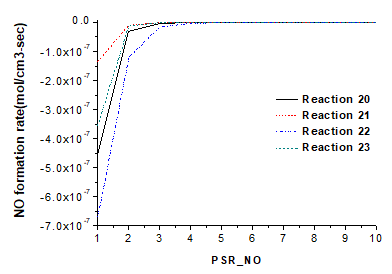
Fig. 4. Influence of reactions 20, 21, 22, and 23 on NO production
These reactions show that NH decomposes NO in two ways. Reaction 20 decomposes NO into N2O. Compared to the ROP of N2O in reaction 19, a significant production effect of N2O was observed in reaction 20. Reaction 21 decomposes NO into N2. The ROP analysis shows that NO decomposition by NH is the reaction with the highest net rate of decomposition. The GRI mechanism analysis shows that NH is produced by NH3 in pyrolysis gas; therefore, NO decomposition by NH3 should be taken into account.
Reactions 22 and 23 show the NO reduction and decomposition by H and CH2. The decomposition rates are 6.69×10⁻⁷ mol cm-3 s-1 and 3.54×10⁻⁷ mol cm-3 s-1, respectively, presenting a prominent decomposition effect. In reaction 22, H restores NO into HNO, and when combined with reaction 15, its NO reduction is weaker than its NO production. Reaction 23 is the NO reduction reaction by CH2. The GRI mechanism analysis reveals that CH2 is mainly produced by hydrocarbons in pyrolysis gas; therefore, hydrocarbons are important for NO decomposition.
Quick NOx analysis
CH free radicals are produced in high-temperature pyrolysis of a hydrocarbon in volatile matter. The CH free radicals react with N2 in air to produce HCN and N, which will be further oxidized into quick NOx. The generation mechanism of quick NOx is similar to that of fuel NOx and is included in the GRI-Mech3.0. The reactions are (Eqs. 24 and 25):
![]() (24)
(24)
![]() (25)
(25)
Figure 5 shows the ROP of the main intermediate HCN of quick NOx for reactions 24 and 25, reporting 1.33×10⁻¹⁰ mol cm-3 s-1 and -1.20×10⁻¹⁶ mol cm-3 s-1, respectively. The oxidation rate of HCN in fuel nitrogen reaches 1.88×10⁻⁶ mol cm-3 s-1. Compared to fuel NOx, the quick NOx yield is very small and can be neglected.
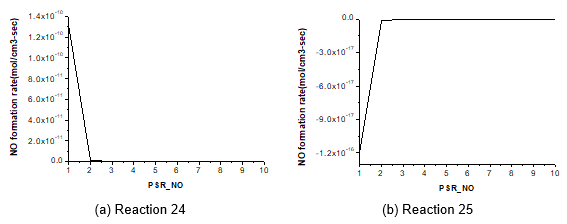
Fig. 5. HCN formation rate
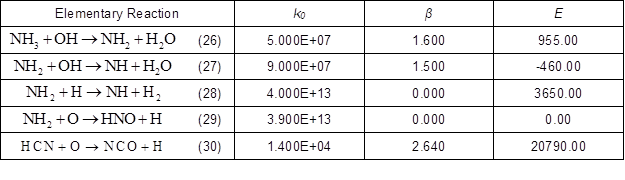
The reaction pathways of HCN and NH3 producing HNO, NH, and NCO as well as their elementary reaction rate parameters were obtained through the ROP analysis and are shown in Table 4.
Table 4. Elementary Reaction and Reaction Rate Parameters
CHEMKIN Simulation on Char N Combustion
According to the ROP analysis, 7 of the 106 reactions had the maximum rate of NO production or decomposition in char N combustion. The reaction rate parameters are listed in Table 5.
Table 5. Elementary Reaction and Reaction Rate Parameters
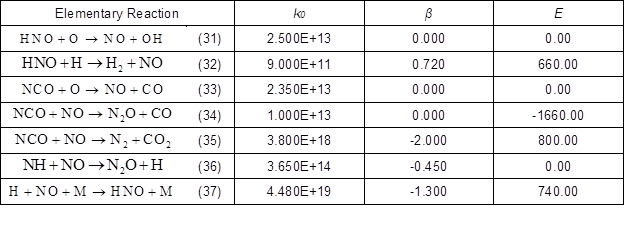
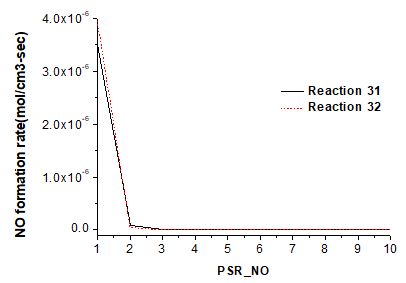
Fig. 6. Influence of reactions 31 and 32 on NO production
Figure 6 shows ROP of NO in reactions 31 and 32. The HNO reaction also presents the highest net ROP of NO. Different from the reaction mechanism of pyrolysis, O group and H group are basically the same in NO production. The GRI mechanism analysis shows that HNO is produced by NH3.
Figure 7 shows the ROP of NO in reaction 33, the decomposition rate of NO in reactions 34 and 35. In reaction 33, NCO produces NO, showing a ROP of 2.11×10⁻⁶ mol cm-3 s-1. In reaction 34, NCO decomposes NO into N2O, showing a decomposition rate of 1.73×10⁻⁶ mol cm-3 s-1. In reaction 35, NCO decomposes NO into N2, presenting a decomposition rate of 1.09×10⁻⁶ mol cm-3 s-1. These results reveal that NCO mainly decompose NO into N2O. According to the GRI mechanism analysis, NCO is transferred from HCN in char N. In other words, HCN mainly produces N2O and N2.
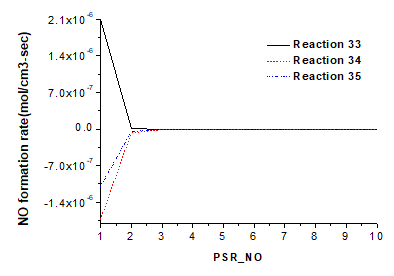
Fig. 7. Influence of reactions 33, 34, and 35 on NO production
Figure 8 shows the decomposition rate of NO in reactions 36 and 37.
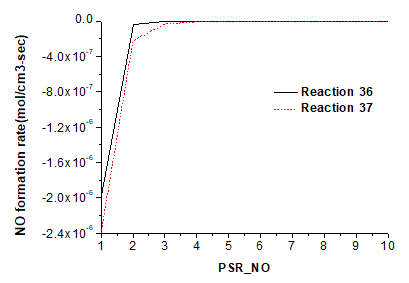
Fig. 8. Influence of reactions 36 and 37 on NO production
Just as with the pyrolysis gas, the char N transfer is also accompanied by prominent NO reduction by NH and H, with reduction rates of 1.98×10⁻⁶ mol cm-3 s-1 and 2.40×10⁻⁶ mol cm-3 s-1, respectively. NH and H reduce NO into N2O and HNO, but the NO reduction of H is weaker than its NO production.
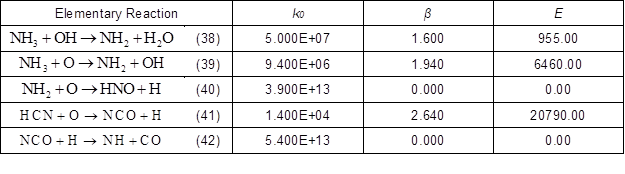
Reaction pathways of HCN and NH3 producing HNO, NH, and NCO as well as their elementary reaction rate parameters were obtained through the ROP analysis and are shown in Table 6.
Table 6. Elementary Reaction and Reaction Rate Parameters
Production Pathway of Fuel NOx in Grate Firing
Based on the ROP analysis results, the transfer path diagram of fuel nitrogen to the fuel NOx is shown in Fig. 9. Fuel nitrogen includes two parts: volatile N and char N. Both are released as HCN and NH3. They are combined as shown in Fig. 9. In volatile N, HCN is oxidized by O into NCO (reaction 30), while some NCO is oxidized by O into NO (reaction 18) and some reduces NO to produce N2O (reaction 19). Most NH3 is oxidized by H, O, OH, and O2 into NO (reactions 14, 15, 16, and 17), whereas a small amount reduces NO to produce N2O and N2 (reactions 20 and 21).
Some produced NO will be reduced by H and CH2 (reactions 22 and 23). HCN in char N is oxidized by O into NCO (reaction 41). Some NCO is oxidized by O into NO (reaction 33) and some reduces NO to produce N2O and N2 (reactions 34 and 35). Most NH3 is oxidized by H and O into NO (reactions 31 and 32), while a small amount is reduced by NO into N2O (reaction 36).
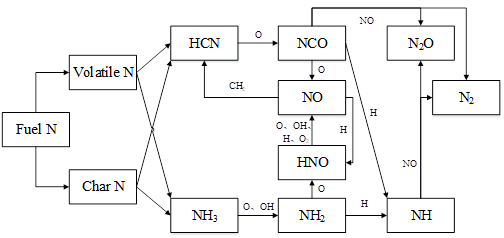
Fig. 9. Transfer path of fuel nitrogen in grate firing
Analysis and Verification of Model Calculation Results
The variation curve of NO concentration on the bed surface against bed length is shown in Fig. 10. From 0.3 m to 0.75 m, the fuel just enters the furnace while the temperature of the combustor is low. As heat is continuously added, the volatile matter is released and the intermediates HCN and NH3 of NO are produced; therefore, NO production increases and the concentration rises. From 0.75 m to 0.82 m, the oxygen concentration decreases quickly due to the combustion of volatile matters and the NO production decreases, which thereby reduces the NO concentration. From 0.82 m to 0.89 m, char combustion increases the gas-phase temperature. With the dramatic emission of volatile N and char N, and oxygen surplus due to the high excess air coefficient, the NO concentration increases sharply again. Next, the volatile matters are burned, thus reducing the NO production in the gas phase and the NO concentration quickly. From 0.9 m to 1.7 m, the NO concentration reduces slowly with the combustion of char.
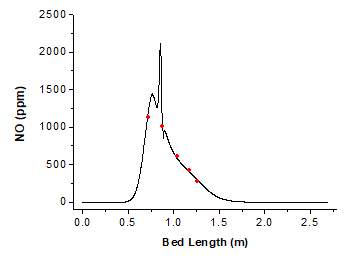
Fig. 10. NO concentration on the bed surface
The variation curve of NOx (NO and N2O) concentration on the bed surface against bed length is shown in Fig. 11.
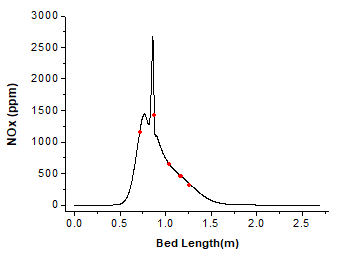
Fig. 11. NOx concentration on the bed surface
Compared with Fig. 10, when the volatile matters begin to release, little N2O is produced until a certain temperature is reached. At the beginning of char combustion, N2O increases significantly. At this moment, the temperature is very high and oxygen concentration is very low, agreeing with the atmosphere of N2O production. N2O/NO concentration is higher during char combustion than that in volatile matters combustion. This coincides with the CHEMKIN simulation results.
To verify the model, the temperature and gas-phase concentration at several points were measured in the actual furnace service environment. The distances from these points to the left furnace wall are 0.720 m, 0.873 m, 1.041 m, 1.169 m, and 1.262 m, respectively. Table 7 shows the simulation data and the experimental data. The red dots in Fig. 10 and Fig. 11 represent the experimental data.
Table 7. Simulation Data and Experimental Data
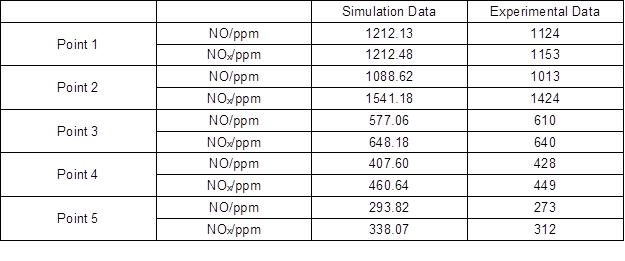
A comparison shows that because of the simplicity of the model, the simulation data differ with the experimental data. However, the errors are within 10%. Overall, the simulation data agree with the experimental data.
CONCLUSIONS
Combined with the CHEMKIN simulation, this study evaluates the formation paths of NOx during grate firing of biomass volatile matters and char through ROP analysis. On this basis, a NOx production and decomposition model in the furnace based on the dynamics of the chemical reaction is established. It also makes a simulation calculation for NOx production in an actual furnace in a factory in southern China. The model is verified through experimental data and draws the following conclusions:
- CHEMKIN simulation results show that in grate firing of biomass fuel, fuel nitrogen is the main source of NOx Quick and thermal NOx can be neglected. NOx mainly includes NO and N2O. Hydrocarbons in the fuel are very important to NO decomposition.
- CHEMKIN simulation results show that in biomass fuel, NH3 and HCN are the main intermediates of NOx NH3 mainly produces NO and some N2O, while HCN mainly produces N2O. N2O/NO ratio produced by char N is higher than that produced by volatile N. N2O mainly concentrates during char combustion.
- Based on GRI-Mech3.0, the 15-step reaction mechanism of volatile N transferring into NOx and the 12-step reaction mechanism of char N transferring into NOx are simplified through ROP analysis. NO and N2O reduction by hydrocarbons and char are taken into account in addition to the reaction mechanism. The calculated results of the established model coincide with the experimental data of an actual grate firing boiler, confirming that the model is reasonable and feasible. The reaction mechanism could describe the characteristics of the N transfer path during grate firing of biomass fuel.
ACKNOWLEDGMENTS
The authors are grateful for the support of the Administration of Quality and Technology Supervision of Guangdong Province (HT13050327), the Key Laboratory of Efficient and Clean Energy Utilization of Guangdong Province (2013A061401005), and the Scientific Research Plan Project of Guangdong Province (2014A020216005).
REFERENCES CITED
Abelha, P., Gulyurtlu I., and Cabrita I. (2007). “Release of nitrogen precursors from coal and biomass residues in a bubbling fluidized bed,” Energy Fuels 22(1), 363-371. DOI: 10.1021/ef700430t
Aho, M. J., Hamalainen J. P., and Tummavuori J. L. (1993). “Importance of solid fuel properties to nitrogen oxide formation through HCN and NH3 in small particle combustion,” Combustion & Flame 95, 22-30. DOI: 10.1016/0010-2180(93)90049-9
Becidan, M. (2007). Experimental Studies on Municipal Solid Waste and Biomass Pyrolysis, Fakultet for Ingeniørvitenskap og Teknologi.
Beerling, E. E., Brem, G., Bramer, E. A., and Valk, M. (1995). “6.3. Modeling N2O/NO formation and reduction during combustion of char,” Coal Science & Technology 22, 291-315. DOI: 10.1016/B978-0-444-81932-1.50014-9
Chaiklangmuang, S., Jones, J. M., Pourkashanian, M., and Williams, A. (2002). “Conversion of volatile-nitrogen and char nitrogen to NO during combustion,” Fuel 81, 2363-2369. DOI: 10.1016/S0016-2361(02)00175-8
Chen, Z., Lin, M., Ignowski, J., Kelly, B., Linjewile, T. M., and Agarwal, P. K. (2001). “Mathematical modeling of fluidized bed combustion. 4: N2O and NOx emissions from the combustion of char,” Fuel 80(9), 1259-1272. DOI: 10.1016/S0016-2361(01)00007-2
de Jong, W., Di Nola, G., Venneker, B. C. H., Spliethoff, H., and Wojtowicz, M.A. (2007). “TG-FTIR pyrolysis of coal and secondary biomass fuels: Determination of pyrolysis kinetic parameters for main species and NOx precursors,” Fuel 86(15), 2367-2376. DOI: 10.1016/j.fuel.2007.01.032
Glarborg, P., Jensen A. D., and Johnsson J. E. (2003). “Fuel nitrogen conversion in solid fuel fired systems,” Progress in Energy & Combustion Science 29(2), 89-113. DOI: 10.1016/S0360-1285(02)00031-X
Hämäläinen, J. P., Aho M. J., and Tummavuori J. L. (1994). “Formation of nitrogen oxides from fuel-N through HCN and NH3: a model-compound study,” Fuel 73(94), 1894-1898. DOI: 10.1016/0016-2361(94)90218-6
Hansson, K., Samuelsson, J., Åmand, L., and Tullin, C. (2003). “The temperature’s influence on the selectivity between HNCO and HCN from pyrolysis of 2,5-diketopiperazine and 2-pyridone,” Fuel 82, 2163-2172. DOI: 10.1016/S0016-2361(03)00206-0
Hansson, K., Samuelsson, J., Tullin, C., and Amand, L. (2004). “Formation of HNCO, HCN, and NH3 from the pyrolysis of bark and nitrogen-containing model compounds,” J. Combustion & Flame 137(3), 265-277. DOI: 10.1016/j.combustflame.2004.01.005
Jensen, A., Johnsson, J. E., Andries, J., Laughlin, K., Read, G., Mayer, M., Baumann, H., and Bonn, B. (1995). “Formation and reduction of NOx in pressurized fluidized bed combustion of coal,” Fuel 74(11), 1555-1569. DOI: 10.1016/0016-2361(95)00155-X
Leppalahti, J. (1995). “Formation of NH3 and HCN in slow-heating-rate inert pyrolysis of peat, coal and bark,” Fuel 74(95), 1363-1368. DOI: 10.1016/0016-2361(95)00091-I
Lou, B., Wu, S., Wang, X., Ma, K., and Li, M. (2014). “Experimentation and simulation of the combustion of biomass briquettes in Southern China,” BioResources 9(4), 5831-5844. DOI: 10.15376/biores.9.4.5831-5844
Merrick, D. (1983a). “Mathematical models of the thermal decomposition of coal: 1. The evolution of volatile matter,” Fuel 62(5), 534-539. DOI: 10.1016/0016-2361(83)90222-3
Merrick, D. (1983b). “Mathematical models of the thermal decomposition of coal: 2. Specific heats and heats of reaction,” Fuel 62(5), 540-546. DOI: 10.1016/0016-2361(83)90223-5
Schouten, J. C., and van den Bleek, C. M. (1995). Atmospheric Fluidized Bed Coal Combustion Research, Development and Application, Valk, M. (ed.), Elsevier Science, Amsterdam, Netherlands, p. 227.
Stubenberger, G., Scharler, R., Zahirovic, S., and Obernberger, I. (2008). “Experimental investigation of nitrogen species release from different solid biomass fuels as a basis for release models,” Fuel, 87(6), 793-806. DOI: 10.1016/j.fuel.2007.05.034
Tan, L. L., and Li, C. Z. (2000). “Formation of NOx and SOx precursors during the pyrolysis of coal and biomass. Part I. Effects of reactor configuration on the determined yields of HCN and NH3 during pyrolysis,” Fuel 79(15), 1883-1889. DOI: 10.1016/S0016-2361(00)00078-8
Tian, F. J., Yu, J., McKenzie, L. J., Hayashi, J., and Li, C. Z. (2007). “Conversion of fuel-N into HCN and NH3 during the pyrolysis and gasification in steam: A comparative study of coal and biomass,” Energy Fuels 21(2), 517-521. DOI: 10.1021/ef060415r
Tian, F. J., Yu, J. L., McKenzie, L. J., Hayashi, J., Chiba, T., and Li, C. Z. (2005). “Formation of NOx precursors during the pyrolysis of coal and biomass. Part VII. Pyrolysis and gasification of cane trash with steam,” Fuel 84(4), 371-376. DOI: 10.1016/j.fuel.2004.09.018
Tian, H. Z., Hao, J. M., Lu, Y. Q., and Zhou, Z. (2002). “Evaluation of SO2 and NOx emissions from biomass fuels utilization in China,” Acta Scientiae Circumstantiae 22(2), 204-208. DOI: 10.13671/j.hjkxxb.2002.02.015
Visona, S. P., and Stanmore, B. R. (1996a). “Modeling NOx release from a single particle Formation of NO from volatile nitrogen,” Combustion and Flame 105, 92-103. DOI: 10.1016/0010-2180(95)00169-7
Visona, S. P., and Stanmore, B. R. (1996b). “Modeling NOx release from a single particle II. Formation of NO from char nitrogen,” Combustion and Flame 106, 207-218. DOI: 10.1016/0010-2180(95)00257-X
Widmann, E., Scharler, R., Stubenberger, G. and Obernberger, I. (2004). “Release of NOx precursors from biomass fuel beds and application for CFD-based NOx postprocessing with detailed chemistry,” Second World Biomass Conference: Biomass for Energy, Industry and Climate Protection; Proceedings of the Conference held in Rome, Italy, 10-14 May 2004. Vol. 1, van Swaaij, W. P. M. (ed.), 1384.
Wu, X. F., Wang, S., Wang, Z. S., Che, F., Wang, Z.S., Shu, X. Li, Q., and Tan, Y. F. (2013). “Experimental simulation of the relative contribution of volatile-N and char N to NOx formation from a low-capacity bituminous coal-fired industrial boiler,” Science China Chemistry 56(4), 541-550. DOI: 10.1007/s11426-012-4771-y
Zevenhoven, R., and Kilpinen, P. (2002). Control of Pollutants in Flue Gases and Fuel Gases, Helsinki University of Technology, Finland.
Zhou, H., Huang, Y., Mo, G. Y., Liao, Z. Y., and Cen, K. F. (2013). “Conversion of fuel-N to N2O and NOx during coal combustion in combustors of different scale,” Chinese Journal of Chemical Engineering 21(9), 999-1006. DOI: 10.1016/S1004-9541(13)60571-6
Zhou, H., Jensen, A. D., Glarborg, P., and Kavaliauskas, A. (2006). “Formation and reduction of nitric oxide in fixed-bed combustion of straw,” Fuel 85(5), 705-716. DOI: 10.1016/j.fuel.2005.08.038
Article submitted: June 16, 2015; Peer review completed: November 1, 2015; Revised version received and accepted: November 8, 2015; Published: November 24, 2015.
DOI: 10.15376/biores.11.1.634-650