
Abstract
The optimization of the process conditions for fire retardant ultra-low density fiberboards (ULDFs) was investigated using response surface methodology (RSM). Three parameters, namely those of Borax-Zinc-Silicate-Aluminum (B-Zn-Si-Al), chlorinated paraffin (CP), and chloride-vinyl chloride emulsions (PVDC) were chosen as variables. The considerably high R2 value (99.98%) indicated the statistical significance of the model. The optimal process conditions for the limiting oxygen index (LOI) were determined by analyzing the response surface’s three-dimensional surface plot and contour plot, and by solving the regression model equation with Design Expert software. The Box-Behnken design (BBD) was used to optimize the process conditions, which showed that the most favorable dosages of B-Zn-Si-Al, CP, and PVDC were 800 mL, 46.47 mL, and 35.64 g, respectively. Under the optimized conditions, the maximum LOI was 48.4.
Download PDF
Full Article
Optimization for Fire Performance of Ultra-low Density Fiberboards Using Response Surface Methodology
Zhenzeng Wu,a,b Daobang Huang, a Wei Wang,a Tingjie Chen,a Ming Lin, a,* Yongqun Xie, a,* Min Niu,a and Xiaodong (Alice) Wang b
The optimization of the process conditions for fire retardant ultra-low density fiberboards (ULDFs) was investigated using response surface methodology (RSM). Three parameters, namely those of Borax-Zinc-Silicate-Aluminum (B-Zn-Si-Al), chlorinated paraffin (CP), and chloride-vinyl chloride emulsions (PVDC) were chosen as variables. The considerably high R2 value (99.98%) indicated the statistical significance of the model. The optimal process conditions for the limiting oxygen index (LOI) were determined by analyzing the response surface’s three-dimensional surface plot and contour plot, and by solving the regression model equation with Design Expert software. The Box-Behnken design (BBD) was used to optimize the process conditions, which showed that the most favorable dosages of B-Zn-Si-Al, CP, and PVDC were 800 mL, 46.47 mL, and 35.64 g, respectively. Under the optimized conditions, the maximum LOI was 48.4.
Keywords: Ultra-low density; Optimization; Fire performance; Response Surface Methodology; Box-Behnken design; Limiting oxygen index
Contact information: a: Department of Material Engineering, Fujian Agriculture and Forestry University, 350002, Fuzhou, Fujian; b: Division of Wood Technology and Engineering, Luleå University of Technology, 93187, Forskargatan 1, Skellefteå, Sweden;
* Corresponding authors: fjxieyq@hotmail.com; fjlm403@163.com
INTRODUCTION
With the critical lack of wood reserves in China, consuming agricultural wastes as raw materials has become progressively more important to the wood industry (Gu and Gao 2002). Agricultural wastes are the most promising fibrous raw materials that will support the sustainable development of the wood composite industries in China (Thomas et al. 2011; Chen et al. 2013, 2014, 2015a,b, 2016b). Ultra-low density fiberboards (ULDFs) that are produced by biodegradable, inexpensive, sustainable, abundant, and environmentally friendly plant fibers have recently attracted increased attention (Xie et al. 2008a,b, 2011). They can be used as architectural heat preservation materials and buffering packaging materials.
However, natural fibers have a low limiting oxygen index (LOI) indicating that they have a high flammability and could be easily ignited in the presence of air. Inorganic flame retardants, such as Al-Si compounds (Niu et al. 2014), Borax-Zinc-Silicate-Aluminum (B-Zn-Si-Al) compounds (Wu et al. 2016b), aluminum trihydroxide (Liang et al. 2013; El Hage et al. 2014), and magnesium hydroxide (Hoffendahl et al. 2015), have been extensively used in fire retardant polymeric materials because they have good thermal-stability, as well as smoke-suppressing and toxic-free additives. Chlorinated paraffin (CP) (Chen et al. 2016a) and poly(vinylidene chloride-vinyl chloride) emulsions (PVDC) (Wu et al. 2016a) are also used in wood fiber products for their low cost, convenience, and excellent compatibility. Nevertheless, very high doses of inorganic retardants must be added in products for them to show excellent fire retardant capabilities. Once the loading level in a product is high, its physical and mechanical properties would decrease. Moreover, halogen retardants could release smoke to the air. Therefore, the need to seek a cheaper, safer, and more efficient compounded fire retardant for ULDFs is significant.
Response surface methodology (RSM) combines the advantages of statistical and mathematical methods. It can evaluate the effects of several independent variables for the optimization of complex multi-variable processes in one experiment system (Box and Draper 1987). The method of RSM has been used widely in many industries because it is practical and derived from experimental methodology (Baş and Boyacı 2007). It can be used to depict the overall effects of the response parameters, including the interactions between independent experimental factors and response parameters (Guo et al. 2011).
In this paper, a compounded fire retardant made with B-Zn-Si-Al compounds, CP, and PVDC is used in ULDFs. There is a synergistic effect between them and CP and PVDC are cheap and efficient, which can reduce the needed dose of fire retardants. The B-Zn-Si-Al compounds can suppress the smoke produced from CP and PVDC. Response surface methodology was used to optimize the processing conditions of ULDFs.
EXPERIMENTAL
Materials
Kraft pulp (KP, spruce-pine-fir; Tembec Inc., Quebec, Canada) was used to fabricate the ULDFs. Sodium silicate, aluminum sulfate, borax, and zinc sulfate were purchased from Tianjin Fuchen Chemical Reagents Factory (Tianjin, China) and were utilized in the preparation of B-Zn-Si-Al compounds. The CP and PVDC were supplied by the Changzhou Fengshuo Chemical Company, Ltd. (Changzhou, China). Sodium dodecylbenzene sulfonate was purchased from the Jiangsu Qingting Washing Products Co., Ltd. (Jiangsu, China).
Methods
Manufacture of ultra-low density fiberboards
The ULDFs were manufactured using the same method described in Xie et al. (2011) with a target bulk density of 50 kg/m3 to 70 kg/m3.
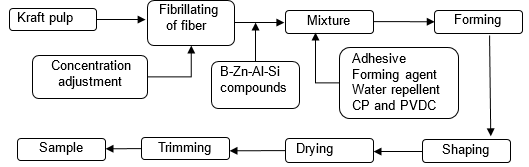
Fig. 1. The preparation of flame-retardant specimens (adapted from Wu et al. (2016b))
Twenty mL of adhesive (25 wt.% polyvinyl alcohol, 25 wt.% gelatinized starch, and 0.25 wt.% polyacrylamide), 40 mL of surfactant (20 wt.% sodium dodecyl benzene sulfate), 50 mL of water repellent (alkyl ketene dimmer), CP, and PVDC were added during the mixing stages. The B-Zn-Al-Si compounds were prepared as described in Wu et al. (2016b). The detailed process is shown in Fig. 1.
Experimental design and statistical analysis
In this study, the limiting oxygen index (LOI) was used to optimize the conditions for manufacturing fire retardant ULDFs with the help of the Box-Behnken experimental design (BBD) using RSM. The factors and the levels were chosen by one-factor experiments. The selections of variables are shown in Table 1.
Table 1. Codes and Levels of Factors Chosen for the Trials
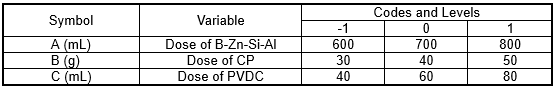
The software program Design Expert 8.0.6 (Stat-Ease Inc., Minneapolis, USA) was utilized to execute the optimization and mathematical modeling of the fire retardant ULDFs fabricating conditions. The BBD was used to model the RSM. Three independent variables, namely the dose of B-Zn-Si-Al compounds, CP, and PVDC, were chosen in the BBD design. Table 1 shows the variables that were coded as A, B, and C, and their levels were coded as -1, 0, and +1. The variables and levels came from the results of the single-factor experiments. The LOI value was picked as the response variable. An analysis of variance (ANOVA) was used to analyse the response surface model. In deciding the significance and adequacy of the quadratic polynomial model, ANOVA plays an important role.
Limiting oxygen index (LOI) test
The LOI was selected as the criterion by which to assess the flame resistant property of ULDFs. In accordance with GB/T 2406.2 (2009), experiments were implemented using a HC-2 limiting oxygen index instrument (Jiang Ning County Analysis Instrument Factory, Nanjing, China). Test specimens were sawn to the sizes of 150 × 10 × 10 mm3 (L × W × H). The shaped specimens were put in the specimen holder surrounded by a transparent glass tube, and the mixed gas fluent (O2 and N2) was regulated until the mixed gas stream near the specimen was steady. Every specimen on the top surface of the square pillar was lit and burned downwards. Afterwards, the lowest oxygen concentration that supported combustion was noted for this specimen. The final results were gathered by determining the mean value of five parallel experiments.
RESULTS AND DISCUSSION
Experimental Design Matrix and Results
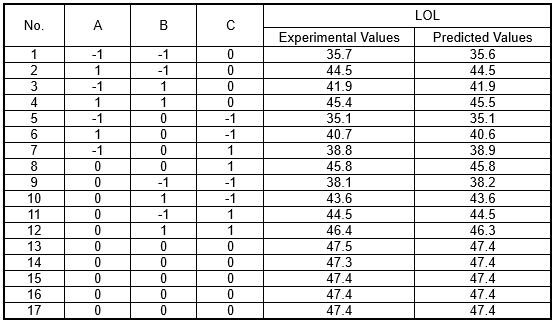
The BBD experimental design of 17 experiments and the corresponding results of LOI are shown in Table 2.
Table 2. Experimental Designs and Response Values
Model Fitting
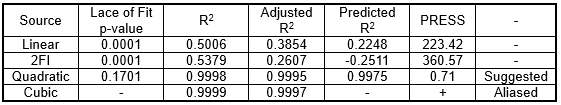
The correlations between the test results and variances were analyzed by different fitting models of RSM. The results are shown in Table 3.
Table 3. Sequential Model Sum of Squares
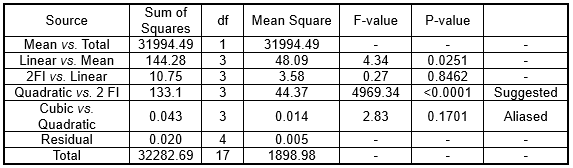
The significance of the fitting model depends on the “P-value.” Generally, if the “P-value” is more than 0.05, it indicates that the model is not significant. In contrast, if the “P-value” is less than 0.05, it is significant; if the “P-value” is less than 0.01, it is extremely significant. As shown in Table 3, the models of “2FI vs. Linear” and “Cubic vs. Quadra” were not significant, while the model of “Linear vs. Mean” was significant and the model of “Quadratic vs. 2 FI” was very significant. In accordance with the sequential model sum of squares, the models were chosen in accordance with the maximum order polynomials, and should not be aliased. The additional terms in this polynomial were significant.
The model(s) suggested are picked via the Whitcomb Score. The default is the model with the highest Score1. If one model is highest on Score1 and a different model is highest on Score2, then both models will be “Suggested”. The experimenter must choose between them. Model Score is defined as:
Score1 = (M)(L)(Predicted R2)
Score2 = (M)(L)(Adjusted R2)
Where: M is the Sequential Model Sum of Squares score (Table 3):
M=1, if p≤0.05 (p=p-value);
M=0.05/p, if p>0.05;
M=0; if model is aliased.
L is the Lack of Fit score (Table 4):
L=1, if p≥ 0.10 (or if Lack of Fit not present)
L=p/0.10, if p<0.10
In this case, the model of “Quadratic vs. 2 FI” is selected since it gets the highest value in both score1 and score2.
The model summary statistics are shown in Table 4. These statistics focused on the model’s maximum “Predicted R2” and the “Adjusted R2” values. A suitable model should obtain the highest “Predicted R2” and a lowest prediction sum of squares (PRESS). As shown in Table 4, the Quadratic model was similar with the Cubic model, but both of them had higher Adjusted R2 values than the model of Liner and 2FI. The “Predicted R2” of the Quadratic was the highest and the PRESS was the lowest. Based on above analysis, the suitable model was the quadratic polynomial model.
Table 4. Model Summary Statistics
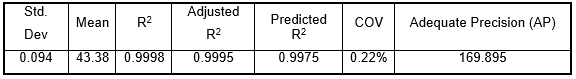
In deciding the significance and adequacy of the quadratic polynomial model, an analysis of variance (ANOVA) played an important role, and Table 5 lists the summary of the ANOVA. Due to the model’s F-value of 3585.77, it can be inferred that this model was significant. It was merely a 0.01% probability that one Model “F-Value” would happen because of noise. Values of the “P-value” < 0.05 suggested the model terms were significant. In this case A, B, C, AB, AC, BC, A2, B2, and C2 were significant model terms. When the values were > 0.05 it implied the model terms were not significant. Lack of fit is measuring how well the model fits the data. Strong lack of fit (p<0.05) is an undesirable property, because it indicates that the model doesn’t fit the data well. It is desirable to have an insignificant lack of fit (P>0.1). The P-value of the “lack-of-fit” was 0.1701 and was > 0.1, which indicated that the P-value was not significant. The model fit well and could be used for practical prediction in this experiment. Table 6 demonstrates the analysis of credibility on this model. The value “Predicted R2” of 0.9975 was in reasonable harmony with the “Adjusted R2” of 0.9995. “Adequate precision (AP)” assessed the signal to noise ratio (Wang and Lu 2005). An AP ratio greater than 4 was satisfactory (Bowerman 1991). Concurrently, the low value of the coefficient of variation (COV) (0.22%) indicated good accuracy and dependability of the tests as recommended by Ahmad et al. (2005) and Whitcomb (1994). In the present case, an AP ratio of 169.895 suggested an adequate signal. As a result, the model could be utilized to navigate this design space.
Table 5. The ANOVA for the Response Surface Quadratic Polynomial Model
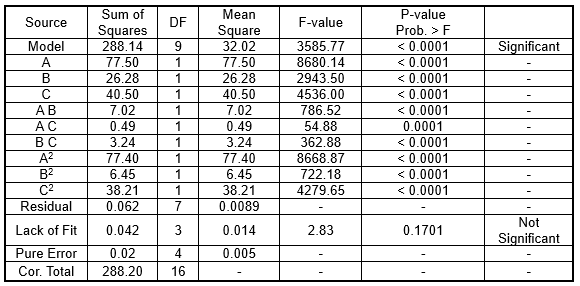
Table 6. Analysis of Credibility on this Model
The final equation in terms of the coded factors was as follows,
![]()
where Y is the LOI of ULDFs and A, B, and C are the coded variables for the dose of B-Zn-Si-Al compounds, CP, and PVDC, respectively.
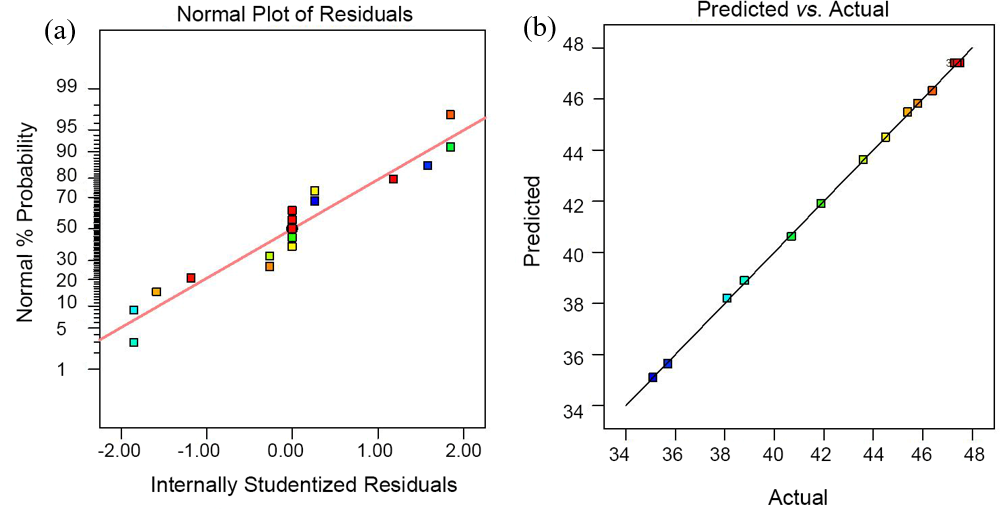
Fig. 2. (a) Normal probability plot of residual dilution; (b) Correlation between experimental values and predicted values
Figure 2 (a) shows the normal probability plot of the residual dilution, which illustrated that the residuals fell near the straight line, which depicted that the errors were normally dispersed. In Table 2, each of the experimental values was contrasted with the predicted values from the model. Each experimental value assessed by the predicted values is shown in Fig. 2 (b). All of the facts mentioned above indicated an outstanding sufficiency of the regression model.
Optimization of LOI
The fitted response surface for LOI of ULDFs by the above empirical model was generated using Design Expert software and is given in Figs. 3, 4, and 5.
As shown in Fig. 3, the LOI of ULDFs increased first, then decreased with increased doses of B-Zn-Si-Al. The amounts of B-Zn-Si-Al had an important influence on the response value Y. The LOI of ULDFs was at the lowest point (35.1), when the addition of B-Zn-Si-Al reached 600 mL. This may have been because the low amount of B-Zn-Si-Al could not promote the formation of a three-dimensional network structure. As a result, a massive loss of wood fibers and fines that were drained out with the water led to an increase in the white water concentration and deteriorating flammability (Wu et al. 2016b). With increased amounts of B-Zn-Si-Al, the LOI rose to the maximum then began to drop. This was because the B-Zn-Si-Al would cause agglomeration between the particles, which undermined the function of the adsorption bridging action and sweep flocculation. The LOI had an ascending trend that changed to a smooth trend with increased CP. The contour lines were near elliptical, which indicated that the interaction effects of B-Zn-Si-Al and CP were significant.
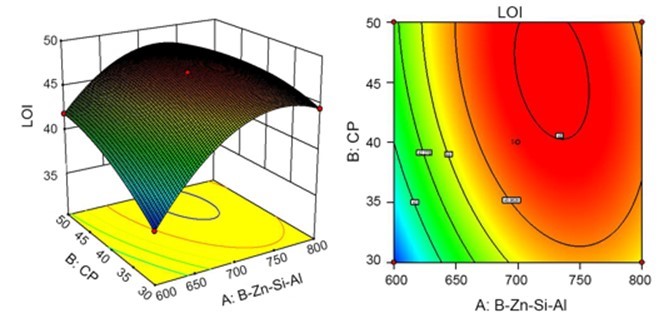
Fig. 3. 3D Response surface plots and contour lines showing the effects of the amounts of B-Zn-Si-Al and amounts of CP on the LOI of specimens
From Fig. 4, the LOI of ULDFs increased in the beginning, then it declined with the increase of both PVDC and B-Zn-Si-Al. The LOI reached the highest point when these two variances remained close to zero. The reason may have been that PVDC’s weak acidity could change the film-forming environment of B-Zn-Si-Al, which could weaken absorption and bridge effects, and caused a massive loss of flame retardance when more PVDC was added. The contour lines appeared round, which indicated that the interaction effects of B-Zn-Si-Al and CP were not significant.
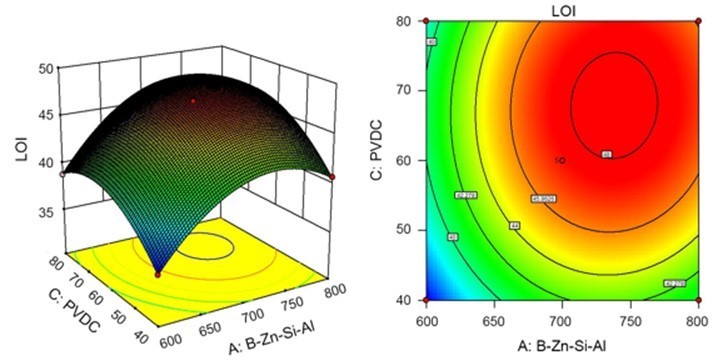
Fig. 4. 3D Response surface plots and contour lines showing the effects of the amounts of B-Zn-Si-Al and amounts of PVDC on the LOI of specimens
Figure 5 shows the effect of the interaction of CP and PVDC on the LOI. It was evident that the LOI experienced growth with increased CP, while the LOI increased in the first stage, and then decreased with the increase of PVDC. The contour lines took on an elliptical shape, which indicated that the interaction effects of PVDC and CP were significant.
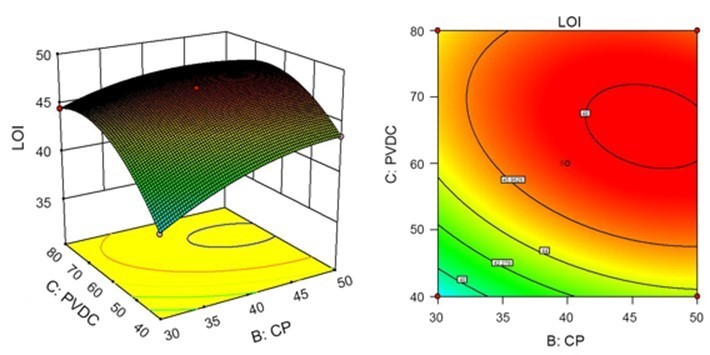
Fig. 5. 3D Response surface plots and contour lines showing the effects of the amounts of CP and amounts of PVDC on the LOI of specimens
Validation of the Models
The process parameters of the fire retardant ULDFs were studied and optimized by RSM. The optimum technological conditions were as follows: the usage of B-Zn-Si-Al, PVDC, and CP were 800 mL, 46.47 mL, and 35.64 g, respectively. The LOI of the average of 10 parallel experiments of the final product was 48.4, under the optimum conditions. The result was approximately the predicted value in Eq. 1, which indicated that the model of Eq. 1 was accurate, and further verified the practicality of this optimum strategy.
CONCLUSIONS
Based on the three factors and three levels of the Box-Behnken Design, RSM was utilized to optimize the manufacturing conditions that enhanced the LOI.
- The results indicated that RSM provided a practical and useful method for fire retardant optimization. From the results, the technique not only assisted in discovering the prime levels of the most noteworthy factors considered with the least resources and time, but also proved to be effective and reasonable in this process-optimizing experiment.
- The optimal usage of B-Zn-Si-Al, PVDC, and CP were 800 mL, 46.47 mL, and 35.64 g, respectively. In this situation, the maximum LOI was 48.4.
ACKNOWLEDGEMENTS
This paper is supported by the Scientific Research Foundation of Graduate School of Fujian Agriculture and Forestry University (1122YB033) and the Studying Abroad Scholarships of China. The authors are grateful for the financial support of the National Science and Technology Support Program (2008BADA9B01) and the National Natural Science Foundation of China (NSFC) (30781982).
REFERENCES CITED
Ahmad, A. L., Ismail, S., and Bhatia, S. (2005). “Optimization of coagulation-flocculation process for palm oil mill effluent using response surface methodology,” Environmental Science & Technology 39(8), 2828-2834. DOI: 10.1021/es0498080
Baş, D., and Boyacı, İ. H. (2007). “Modeling and optimization I: Usability of response surface methodology,” Journal of Food Engineering 78(3), 836-845. DOI: 10.1016/j.jfoodeng.2005.11.024
Bowerman, B. L. (1991). “Statistical design and analysis of experiments with applications to engineering and science,” Technometrics 33(1), 105-106. DOI: 10.1080/00401706.1991.10484774
Box, G. E. P., and Draper, N. R. (1987). Empirical Model Building and Response Surfaces, John Wiley, New York.
Chen, T. J., Wu, Z. Z., Niu, M., Xie, Y. Q., and Wang, X. D. (2015a). “Effect of Si–Al molar ratio on microstructure and mechanical properties of ultra-low density fiberboard,” European Journal of Wood and Wood Products 74(2), 151-160. DOI: 10.1007/s00107-015-0986-x
Chen, T. J., Niu, M., Wang, X. D., Wei, W., Liu, J. H., and Xie, Y. Q. (2015b). “Synthesis and characterization of poly-aluminum silicate sulphate (PASS) for ultra-low density fiberboard (ULDF),” RSC Advances 5(113), 93187-93193. DOI: 10.1039/C5RA13996A
Chen, T. J., Niu, M., Xie, Y. Q., Wu, Z. Z., Liu, X. Z., Cai, L. L., and Zhuang, B. R. (2014). “Modification of ultra-low density fiberboards by an inorganic film formed by Si-Al deposition and their mechanical properties,” BioResources 10(1), 538-547. DOI: 10.15376/biores.10.1.538-547
Chen, T. J., Liu, J. H., Wu, Z. Z., Wang, W., Niu, M., Wang, X. D., and Xie, Y. Q. (2016a). “Evaluating the effectiveness of complex fire-retardants on the fire properties of ultra-low density fiberboard (ULDF),” BioResources 11(1), 1796-1807. DOI: 10.15376/biores.11.1.1796-1807
Chen, T. J., Xie, Y. Q., Cai, L. L., Zhuang, B. R., Wang, X. D., Wu, Z. Z., Niu, M., and Lin, M. (2016b). “Mesoporous aluminosilicate material with hierarchical porosity for ultra-low density wood fiber composite (ULD_WFC),” ACS Sustainable Chemistry & Engineering 4(7), 3888-3896. DOI: 10.1021/acssuschemeng.6b00691
Chen, T. T., Liu, W. D., and Qiu, R. H. (2013). “Mechanical properties and water absorption of hemp fibers–reinforced unsaturated polyester composites: Effect of fiber surface treatment with a heterofunctional monomer,” BioResources 8(2), 2780-2791.
El Hage, R., Viretto, A., Sonnier, R., Ferry, L., and Lopez-Cuesta, J. M. (2014). “Flame retardancy of ethylene vinyl acetate (EVA) using new aluminum-based fillers,” Polymer Degradation and Stability 108, 56-67. DOI: 10.1016/j.polymdegradstab.2014.05.029
GB/T 2406.2 (2009). “Plastics-determination of burning behavior by oxygen index-Part 2: Ambient-temperature test,” Standardization Administration of China, Beijing, China.
Gu, J. Y., and Gao, Z. H. (2002). “A discussion on producing agro-residue composites with isocyanate resins,” Journal of Forestry Research 13(1), 74-76. DOI: 10.1007/bf02857151
Guo, W. Q., Meng, Z. H., Ren, N. Q., Zhang, Z. P., and Cui, F. Y. (2011). “Optimization of key variables for the enhanced production of hydrogen by Ethanoligenens harbinense W1 using response surface methodology,” Fuel & Energy Abstracts 36(36), 5843-5848. DOI: 10.1016/j.ijhydene.2010.11.004
Hoffendahl, C., Fontaine, G., Duquesne, S., Taschner, F., Mezger, M., and Bourbigot, S. (2015). “The combination of aluminum trihydroxide (ATH) and melamine borate (MB) as fire retardant additives for elastomeric ethylene vinyl acetate (EVA),” Polymer Degradation and Stability 115, 77-88. DOI: 10.1016/j.polymdegradstab.2015.03.001
Liang, Y. S., Yu, J. Y., Peng, Z. G., and Ai, P. S. (2013). “Flammability and thermal properties of bitumen with aluminium trihydroxide and expanded vermiculite,” Construction and Building Materials 48, 1114-1119. DOI: 10.1016/j.conbuildmat.2013.07.074
Niu, M., Hagman, O., Wang, X. A., Xie, Y. Q., Karlsson, O., and Cai, L. L. (2014). “Effect of Si-Al compounds on fire properties of ultra-low density fiberboard,” BioResources 9(2), 2415-2430. DOI: 10.15376/biores.9.2.2415-2430
Thomas, S., Paul, S. A., Pothan, L. A., and Deepa, B. (2011). “Natural fibres: Structure, properties and applications.” in: Cellulose Fibers: Bio- and Nano-Polymer Composites: Green Chemistry and Technology, S. Kalia, S. B. Kaith, and I. Kaur (eds.), Springer-Verlag, Berlin, Germany, pp. 3-42.
Wang, Y. X., and Lu, Z. X. (2005). “Optimization of processing parameters for the mycelial growth and extracellular polysaccharide production by Boletus spp. ACCC 50328,” Process Biochemistry 40(3-4), 1043-1051. DOI: 10.1016/j.procbio.2004.03.012
Whitcomb, P. (1994). “Design of experiments: Statistical principles of research design and analysis,” American Statistician 48(4), 236-237.
Wu, Z. Z., Chen, T. J., Huang, D. B., Wang, W., Xie, Y. Q., Wang, H., and Wang, X. D. (2016a). “Effect of PVDC on the fire performance of ultra-low density fiberboards (ULDFs),” BioResources 11(4), 8653-8663. DOI: 10.15376/biores.11.4.8653-8663
Wu, Z. Z., Chen, T. J., Niu, M., Cai, L. L., Xie, Y. Q., and Wang, X. D. (2016b). “Effect of boron-zinc-aluminum-silicium compounds on the fire performance of ultra-low density fiberboards (ULDFs),” BioResources 11(2), 14. DOI: 10.15376/biores.11.2.5050-5063
Xie, Y. Q., Chen, Y., Wei, Q. H., and Zhang, D. Z. (2008a). “Study on forming a truss-like reticular structure made from nature fiber under the effect of liquid frothing,” Journal of Fujian College of Forestry 28(3), 299-303.
Xie, Y. Q., Tong, Q. J., and Chen, Y. (2008b). “Construction mechanism of reticular structure of plant fiber,” Journal of Korea Furniture Society 19(2), 106-110.
Xie, Y. Q., Tong, Q. J., Chen, Y., Liu, J. H., and Lin, M. (2011). “Manufacture and properties of ultra-low density fibreboard from wood fibre,” BioResources 6(4), 4055-4066. DOI: 10.15376/biores.6.4.4055-4066
Article submitted: February 2, 2017; Peer review completed: March 17, 2017; Revised version received and accepted: March 27, 2017; Published: April 6, 2017.
DOI: 10.15376/biores.12.2.3790-3800