
Abstract
The laccase-mediator system in laccase-aided chlorine dioxide bleaching of bagasse pulp was optimized using response surface methodology (RSM). The effects and interactions of the laccase enzyme dosage, the dosage of the mediator 1-hydroxybenzotriazole (HBT), and the reaction time on the adsorbed organic halogen (AOX) content of the wastewater as well as the brightness and kappa number of the pulp were examined. The optimal reaction conditions to achieve a balance of lower AOX content, higher brightness, and lower kappa number were as follows: laccase enzyme dosage of 20.3 U/g, HBT dosage of 1.51%, and reaction time of 154.5 min. Under these conditions, an AOX content of 20.67 mg/L, brightness of 58.94% ISO, and kappa number of 2.71 were observed. These results will offer a favorable option for pulp and paper mills as well as the natural environment and therefore provide a theoretical foundation for the industrial application of laccase in bleaching processes.
Download PDF
Full Article
Optimization of Laccase-Aided Chlorine Dioxide Bleaching of Bagasse Pulp
Yong Pei,a Shuangfei Wang,a,b Chengrong Qin,a,b Jingjing Su,a Shuangxi Nie,a,b,* and Xueping Song a,b,*
The laccase-mediator system in laccase-aided chlorine dioxide bleaching of bagasse pulp was optimized using response surface methodology (RSM). The effects and interactions of the laccase enzyme dosage, the dosage of the mediator 1-hydroxybenzotriazole (HBT), and the reaction time on the adsorbed organic halogen (AOX) content of the wastewater as well as the brightness and kappa number of the pulp were examined. The optimal reaction conditions to achieve a balance of lower AOX content, higher brightness, and lower kappa number were as follows: laccase enzyme dosage of 20.3 U/g, HBT dosage of 1.51%, and reaction time of 154.5 min. Under these conditions, an AOX content of 20.67 mg/L, brightness of 58.94% ISO, and kappa number of 2.71 were observed. These results will offer a favorable option for pulp and paper mills as well as the natural environment and therefore provide a theoretical foundation for the industrial application of laccase in bleaching processes.
Keywords: Response surface methodology; Laccase; AOX; ECF; Bagasse soda pulp
Contact information: a: College of Light Industry and Food Engineering, Guangxi University, Nanning 530004, PR China; b: Guangxi Key Laboratory of Clean Pulp & Papermaking and Pollution Control;
* Corresponding author: nieshuangxi061@163.com; sx_ping@sina.com
INTRODUCTION
Chlorine dioxide is the most important bleaching chemical in the elemental chlorine-free (ECF) bleaching of pulp. It has shown a series of fundamental benefits compared with traditional bleaching chemicals (Bajpai et al. 2006; Nie et al. 2014a). ECF bleaching can restrain the formation of adsorbed organic halogen (AOX) and other chlorine compounds (Li et al. 2014). AOX is regarded as one of the most generally significant criteria to assess the composition of a bleaching effluent (Nie et al. 2014b). Many governments have set emission standards for these compounds, especially AOX. The Chinese government, for example, has imposed a limit for AOX discharge, stipulating the AOX content of a bleaching effluent discharged to be no more than 12 mg/L (Zhang et al. 2012). To meet these limits, many techniques and process optimizations have been investigated to eliminate the discharge of AOX from laboratories and the papermaking industry, including end-of-pipe treatment techniques and modification of bleaching technologies (Savant et al. 2006). Unfortunately, the utilization of these techniques generates new environmental problems such as extra expenses for disposal of waste from treatment facilities (Savant et al. 2006). Reducing the use of chlorinated bleaching chemicals is crucial for decreasing the discharge of AOX in bleaching effluents; therefore, considerable attention has recently been shifted to exploring cost-effective and environment-friendly bleaching technologies for reducing AOX generation (Sharma et al. 2014).
In all of the environmentally friendly bleaching technologies, biobleaching with enzymes has shown tremendous potential for decreasing the use of chlorinated bleaching chemicals (Singh et al. 2008). Laccase is a representative biological enzyme for pulp bleaching and an effective lignin degrader (Knezevic et al. 2013a,b). It can selectively degrade the lignin of paper fibers (Jialin et al. 2006; Qiu and Chen 2012; Quintana et al. 2015), imposes little damage on the cellulose of paper fibers (Bourbonnais et al. 1995), and has been used in labs and at the pilot scale (Euring et al. 2011; Goncalves et al. 2014; Martin-Sampedro et al. 2015). Laccase-aided bleaching can reduce the use of chlorine dioxide in ECF bleaching and reduce the formation of organic chlorine compounds in the bleaching effluent (Bajpai et al. 2006). Other benefits of laccase-aided bleaching are an improved pulp yield and a lower capital investment (Bajpai et al. 2006). Baker et al. (2015) found that rot fungi able to secrete laccase showed higher delignification on pressure-refined Miscanthus than milled Miscanthus (Baker et al. 2015). Thaku et al. found a reduction in demand of chlorine dioxide by more than 35% during enzymatic pre-treatment on kraft pulps from wood and nonwood based raw materials (Thaku et al. 2012). Sharma et al. reported a 35% ClO2 reduction and a 34% AOX content reduction in ECF bleaching during enzymatic pre-treatment of eucalyptus kraft pulp (Sharma et al. 2014). Another experiment obtained an increase in brightness of 40% ISO and 80% delignification in a laccase-aided bleaching of flax pup (Fillat and Roncero 2010). One experiment saw the kappa number reduced by 21.1% and increases in brightness, tear index, and burst index of 5.89%, 8%, and 18%, respectively, in laccase-aided bleaching of wheat straw-rich soda pulp (Singh et al. 2008).
Optimization through factorial design and response surface methodology (RSM) has been a common practice in biotechnology (Kalil et al. 2000). RSM is widely applied in chemical (Aljundi 2011), biology (Trawczynska and Wojcik 2015), enzyme, and other fields for the optimization of all kinds of biochemical, biotechnological, and microbiological products (Beg et al. 2003). It minimizes experimentation and time and is far more efficient than traditional methods for optimizing such a process (Nie et al. 2013). This technique to establish optimal process designs for the process of AOX generation in enzymatic ECF bleaching, however, is not available; therefore, the present work was an attempt to employ RSM to optimize the key parameters of enzymatic ECF bleaching of soda AQ bagasse. The parameters investigated include laccase enzyme dosage, HBT dosage, and reaction time, which are critical factors for the AOX content of the bleaching effluent, as well as brightness and kappa number of the pulp.
EXPERIMENTAL
Materials
Unbleached bagasse pulp (brightness 38.97% ISO, viscosity 1280.86 mL/g, and kappa number 12.51) used in the bleaching experiments was obtained from the Pumiao Paper Mill (Guangxi, China). The laccase was supplied by Shanghai Yongye Bio-Technology Co., Ltd. (Shanghai, China). The laccase had a laccase activity of 2000 U/g. Chlorine dioxide solution stored in a brown bottle was also collected from the Pumiao Paper Mill (Guangxi, China) (available chlorine concentration 21.58 g/L). Ceramic wool and activated carbon were procured from Analytik-Jena Instrument Company (Jena, Germany), and all other chemicals used in this study were purchased from Aladdin Reagent (Shanghai) Co., Ltd. All of the chemicals were of analytical grade, unless otherwise mentioned.
Methods
The laccase activity was determined by monitoring the oxidation of 2,2’-azino-bis(3-ethylbenzthiazoline-6-sulfonic acid) (ABTS) as increased absorbance at 420 nm. The reaction mixture contained 2.5 mL of sodium acetate buffer (pH 4.5), 0.1 mL of the enzyme sample, and 0.4 mL of 1 mM ABTS, in a final volume of 3.0 mL. In this study, 1 U is the amount of enzyme that converts 1 µmol of substance in one minute under the described conditions at 25 °C (Bajpai et al. 2006).
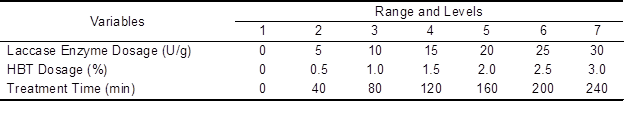
Laccase enzyme biobleching treatment of the unbleached bagasse pulp was carried out in a micro-reactor at 50 °C. The biobleaching treatment conditions and the variable levels are given in Table 1. Other constant parameters needed in this biobleching treatment were as follows: surfactant (Tween® 80) 0.05%, pulp consistency of 10% (buffer solution of sodium acetate and acetic acid), oxygen pressure 0.4 MPa, and rotating speed 60 rpm. After laccase enzyme biobleaching treatment, the pulps were washed to neutral pH with distilled water. The washed pulps were then used for chlorine dioxide bleaching.
Table 1. Range and Levels of the Three Independent Variables
The washed pulps, chlorine dioxide solution, and sulfuric acid solution were mixed in a plastic bag with a pulp consistency of 10%. Other parameters used during chlorine dioxide bleaching were a chlorine dioxide dosage of 3.7% and a sulfuric acid solution pH value of 4.5. Then the bags were heated in a water bath at 70 °C for 1 h with kneading every 15 min. After bleaching, the pulps were washed to neutral pH with distilled water. The bleached pulps were placed in a lab with constant temperature and constant humidity for 24 h and then subjected to characterization. In the control experiment, the laccase enzyme biobleching treatment of the unbleached bagasse pulp was replaced with the buffer solution alone, and the subsequent conditions used for chlorine dioxide bleaching were the same as those for the experimental samples. All of the experiments were conducted in triplicate, and the mean values were recorded.
The brightness of the pulp was measured according to (TAPPI T452 om-02), and kappa number indicating the residual lignin in the pulp was determined according to (TAPPI T236 om-99).
The AOX content was measured by a Multi X 2500 halide analyzer (Jena, Germany). The process was as follows: first, the diluted bleaching effluent was passed through an activated carbon column and the organic chlorine of the bleaching effluent was adsorbed by the activated carbon; second, the adsorbed inorganic chlorine in the activated carbon column was washed with sodium nitrite; finally, the activated carbon column was burned in a combustion furnace, after which the AOX content was calculated by the micro Coulomb titration method (Nie et al. 2013, 2014a,b).
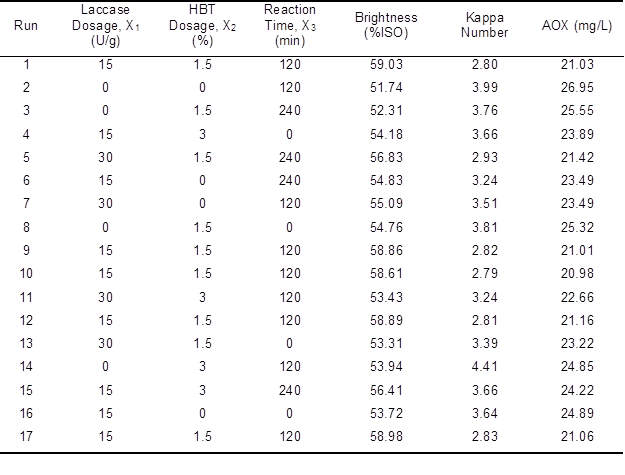
According to the center combination experimental design theory of Box- Behnken (Box and Draper 1987), RSM was employed to optimize the bleaching process conditions of the unbleached bagasse pulp. In the current research, three variables, laccase enzyme dosage (X1), HBT dosage (X2), and pretreatment time (X3), were investigated at three levels (-1, 0, and +1) to assess the effects and interactions of the factors. The brightness and kappa number of the pulp and the AOX content of the bleaching effluent were chosen as the dependence response variables to assess the bleaching effect. With 5 experiments at the central level as replicates, the research included 17 total runs (Table 2).
RESULTS AND DISCUSSION
RSM Analysis
Table 2. Box-Benhnken Results and the Values of the Three Response Variables
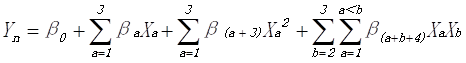
Based on the collected data (Table 2), regression analysis was used and was integrated into the aposteriori second-order polynomial model (Aljundi 2011) to analyze whether there was correlation between the factors and the response variables (Trinh and Kang 2011). The second-order quadratic model is shown as Eq. 1,
 (1)
(1)
where Yn is the predicted response variable (brightness, kappa number, and AOX content); n is the factor number; Xa and Xb are independent factors affecting Yn; β0 is the intercept; and βa, β(a+3), and β(a+b+4) are the first-order coefficients for the linear term, the second-order quadratic term, and the interaction term (Trinh and Kang 2011). Using the Box-Benhnken design in Design Expert V8.0.6.1 (Statease Inc., Minneapolis, USA), the coefficients were evaluated by multiple linear regression analysis. Parameters with less than 0.95 significance (p>0.05) were added to the error term. The three-dimensional response surface and contour plots of the response models were plotted to characterize the effects and interactions of the invariables on brightness, kappa number, and AOX content. Additional experiments were carried out to validate the mathematical model.
Assessment of Experimental Results for AOX Content of the Effluent
The second-order quadratic polynomial shown by Eq. 2 for AOX content was obtained by multiple linear regression analysis.
Y1 = 21.04 – 1.49X1– 0.4X2 – 0.33X3 + 1.6X12 + 1.84 X22 + 1.23 X32 +
0.32 X1 X2 – 0.51 X1 X3 + 0.43 X2 X3 (2)
The polynomial shows that the quadratic model was in reasonable accordance with the experimental results (R2 = 0.9614), where an appropriate model fit should be greater than 0.8 (Shukla et al. 2014). Figure 1 shows the close relationship between the actual values and the model values, which indicates a good fit of the second-order quadratic polynomial to the actual data.
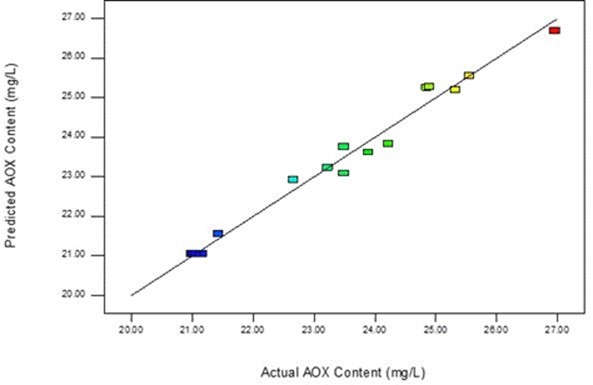
Fig. 1. Predicted vs. actual values for AOX content
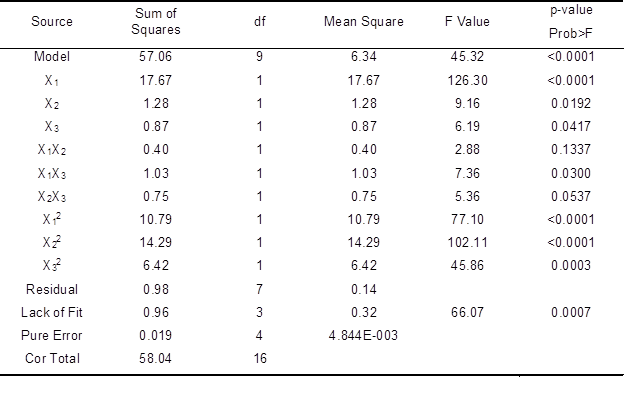
Analysis of variance (ANOVA) results (Table 3) showed that the X1, X2, X3, X1X3, X12, X22, and X32 terms were significant (p<0.05). The p-value for lack of fitness was 0.0007. Lack of fit was significant (p<0.05) and the model equation was adequate. The predicted value of the sum of squares was 57.06, indicating that the model had a higher predictability and accuracy (Singh et al. 2008). The value of Prob > F, which infers significance, was < 0.0001, indicating that the model obtained was highly significant.
The noise ratio of 19.681 was greater than the standard value of 4, which indicates an adequate signal. Thus, the model can be used to navigate the design space. The best combination was a laccase enzyme dosage of 22.44 U/g, HBT dosage of 1.56%, and reaction time of 147.5 min. Under these conditions, the AOX content was 20.63 mg/L.
Table 3. ANOVA for Response Surface Quadratic Model of AOX Content
The three-dimensional response surface and contour plots for AOX yield are shown in Fig. 2. The responses for the variables were essentially in agreement with the models.
According to the plots, at the best laccase enzyme dosage, the AOX content was relatively lower than those for the other values of laccase enzyme dosage. At the best HBT dosage, the AOX content was also relatively lower. The content of HBT was too low to degrade the residual lignin; however, the content of HBT was too high and inhibited the combination of laccase and residual lignin, leading to the increased content of AOX in the bleaching effluent.
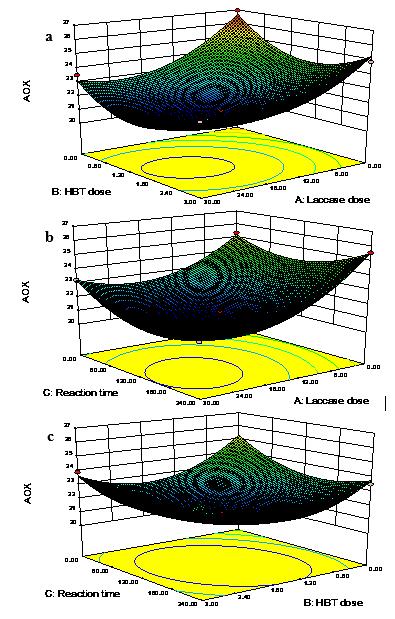
Fig. 2. Three-dimensional response surface plots for AOX yield: (a) laccase dose and HBT dose, (b) laccase dose and reaction time, and (c) HBT dose and reaction time
At the best reaction time, and under the chosen laccase enzyme dosage and HBT dosage, the AOX content was slightly lower than with the increase or decrease in reaction time. This was expected, as phenolic moieties of residual lignin could not be degraded as much as possible when the reaction time was too short; however, the reaction would result in dehydrogenetive polymerization of the degraded residual lignin molecules if the reaction time was too long (Balakshin et al. 2001). This was due to the disappearance of β-O-4ˊ, andβ-βˊandβ-5ˊbonds of lignin that were present in original residual lignin. Similar to these results, the sequential enzymatic treatment studied by Sharma resulted in a reduced AOX content of 34% in bleach effluents (Sharma et al. 2014).
Similar to the assessment of AOX content, a corresponding model for brightness is given by Eq. 3:
Y2 = 58.87 + 0.74X1 + 0.32 X2 + 0.55 X3 – 2.9 X12 – 2.42 X22 –
1.67 X32 – 0.97 X1 X2 + 1.49 X1 X3 + 0.28 X2 X3 (3)
The model is in strong accordance with the experimental results, with R2 = 0.9766. Figure 3 shows that the predicted values and the actual values were distributed uniformly.
Table 4. ANOVA for Response Surface Quadratic Model of Brightness
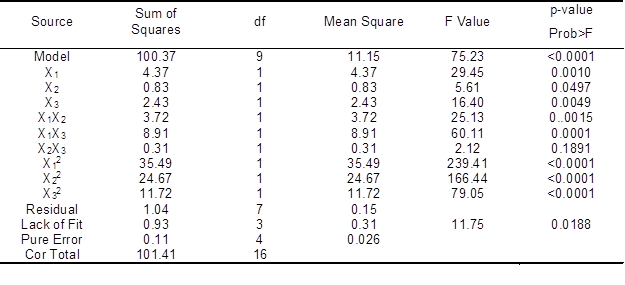
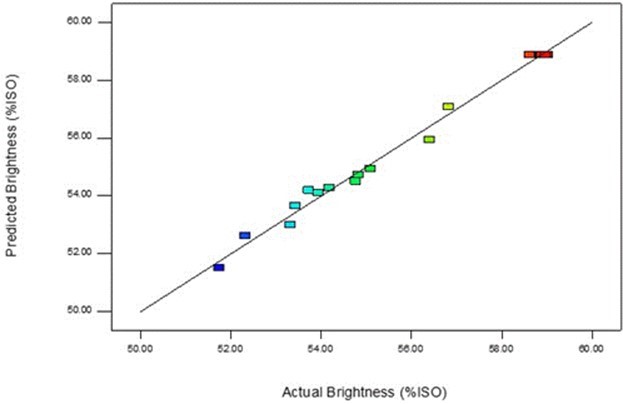
Fig. 3. Predicted vs. actual values of brightness
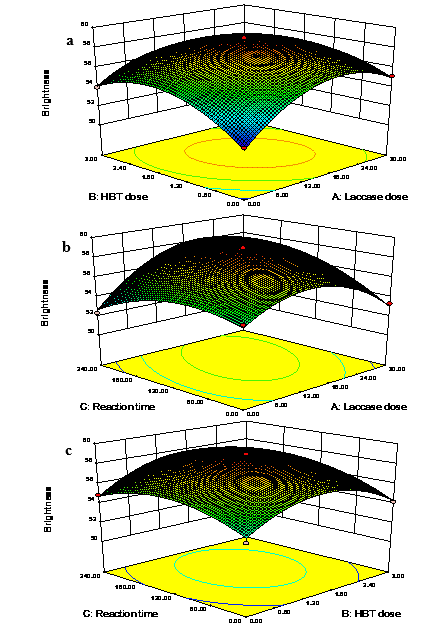
Fig. 4. Three-dimensional response surface drawings for brightness: (a) laccase dose and HBT dose, (b) laccase dose and reaction time, and (c) HBT dose and reaction time
Analysis of variance (ANOVA) results (Table 4) showed that the value of Prob > F was <0.0001, indicating that the model obtained was highly significant. The ANOVA result showed that the X1, X2, X3, X1X2, X1X3, X12, X22, and X32 terms were significant (p<0.05). The p-value for lack of fitness was 0.0188. Lack of fit was significant (p<0.05) and the model equation was adequate. The value of the sum of squares was 100.37, indicating that the model had a higher predictability and accuracy. The noise ratio (24.891) was greater than the standard value of 4, which indicates an adequate signal; thus, the model can be used to navigate the design space. The optimal conditions for a higher brightness of the bleached pulp were a laccase enzyme dosage of 17.77 U/g, HBT dosage of 1.57%, and reaction time of 150.12 min. Under these conditions, the brightness was 59.02% ISO.
The three-dimensional response surface and contour plots for brightness are shown in Fig. 4. The contour and the peak in the response surface demonstrate that the extreme value was situated in the center. In other words, the optimal condition occurred in the experimental range. There were obvious interactions between laccase enzyme dosage and HBT dosage, laccase enzyme dosage and reaction time, and HBT dosage and reaction.
The brightness increased when the laccase enzyme dosage was insufficient (less than 15 IU/g), and decreased a little thereafter. The dosage of laccase was not sufficient enough (less than 15 IU/g) to degrade the residual lignin, leading to a low brightness. Similar to previous results, a laccase enzyme dosage of 20 U/g maximized the brightness of the pulp (Fillat and Roncero 2009). Ravalason et al. (2012) also observed the potential of laccase for increasing pulp brightness. It seems that mediators are required for laccase biobeaching because of the large size of laccase (Singh et al. 2007). Therefore, a mediator such as HBT may be beneficial for the enhancement of brightness, but only a small amount of HBT is necessary. A low dosage of HBT did not effectively promote the degradation of lignin. However, further increases in the dosage of HBT beyond the optimal amount also did not promote the delignification. A quick treatment resulted in an inadequate reaction between laccase and lignin; however, a long treatment time led to brightness reversion. As reported by another work, an appropriate enzymatic reaction time enhanced the brightness by approximately 5.89%, without further alkaline extraction (Singh et al. 2008).
Assessment of Experimental Results for Kappa Number of Pulp
The same analysis that was used for AOX content and brightness was applied to kappa number. The regression model for kappa number of the pulp is shown by Eq. 4:
Y3 = 2.81 – 0.36X1 + 0.074X2 – 0.11X3 + 0.45X12 + 0.53X22 +
0.21X32 – 0.17 X1X2 – 0.1X1X3 + 0.1X2X3 (4)
The regression coefficient was close to 1 (R2 = 0.9805), showing that the quadratic model was in accordance with the experimental results. Figure 5 shows a strong correlation between the predicted values and the actual values.
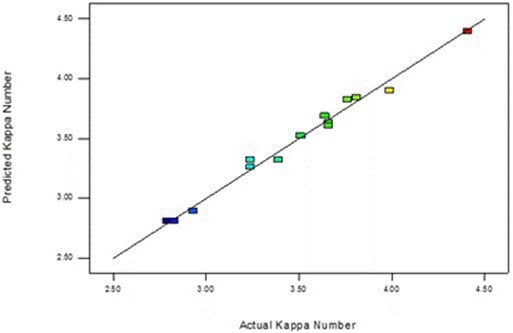
Fig. 5. Predicted vs. actual values of kappa number
Table 5. ANOVA for Response Surface Quadratic Model of Kappa Number
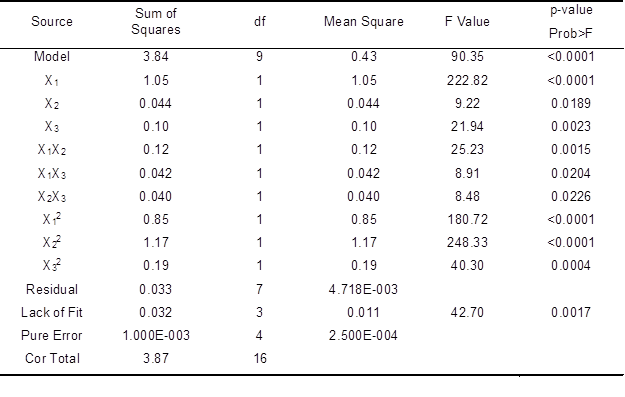
Similar to the analysis results for the other factors, the ANOVA results (Table 5) for kappa number showed that X1, X2, X3, X1X2, X1X3, X12, X22, and X32 were significant model terms, as their values were less than 0.05 (p<0.05). The p-value for lack of fitness was 0.0017. Lack of fit was significant (p<0.05) and the model equation was adequate. The Prob > F was <0.0001, indicating that the model for kappa number was highly significant. A value of Prob > F greater than 0.1 indicates that the model terms were not significant. The value of the sum of squares was 3.84, indicating that the model fitted each point in design. The value of Prob>F was 0.0001, which indicates that the model obtained was highly significant. The noise ratio (30.111) was greater than the standard value of 4, indicating an adequate signal. Thus, the model can also be used to navigate the design space. The optimal conditions for a lower kappa number of the bleached pulp were a laccase enzyme dosage of 21.59 U/g, HBT dosage of 1.45%, and reaction time of 165.89 min. Under these conditions, the value of the kappa number was 2.71. The three-dimensional response surface and contour plots for kappa number are shown in Fig. 6.
The optimal condition occurred within the experimental range. There were obvious interactions between laccase enzyme dosage and HBT dosage, laccase enzyme dosage and reaction time, and HBT dosage and reaction time. The kappa number obviously declined when the laccse enzyme dosage was insufficient, or the HBT dosage was too high or too low, or the reaction time was too long or too short. As shown before, the accumulation of degraded residual lignin was the principal reason for the delignification limit, which resulted in the difficulty of the chemicals diffusing into fibers (Balakshin et al. 2001). Similar results have been reported for Eucalyptus kraft pulp, with a 43% reduction in kappa number after treatment of laccase followed by alkaline extraction (Fu et al. 2000). The optimum conditions with laccase preparation achieved a 21.1% reduction in kappa number (Singh et al. 2008). Another work reported that an appropriate time of the laccase-mediator system treatment caused a significant kappa number reduction (Bajpai 2004); therefore, an appropriate laccase enzyme dosage, HBT dosage, and reaction time are essential for decreasing the kappa number.
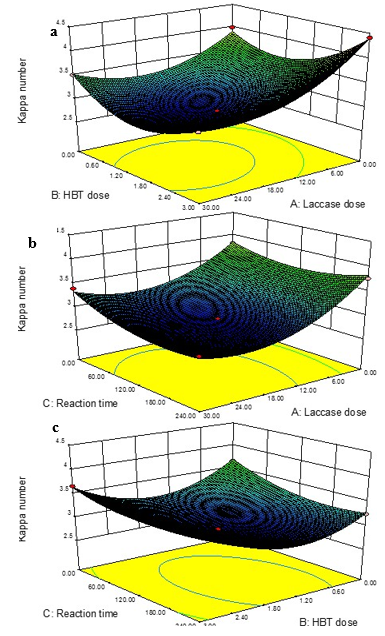
Fig. 6. Three-dimensional response surface drawings for kappa number: (a) laccase dose and HBT dose, (b) laccase dose and reaction time, and (c) HBT dose and reaction time
Validation Experiments
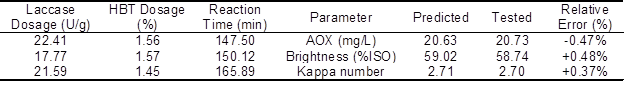
To verify the statistical model, three checkpoint experiments were carried out. The brightness, kappa number, and AOX content of the tested values and the predicted values are listed in Table 6. The tested values and the predicted values were in good agreement, suggesting the validity of the statistical model.
Table 6. Predicted and Tested Values of Variables During the Validation Experiment
Integration of the Optimization Results
The three different independent responses of AOX content of the effluent, kappa number, and brightness of the pulp obtained their best levels under different reaction conditions. Because of the importance of these three different responses in practice, the professional software Design Expert 8.0.6.1 was employed to confirm the best conditions for the aim of obtaining a higher brightness, a lower kappa number, and a lower AOX content. The laccase enzyme dosage of 20.30 U/g, HBT dosage of 1.51%, and reaction time of 154.51 min were obtained as the best conditions by Design Expert V8.0.6.1. Under the best conditions, an AOX content of 20.67 mg/L, brightness of 58.94% ISO, and kappa number of 2.71 were predicted. To verify the veracity of the best conditions predicted by Design Expert V8.0.6.1, three additional validation experiments were carried out under the best conditions in triplicate.
Table 7. Predicted and Tested Values of the Best Conditions
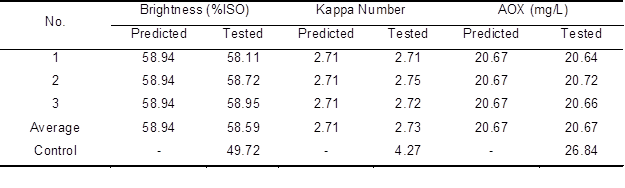
As shown in Table 7, a mean AOX content of 20.67 mg/L, mean brightness of 58.59% ISO, and mean kappa number of 2.73 were obtained, corresponding to the predicted values for AOX content, brightness, and kappa number of 20.67 mg/L, 58.94% ISO, and 2.71, respectively. Therefore, enzymatic bleaching of the unbleached bagasse pulp with laccase followed by chlorine dioxide bleaching resulted in a 17.84% increase in brightness, 36.07% reduction in pulp kappa number, and 23% reduction of AOX content in the bleaching effluent compared with the control. Compared with the 23% reduction in AOX content in the present research, Sharma et al. (2014) reduced the AOX content by 34% in bleaching effluent with a bleaching sequence of DoE(p)D1D2.
CONCLUSIONS
- A RSM approach was used to optimize the enzymatic treatment of laccase-aided chlorine dioxide bleaching of bagasse pulp. The optimal conditions to achieve a balance of lower AOX content, higher brightness, and lower kappa number were as follows: laccase enzyme dosage of 20.3 U/g, HBT dosage of 1.51%, and reaction time of 154.5 min. These conditions resulted in a 17.84% increased brightness, 36.07% reduced kappa number, and 23% reduced AOX content.
- This research shows potential benefit to paper mills as well as the natural environment and therefore provides a theoretical foundation for the industrial application of laccase enzyme in bleaching processes.
ACKNOWLEDGMENTS
The project was sponsored by the Scientific Research Foundation of Guangxi University (Grant No. XTZ140551), the National Natural Science Foundation of China (B061103), the Guangxi Natural Fund (2013GXNSFFA019005 and (2014GXNSFBA118032), and the Guangxi Science and Technology Development Plan (1348013-2).
REFERENCES CITED
Aljundi, I. H. (2011). “Bromate formation during ozonation of drinking water: A response surface methodology study,” Desalination 277(1-3), 24-28. DOI: 10.1016/j.desal.2011.03.090
Bajpai, P. (2004). “Biological bleaching of chemical pulps,” Critical Reviews in Biotechnology 24(1), 1-58. DOI: 10.1080/07388550490465817
Bajpai, P., Anand, A., Sharma, N., Mishra, S. P., Bajpai, P. K., and Lachenal, D. (2006). “Enzymes improve ECF bleaching of pulp,” BioResources 1(1), 34-44. DOI: 10.15376/biores.1.1.34-44
Balakshin, M., Chen, C. L., Gratzl, J. S., Kirkman, A. G., and Jakob, H. (2001). “Biobleaching of pulp with dioxygen in laccase-mediator system – Effect of variables on the reaction kinetics,” Journal of Molecular Catalysis B-Enzymatic 16(3-4), 205-215. DOI: 10.1016/s1381-1177(01)00062-5
Baker, P.W., Charlton, A., and Hale, M.D. (2015). “Increased delignification by white rot fungi after pressure refining Miscanthus,” Bioresour Technol, 189, 81-86. DOI: 10.1016/j.biortech.2015.03.056
Beg, Q. K., Sahai, V., and Gupta, R. (2003). “Statistical media optimization and alkaline protease production from Bacillus mojavensis in a bioreactor,” Process Biochemistry 39(2), 203-209. DOI: 10.1016/s0032-9592(03)00064-5
Bourbonnais, R., Paice, M. G., Reid, I. D., Lanthier, P., and Yaguchi, M. (1995). “Lignin oxidation by laccase isozymes from Trametes versicolor and role of the mediator 2,2′-azinobis(3-ethylbenzthiazoline-6-sulfonate) in kraft lignin depolymerization,” Applied and Environmental Microbiology 61(5), 1876-80.
Box, G. P., and Draper, N. R. (1987). “Emperical Model-building and Response Surfaces,” John Wiley, New York.
Euring, M., Ruhl, M., Ritter, N., Kues, U., and Kharazipour, A. (2011). “Laccase mediator systems for eco-friendly production of medium-density fiberboard (MDF) on a pilot scale: Physicochemical analysis of the reaction mechanism,” Biotechnology Journal 6(10), 1253-1261. DOI: 10.1002/biot.201100119
Fillat, U., and Roncero, M. B. (2009). “Biobleaching of high quality pulps with laccase mediator system: Influence of treatment time and oxygen supply,” Biochemical Engineering Journal 44(2-3), 193-198. DOI: 10.1016/j.bej.2008.12.002
Fillat, U., and Roncero, M. B. (2010). “Optimization of laccase-mediator system in producing biobleached flax pulp,” Bioresource Technology 101(1), 181-187. DOI: 10.1016/j.biortech.2009.07.020
Fu, S., Zhan, H., and Yu, H. (2000). “Preliminary study on biobleaching of Eucalyptus urophylla kraft pulp with laccase-mediator system,” China Pulp and Paper 19(2), 8-15.
Goncalves, I., Herrero-Yniesta, V., Arce, I. P., Castaneda, M. E., Cavaco-Paulo, A., and Silva, C. (2014). “Ultrasonic pilot-scale reactor for enzymatic bleaching of cotton fabrics,” Ultrasonics Sonochemistry 21(4), 1535-1543. DOI: 10.1016/j.ultsonch.2014.02.009
Kalil, S. J., Maugeri, F., and Rodrigues, M. I. (2000). “Response surface analysis and simulation as a tool for bioprocess design and optimization,” Process Biochemistry 35(6), 539-550. DOI: 10.1016/s0032-9592(99)00101-6
Knezevic, A., Milovanovic, I., Stajic, M., Loncar, N., Brceski, I., Vukojevic, J., and Cilerdzic, J. (2013a). “Lignin degradation by selected fungal species,” Bioresource Technology 138, 117-123. DOI: 10.1016/j.biortech.2013.03.182
Knezevic, A., Milovanovic, I., Stajic, M., and Vukojevic, J. (2013b). “Potential of Trametes species to degrade lignin,” International Biodeterioration & Biodegradation 85, 52-56. DOI: 10.1016/j.ibiod.2013.06.017
Li, J., He, S., Li, Z., Xu, J., and Mo, L. (2014). “Comparison of ECF short-sequence bleaching processes for bagasse pulp,” Journal of South China University of Technology Natural Science Edition 42(2), 14-20.
Martin-Sampedro, R., Miranda, J., Garcia-Fuentevilla, L., Hernandez, M., Arias, M. E., Diaz, M. J., and Eugenio, M. E. (2015). “Influence of process variables on the properties of laccase biobleached pulps,” Bioprocess and Biosystems Engineering 38(1), 113-123. DOI: 10.1007/s00449-014-1249-7
Mo, J. L., Fu, S. Y., and Zhan, H. Y. (2006). “Improving laccase activity of Panus conchatus by mutagenesis and used for biobleaching,” Transactions of China Pulp and Paper 21(4), 29-33.
Nie, S. X., Wu, Z. M., Liu, J. C., Liu, X. L., Qin, C. R., Song, H. N., and Wang, S. F. (2013). “Optimization of AOX formation during the first chlorine dioxide bleaching stage (D-0) of soda AQ bagasse pulp,” Appita Journal 66(4), 306-312.
Nie, S. X., Liu, X. L., Wu, Z. M., Zhan, L., Yin, G. D., Yao, S. Q., Song, H. N., and Wang, S. F. (2014a). “Kinetics study of oxidation of the lignin model compounds by chlorine dioxide,” Chemical Engineering Journal 241, 410-417. DOI: 10.1016/j.cej.2013.10.068
Nie, S. X., Yao, S. Q., Qin, C. R., Li, K. C., Liu, X. L., Wang, L. J., Song, X. P., and Wang, S. F. (2014b). “Kinetics of AOX formation in chlorine dioxide bleaching of bagasse pulp,” BioResources 9(3), 5604-5614. DOI: 10.15376/biores.9.3.5604-5614
Qiu, W. H., and Chen, H. Z. (2012). “Enhanced the enzymatic hydrolysis efficiency of wheat straw after combined steam explosion and laccase pretreatment,” Bioresource Technology 118, 8-12. DOI: 10.1016/j.biortech.2012.05.033
Quintana, E., Valls, C., Barneto, A. G., Vidal, T., Ariza, J., and Roncero, M. B. (2015). “Studying the effects of laccase treatment in a softwood dissolving pulp: Cellulose reactivity and crystallinity,” Carbohydrate Polymers 119, 53-61. DOI: 10.1016/j.carbpol.2014.11.019
Ravalason, H., Bertaud, F., Herpoel-Gimbert, I., Meyer, V., Ruel, K., Joseleau, J. P., Grisel, S., Olive, C., Sigoillot, J. C., and Petit-Conil, M. (2012). “Laccase/HBT and laccase-CBM/HBT treatment of softwood kraft pulp: Impact on pulp bleachability and physical properties,” Bioresource Technology 121, 68-75. DOI: 10.1016/j.biortech.2012.06.077
Savant, D. V., Abdul-Rahman, R., and Ranade, D. R. (2006). “Anaerobic degradation of adsorbable organic halides (AOX) from pulp and paper industry wastewater,” Bioresource Technology 97(9), 1092-1104. DOI: 10.1016/j.biortech.2004.12.013
Sharma, A., Thakur, V. V., Shrivastava, A., Jain, R. K., Mathur, R. M., Gupta, R., and Kuhad, R. C. (2014). “Xylanase and laccase based enzymatic kraft pulp bleaching reduces adsorbable organic halogen (AOX) in bleach effluents: A pilot scale study,” Bioresource Technology 169, 96-102. DOI: 10.1016/j.biortech.2014.06.066
Shukla, P., Bajwa, U., and Sharma, S. (2014). “Optimization of the level of ingredients for functional dairy beverage using response surface methodology (RSM),” Acta Alimentaria 43(3), 402-411. DOI: 10.1556/AAlim.43.2014.3.6
Singh, G., Capalash, N., Goel, R., and Sharma, P. (2007). “A pH-stable laccase from alkali-tolerant gamma-proteobacterium JB: Purification, characterization and indigo carmine degradation,” Enzyme and Microbial Technology 41(6-7), 794-799. DOI: 10.1016/j.enzmictec.2007.07.001
Singh, G., Ahuja, N., Batish, M., Capalash, N., and Sharma, P. (2008). “Biobleaching of wheat straw-rich soda pulp with alkalophilic laccase from gamma-proteobacterium JB: Optimization of process parameters using response surface methodology,” Bioresource Technology 99(16), 7472-7479. DOI: 10.1016/j.biortech.2008.02.023
TAPPI T236 om-99 (2004). “Kappa number of pulp,” TAPPI Press, Atlanta, GA.
TAPPI T452 om-02 (2004). “Brightness of pulp, paper and paperboard (Directional Reflectance at 457 nm),” TAPPI Press, Atlanta, GA.
Thakur, V.V., Jain, R.K., and Mathur, R.M. (2012). “Studies on xylanase and laccase enzymatic prebleaching to reduce chlorine-based chemicals during ceh and ecf bleaching,” BioResources 7(2), 2220-2235.
Trawczynska, I., and Wojcik, M. (2015). “Optimization of permeabilization process of yeast cells for catalase activity using response surface methodology,” Biotechnology & Biotechnological Equipment 29(1), 72-77. DOI: 10.1080/13102818.2014.934986
Trinh, T. K., and Kang, L. S. (2011). “Response surface methodological approach to optimize the coagulation-flocculation process in drinking water treatment,” Chemical Engineering Research & Design 89(7A), 1126-1135. DOI: 10.1016/j.cherd.2010.12.004
Zhang, C., Chen, J. N., and Wen, Z. G. (2012). “Alternative policy assessment for water pollution control in China’s pulp and paper industry,” Resources Conservation and Recycling 66, 15-26. DOI: 10.1016/j.resconrec.2012.06.004
Article submitted: July 1, 2015; Peer review completed: October 13, 2015; Revised version received: November 3, 2015; Accepted: November 4, 2015; Published: November 25, 2015.
DOI: 10.15376/biores.11.1.696-712