
Abstract
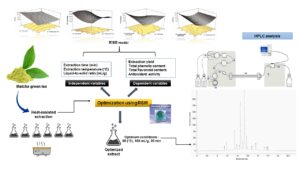
Response surface methodology (RSM) was employed to optimize the extraction conditions of phenolic and antioxidant compounds from matcha green tea (Camellia sinensis) using central composite design (CCD). The desirability function was used to find the optimum extraction conditions. The highest polyphenol and antioxidant content yield were reached at a temperature of 80 °C, an extraction time of 20 min, a liquid-to-solid ratio of 100 mL/g, and a desirability value of 0.948. The experimental values for total phenolics under the optimum extraction conditions were 317.62 ± 3.45 mg GAE/g and 29.21 ± 0.38 mg RE/g for the total flavonoids. The antioxidant activity (AA) was evaluated using 2,2 diphenyl-1-picrylhydrazyl (DPPH) and 2,2-azinobis(3-ethylbenzothiazoline-6-sulfonic acid) (ABTS), which showed radical scavenging activities at 88.28 ± 0.14% and 90.02 ± 0.14%, respectively. The high performance liquid chromatography (HPLC) analysis at the optimum condition revealed 14 compounds. Among the analyzed compounds, matcha green tea extract (MGTE) had the highest content of epigallocatechin gallate (EGCG) with 95.48 mg/g, followed by epicatechin gallate (ECG) at 74.48 mg/g, and catechin at 28.94 mg/g. The results suggested that the optimized parameters of heat-assisted extraction provide an ideal green extraction method for the extraction of the high polyphenol and antioxidant content in matcha green tea.
Download PDF
Full Article
Optimized Green Extraction Conditions of Matcha Green Tea (Camellia sinensis) Using Central Composite Design for Maximal Polyphenol and Antioxidant Contents
Nor Hafiza Sayuti,a Ammar Akram Kamarudin,a Norazalina Saad,b Nor Asma Ab. Razak,a and Norhaizan Mohd Esa a,c,*
Response surface methodology (RSM) was employed to optimize the extraction conditions of phenolic and antioxidant compounds from matcha green tea (Camellia sinensis) using central composite design (CCD). The desirability function was used to find the optimum extraction conditions. The highest polyphenol and antioxidant content yield were reached at a temperature of 80 °C, an extraction time of 20 min, a liquid-to-solid ratio of 100 mL/g, and a desirability value of 0.948. The experimental values for total phenolics under the optimum extraction conditions were 317.62 ± 3.45 mg GAE/g and 29.21 ± 0.38 mg RE/g for the total flavonoids. The antioxidant activity (AA) was evaluated using 2,2 diphenyl-1-picrylhydrazyl (DPPH) and 2,2-azinobis(3-ethylbenzothiazoline-6-sulfonic acid) (ABTS), which showed radical scavenging activities at 88.28 ± 0.14% and 90.02 ± 0.14%, respectively. The high performance liquid chromatography (HPLC) analysis at the optimum condition revealed 14 compounds. Among the analyzed compounds, matcha green tea extract (MGTE) had the highest content of epigallocatechin gallate (EGCG) with 95.48 mg/g, followed by epicatechin gallate (ECG) at 74.48 mg/g, and catechin at 28.94 mg/g. The results suggested that the optimized parameters of heat-assisted extraction provide an ideal green extraction method for the extraction of the high polyphenol and antioxidant content in matcha green tea.
Keywords: Natural antioxidants; Polyphenols; Aqueous extraction; Camellia sinensis; Central composite design; Matcha green tea
Contact information: a: Natural Medicines and Products Research Laboratory, Institute of Bioscience, Universiti Putra Malaysia, 43400 Serdang, Selangor, Malaysia; b: UPM-MAKNA Cancer Research Laboratory, Institute of Bioscience, Universiti Putra Malaysia, 43400 Serdang, Selangor, Malaysia;
c: Department of Nutrition, Faculty of Medicine and Health Sciences, Universiti Putra Malaysia, 43400 Serdang, Selangor, Malaysia; *Corresponding author: nhaizan@upm.edu.my
GRAPHICAL ABSTRACT
INTRODUCTION
Camellia sinensis (green tea) has been studied extensively for its biological properties and food applications (Musial et al. 2020). Green tea is distributed commercially in loose, bagged, and powdered leaf form. Matcha is a fine powdered green tea made from sunlight-protected Camellia sinensis leaves. Matcha tea has gained recent attention and market demand, but not much research has been carried out on this resource (Jakubczyk et al. 2020). The natural bamboo growth provides shade for the green tea leaves for most of their growth period. This natural form of sun protection allows the green tea plants to produce massive amounts of bioactive compounds (Jakubczyk et al. 2020). As a result of its conventional method of cultivation, matcha tea is notably rich in antioxidants (Sano et al. 2018).
Polyphenolics are of significant physiological and morphological importance for plants as they can act as phytoalexins, antifeedants, contributors to plant pigmentation and reproduction, UV-light protectors, and antioxidants (Siracusa and Ruberto 2014). The polyphenolic compounds in green tea primarily contain flavonoids, flavanols, phenolic acids, and related substances. Tea polyphenols are flavonoid derivatives with a basic structure, generally known as catechins, with a-phenyl-benzopyran that is approximately 18% to 36% of the dry weight of the teas (Yan et al. 2020). Phenolic antioxidants play a significant role in shielding the human body from oxidative stress, triggered by an imbalance between the generation of reagent oxygen species and the elimination of them, and in delaying several chronic diseases (Xu et al. 2012).
A variety of techniques, such as ultrasonic extraction, supercritical fluid extraction, microwave extraction, and pressurized liquid extraction have been used to extract polyphenols from plant matrices (Ameer et al. 2017). However, the solvent extraction technique is widely used for industrial production because of its flexibility, reliability, and minimal equipment cost. The polarity of the solvents plays an important role in the selective extraction of numerous bioactive materials. Ethanol and water are the favored solvents because they are non-toxic and ecological. Water in particular is a suitable solvent in the food sector because it is environmentally sustainable and less expensive than organic solvents (Tan et al. 2014). It is important that a modern, environmentally friendly, and sustainable approach be developed to meet the demands of sustainable growth.
Sustainable extraction techniques can consume less energy and chemicals. Convential extraction techniques tend to involve more time, a high solvent cost, and a low selectivity. Response surface methodology (RSM) can be used to achieve an optimal solution by the study of individual factor level combinations. Relative to complete factorial design, RSM requires fewer experimental runs, it is more cost-effective, and more user-friendly. Therefore, RSM can minimize the number of trials and thereby decrease the cost and length of an experiment without sacrificing the reliability of the data (Ani et al. 2019). Matcha green tea is viewed as a new potential health-beneficial food ingredient for use in the functional food industry. Therefore, the aim of this study was to optimize the heat assisted extraction conditions for matcha green tea with a higher amount of polyphenols and antioxidant activity using RSM. In this study, a rapid and efficient method was developed to extract the antioxidant polyphenols from matcha green tea by heat assisted extraction, a method for which there is little published research.
EXPERIMENTAL
Raw Materials and Heat Assisted Extraction Procedure
The raw powdered matcha green tea was purchased from MRM (80015, Tokyo, Japan). The extraction was conducted using the heat assisted method. The extraction was performed according to the procedures outlined in Sayuti et al. (2020), although different parameter ranges were used. Powdered samples (1 g) of matcha green tea were extracted with deionized water at various parameters (Table 1) that were established by the Design-Expert software (Version 6.0.4; Stat Ease Inc., Minneapolis, MN). The samples were exposed to various extraction times (X1) that ranged between 6 min and 74 min, temperatures (X2) that ranged from 2 °C to 100 °C, and liquid-to-solid ratios (X3) that ranged between 6 mL/g and 124 mL/g. The extract was then filtered with Whatman No. 1 filter paper (Cytiva, Little Chafont, United Kingdom). The filtrate was classified as sample extract and concentrated at 60 °C under medium pressure using a Buchi rotary evaporator (Rotavapor R-210, Flawil, Switzerland). The crude extract was then dried at 50 °C in the oven for a maximum period of 72 h before the dry crude extract was ready for analysis. The total percentage of the yield was determined according to Eq. 1,

where x is the mass of the dry extract and y is the mass of the dry initial sample.
Determination of the Total Phenolic Content (TPC)
The total phenolic contents (TPC) were assayed using a modified version of the method described by Yusri et al. (2012). The matcha green tea extract (MGTE) (100 μL) previously prepared with 500 μL of a Folin-Ciocalteu reagent was added and mixed for 10 s. Then, 400 µL of 7.5% sodium carbonate (Na2CO3) solution was added, and the mixture was incubated at 40 °C for 1 h. After 1 h, 200 µL of the reaction mixture was loaded into a 96 wells microplate. The standard curve was constructed using gallic acid and the TPC was calculated from the standard curve, as seen in Eq. 2,

with an R2 value equal to 0.9982. The absorbance was then measured with a microplate reader (BioTek Instruments, Winooski, VT) at 765 nm. The findings were expressed as milligrams (mg) of the gallic acid equivalent (GAE)/g sample.
Determination of the Total Flavonoid Content (TFC)
The total flavonoid content (TFC) of the extract was measured by the colorimetric method as previously reported (Yusri et al. 2012) with modification. The MGTE (100 µL) was mixed with 100 µL of 10% aluminium chloride (AlCl3). The reaction mixture then was incubated for 10 min at room temperature in the dark and the absorbance was measured at 435 nm. The standard curve of rutin, as seen in Eq. 3,

had an R² value equal to 0.9918. The standard curve of rutin was used to quantify the TFC in the MGTE. The TFC was expressed in terms of mg rutin equivalent (RE)/g of sample.
Determination of the Antioxidant Activity (AA)
The 2,2-azinobis(3-ethylbenzothiazoline-6-sulfonic acid) (ABTS) radical cation inhibition antioxidant assay
The free radical scavenging activity of the extracts was examined by the 2,2-azinobis(3-ethylbenzothiazoline-6-sulfonic acid) (ABTS) radical cation inhibition assay (Re et al. 1999) with modifications. The ABTS cation radical was prepared by the reaction with 7.8 mg of ABTS in 40 mL of deionized water and 13.24 mg of potassium persulfate (K2S2O8). The solution was stored in the dark for 16 h at room temperature prior to use. The ABTS solution was then diluted with deionized water and was ready to be mixed with the extract. The reaction consumed 0.1 mL of extract in 900 mL of diluted ABTS solution, and the mixture was kept in a dark room for 1 h at room temperaute. The absorbance of themixture was measured after 1 h of incubation at 735 nm using the microplate reader. All the assays were performed in triplicate in order to obtain a precise reading of absorbance. The formula for the percentage of the ABTS scavenging activity is shown in Eq. 4,

where AB is the absorbance of the control sample and AA is the absorbance of the tested sample.
DPPH radical scavenging ability assay
The radical scavenging ability was determined according to a modified version of the procedures outlined by Ramadan et al. (2003). The DPPH solution was prepared by dissolving 4.2 mg of powdered DPPH in 50 mL of methanol. The mixture was shaken vigorously to allow the DPPH to dissolve completely. The solution was incubated for 2 h at room temperature in a dark room before it was reacted with the extract. A volume of 50 µL of extract was mixed with 195 µL of the 2,2 diphenyl-1-picrylhydrazyl (DPPH) solution in the 96 wells plate and the plate was kept in the dark for 1 h. Then, the absorbance of the solution was measured at 540 nm using the microplate reader. The percentage of inhibition was calculated according to the ABTS scavenging activity formula (Eq. 4).
Validation of the Model and the Statistical Analysis
All the responses were analyzed under the optimized conditions of the extraction (generated by the Design Expert software). The Design Expert software was also used to analyze the regression coefficient and the analysis of variance (ANOVA) for the experimental results and to estimate the optimum values and extraction conditions of three independent variables. The reliability of the fitted model was calculated based on the R2 coefficient. The differences in the means were considered statistically significant at p < 0.05.
In order to verify the validity of the model, the experimental data were statistically compared with the predicted values generated by design expert software based on the coefficient of variation (CV) and the independent t-test. The independent t-test was performed using the IBM SPSS Statistics 21 software (Armonk, NY) to determine the validity of the model and to check the significant difference between the predicted and actual experimental data.
Determination of the Green Tea Polyphenols (GTPs) using High Performance Liquid Chromatography (HPLC)
The qualitative and quantitative of the green tea polyphenols (GTPs) were performed according to a modified procedure described by Sayuti et al. (2020). An HPLC system equipped with an autosampler (Agilent Technologies, Santa Clara, CA), a C18 column (150 mm × 4.6 mm), and an ultraviolet (UV) visible detector (Agilent Technologies, Santa Clara, CA) were employed for the analyses.
A 0.5% formic acid in deionized water (v/v) solution (solvent A) and acetonitrile (solvent B) were used as the mobile phase for the gradient elution. The solvent compositions were changed according to the following gradient: 0 min, 5% B; 10 min, 35% B; 15 min, 65% B; 18 min, 5% B. The phenolic compounds were identified with the UV detector at 280 nm and the injection volume was set at 10 µL with a constant flow rate of 0.5 mL/min.
RESULTS AND DISCUSSION
Fitting the Models
The optimization of the extraction condition for the matcha green tea was generated via RSM. A central composite design (CCD) was used to analyze the relationship between the responses and the independent variables. The matrix of the CCD for the variables and the responses is shown in Table 1. The equations were obtained from a 20-batch run using the Design-Expert software. The quadratic, the reduced quadratic, and the reduced cubic model could best fit the experimental data. All the models were generated after removing the non-significant model terms with p-values < 0.05.

The regression coefficients of the dependent variables are shown in Table 2. The regression coefficient analysis showed the relationship between the response variables and one or more of the predictor variables. The sign of regression analysis coefficient shows whether there is a positive or negative correlation between each independent variable. For a positive coefficient, as the value of the independent variable increases, the mean of the independent variable also tends to increase. For a negative coefficient, as the independent variable increases, the dependent variable tends to decrease.
Overall, the linear effect for the extraction temperature (X2) was found to have a significant effect on the yield and the TFC. Meanwhile, the liquid-to-solid ratio (X3) had a high positive significant effect on the yield. However, the extraction time (X1) had an insignificant effect on all the responses. The quadratic effect of the extraction time (X12) was found to be significant only on the TFC. However, the quadratic effect of the extraction temperature (X22) produced a high positive significant effect on the ABTS and the quadratic effect of the liquid-to-solid ratio (X32) had significant negative effect on the yield and the TPC. The interaction between the extraction time and the liquid-to-solid ratio (X1X3) had a significant effect on the TFC and DPPH. Meanwhile, the interaction between the extraction temperature and the liquid-to-solid ratio (X2X3) had a significant effect with p < 0.01 on the TPC. The lack of fit for all the model terms were found to be insignificant with p > 0.05, which indicated that the models fit well and the variables had a significant effect on the responses. The three-dimensional (3D) response surface graphs for each response were generated by the Design Expert software to show the interaction between the independent variables and the responses. The relationship between extraction variables and response was visualized by the 3D response surface graphs (Fig. 1 through Fig. 5).

Effect of the Extraction Variables on the Extraction Yield
The linear effect of the extraction temperature (X2), the liquid-to-solid ratio (X3), and the quadratic effect of the liquid-to-solid ratio (X32) were significant model terms for the extraction yield. Based on the β-value, the extraction temperature (X2) and the liquid-to-solid ratio (X3) had a significant positive effect on the extraction yield, with p < 0.05 and p < 0.001, respectively. Meanwhile, the quadratic effect of the liquid-to-solid ratio (X32) showed a significant negative effect. The non-significant process variables were excluded from the model, and the coded yield equation was shown as Eq. 5,

The 3D response surface plot was generated with the fixed liquid-to-solid ratio (X3) at 65 mL/g. The yield increased as the extraction temperature increased and the extraction time decreased (X1X2), as can be seen in Fig. 1a. The temperature is a major variable in the extraction yield as the heat activation initiates the release of the phenolic compound from the plant matrices by solvent extraction (Kamarudin et al. 2020). Figure 1b demonstrates the interaction effect between the extraction time and the liquid-to-solid ratio (X1X3). At a fixed extraction temperature (X2) of 51 °C, the yield of the extract increased gradually by increasing the liquid-to-solid ratio and decreasing the extraction time (X1X3). The theory of mass transfer may describe this interaction (X1X3), in which the higher solid-to-solvent ratio contributed to a higher diffusion rate (Wong et al. 2013). Figure 1c showed the effect of the extraction temperature and the liquid-to-solid ratio (X2X3) at a fixed extraction time (X1) of 40 °C. The extraction yield increased as the extraction temperature and the liquid-to-solid ratio (X2X3) increased. The same pattern was reported by Fan et al. (2019), where the yield increased gradually as the liquid-to-solid ratio increased. In the solvent environment, a higher water content contributed to the swelling of the plant material, which increased the interaction with the plant matrix and the solvent, thus increasing the yield (Sulaiman et al. 2017). Therefore, the extraction temperature and the liquid-to-solid ratio are critical to optimize the extraction yields for the MTGE and enrich the phenolic components.

Fig. 1. The RSM model for effects of the a) the extraction temperature and the extraction time, b) liquid-to-solid ratio and the extraction time, and c) the extraction temperature and the liquid-to-solid ratio
The Effect of the Extraction Variables on the TPC
The quadratic effect of the liquid-to-solid ratio (X32) and the interaction effect between the extraction temperature and the liquid-to-solid ratio (X2X3) were significant model terms. The quadratic effect of the liquid-to-solid ratio (X32) showed a high significant negative effect on the TPC with p < 0.001. Meanwhile, the interaction between the extraction temperature and the liquid-to-solid ratio (X2X3) showed a positive significant effect on TPC with p < 0.01. The non-significant variables were removed and the coded equation for the TPC can be seen in Eq. 6,

Figure 2a shows the effect of the interaction between the extraction time and the temperature (X1X2) on the TPC. At a fixed liquid-to-solid ratio (X3) 65 mL/g sample, a high value of TPC was obtained (297.9 mg GAE/mg) as the extraction time decreased and the extraction temperature (X1X2) increased.

Fig. 2. The RSM model for the interaction effect of the extraction on the TPC. a) the extraction time and the extraction temperature, b) the extraction time and the liquid-to-solid ratio, and c) the extraction temperature and the liquid-to-solid ratio
The content of bioactive compounds in green tea will be influenced by sample preparation and extraction conditions. Komes et al. (2010) observed that catechins tend to degrade during prolonged extraction time, as well as by using higher water temperatures. Larrauri et al. (1997) reported that phenolic antioxidants exhibit significant decomposition at extraction temperatures above 60 °C. At high extraction temperature and prolonged extraction time, some desired compound will eventually degrade. Figure 2b shows as the extraction time decreased and the liquid-to-solid ratio (X1X3) increased at a fixed extraction temperature (X2) at 51 °C, the TPC gradually increased. The influence of the extraction temperature and the liquid-to-solid ratio (X2X3) on the TPC is shown in Fig. 2c. At a fixed extraction time (X1) of 40 min, as the extraction temperature and the liquid-to-solid ratio increased (X2X3), the TPC increased. The temperature is a crucial variable for the processing of the TPC since heat activation, by way of solvent extraction, initiates the diffusion of the phenolic material from the plant matrices. However, at a certain temperature level, the performance of the TPC can only be achieved through thermal lability (Roselló-Soto et al. 2019). In the present analysis, the highest amounts of TPC yielded 317.62 ± 3.45 mg GAE/g from the MGTE under the optimized extraction conditions. A higher amount of TPC was obtained compared to a study conducted by Zhao et al. (2019), which profiled the 30 tea infusions and obtained a TPC in range of 24.77 ± 2.02 to 252.65 ± 4.74 mg GAE/g dry weight. Meanwhile, Luo et al. (2020) obtained 243 ± 7 mg GAE/g dw of TPC in green tea using ultrasound-assisted extraction (UAE) and the deep eutectic solvents (DESs) approach. Furthermore, a study conducted by Koláčková et al. (2020) investigated the TPC in various type of matcha green tea and obtained a TPC value in range of 64.4 ± 1.0 to 93.9 ± 1.0 mg GAE/ for water extracts, which was lower than what was obtained in the present study. This shows that this optimization successfully yielded a higher amount of TPC in the water extract compared to previously reported studies which used different extraction techniques.
The Effect of the Extraction Variables on the TFC
The linear effect of the extraction temperature (X2), the quadratic effect of the extraction time (X12), and the interaction effect between the extraction time and the liquid-to-solid ratio (X1X3) were significant model terms. The extraction temperature (X2) and the quadratic effect of the extraction time (X12) showed a positive effect on the TFC with p < 0.05 and p < 0.01, respectively. On the other hand, the interaction effect between the extraction time and the liquid-to-solid ratio showed a negative significant effect on the TFC with p < 0.01. The non-significant variables were excluded and the coded value equation in the TPC experimental data can be seen in Eq. 7,

Figure 3a shows the interaction effect between the extraction time and the liquid-to-solid ratio (X1X3). At a fixed extraction temperature of 51 °C, as the extraction time decreased and the liquid-to-solid ratio increased, the TFC yield increased. Abu Bakar et al. (2020) and Sheng et al. (2013) reported the same pattern as the TFC steadily increased as the liquid-to-solid ratio increased. This could be because of the increase in the driving force for the mass transfer of the TFC, which led to the high TFC recorded after the analysis (Liu et al. 2010). The interaction between the extraction temperature and the liquid-to-solid ratio (X2X3) can be seen in Fig. 3b. At a fixed extraction time of 40 min, the extraction temperature decreased and the liquid-to-solid ratio (X2X3) increased, which slowly increased the TFC. Meanwhile, at a fixed liquid-to-solid ratio (65 mL/g), as the extraction time decreased and the extraction temperature increased (X1X2), the TFC gradually increased (Fig. 3c). The same pattern was reported by Tay et al. (2014), as the TFC yield decreased gradually as the extraction time increased. Long extraction times will increase the sensitivity to light and oxygen, which will eventually contribute to the phenolic oxidation of flavonoids (Tay et al. 2014).

Fig. 3. The RSM model for the interaction effect of the extraction on the TFC. a) the extraction time and the liquid-to-solid ratio, b) the extraction temperature and the liquid-to-solid ratio, and c) the extraction temperature and the extraction time
The Effect of the Extraction Variables on the AA using DPPH and ABTS
The ABTS and DPPH tests represented the AA as the proportion (%) of the inhibition. The quadratic effect of the extraction temperature (X2) on the ABTS had a positive significant effect with p < 0.01. Meanwhile, the interaction between the extraction time and the liquid-to-solid ratio (X1X3) showed a significant effect with p < 0.01 on the DPPH. The other terms did not significantly affect the ABTS and the DPPH. The coded equation after the exclusion of the non-significant factors for both the ABTS and the DPPH can be seen in Eqs. 8 and 9,

The ABTS’s interaction effect between the extraction temperature and the liquid-to-solid ratio (X2X3) and between the extraction time and the liquid-to-solid ratio (X1X3) can be seen in Figs. 4a and 4b, respectively. The ABTS was only significantly affected by the quadratic effect of the extraction temperature (X2). The interaction between the extraction time (X1), the extraction temperature (X2), and the liquid-to-solid ratio (X3) did not show any significant effect on the ABTS assay. Meanwhile, the interaction between the extraction time and the liquid-to-solid ratio (X1X3) showed a significant positive effect on the DPPH, as shown in Fig. 5a.

Fig. 4. The RSM model for the interaction effect of the extraction on the AA for the ABTS. a) the extraction temperature and the liquid-to-solid ratio and b) the extraction time and the liquid-to-solid ratio

Fig. 5. The RSM model for the interaction effect of the extraction on the AA of the DPPH. a) the extraction time and the liquid-to-solid ratio, b) the extraction temperature and the liquid-to-solid ratio, and c) the extraction temperature and the extrraction time
At a fixed extraction temperature of 51 °C, as the extraction time and the liquid-to-solid ratio increased, the AA of the DPPH slowly increased (Fig. 5a). Comparatively, Lee et al. (2013) performed an ultrasonic extraction and obtained an 82.7% AA of the DPPH of the green tea ethanol extract. The optimized MGTE in this study yielded a higher AA (90.6%). Figure 5b shows the interaction between the extraction temperature and the liquid-to-solid ratio (X2X3). At a fixed extraction time of 40 min, as the extraction temperature decreased and the liquid-to-solid ratio increased, the DPPH increased. This can be explained by the long extraction periods and high temperatures, which will result in degradations and epimerisation of catechins and lower the green tea extract AA (Lee et al. 2013). The interaction between the extraction time and the extraction temperature (X1X2) can be seen in Fig. 5c. At a fixed liquid-to-solid ratio of 65 mL/g, an increased extraction time and temperature caused the DPPH to slightly increase. The most frequently detected group of catechins, notably in green tea infusions, was the main contributor to the green tea AA (Zhao et al. 2019). Based on these results, the high antioxidant capacity of the MGTE can be attributed to the high TPC in both the ABTS and the DPPH, as shown from the findings of the TPC and TFC analyses.
Validation of the Optimal Extraction Conditions
The optimum extraction parameters were obtained by optimizing the desirability of the responses. The optimal conditions for the extraction and the response were used and subsequently validated using the above mentioned method. The validation suggested that the optimized extraction conditions for determining the yield, the TPC, the TFC, and the AA were at an extraction time of 20 min, an extraction temperature of 80 °C, an extraction volume of 100 mL/g sample, and a desirability value of 0.912. The experimental data of the optimized conditions were compared between the predicted values, as shown in Fig. 6. The experimental data of the extraction yield, the TPC, and the TFC were significantly different compared to the predicted values. Therefore, the optimized heat-assisted extraction procedure for enhancing the GTPs and the antioxidant content in MGTE had benefits of saving time and energy.

Fig. 6. The actual experimental value (optimized) versus the predicted value of MGTE for the yield, the TPC, the TFC, and the of the ABTS and the DPPH. The values are expressed as the mean ± the standard deviation (n=3). Significant differences were observed between the actual and the predicted values (*p < 0.05).
Quantification of the GTPs
The qualitative analysis for the identification of specific GTP compounds was carried out via HPLC. The peak compound identification in the extracts was achieved by comparing the HPLC retention time (RT) of the standards with those found in the chromatograms of the prepared extract. The quantification was achieved through a calibration curve with the phenolic standards, as shown in Table 4.

The peak compound identification of the MGTE was achieved by comparing the HPLC retention time of the standard with the retention time of the MGTE. Overall, 14 compounds were successfully identified and quantified from the optimized extract of the green tea (Fig. 7). Among the analyzed compounds, the MGTE had the highest content of epigallocatechin gallate (EGCG) with 95.48 mg/g, followed by epicatechin gallate (ECG) at 74.48 mg/g, and catechin at 28.94 mg/g. The amount of each identified compounds could be arranged as follows: EGCG > ECG > Catechin > Rutin > Tannic acid > Myricetin > Chlorogenic acid > Gallic acid > Epicatechin > Syringic acid > Cinnamic acid > Rosmarinic acid > Luteolin > Kaempferol. Ahmad et al. (2014) reported a similar pattern as the EGCG was the highest catechin detected in the MGTE followed by epicatechin, EGCG, and ECG after it was extracted for 20 min. Epigallocatechin gallate is the most abundant green tea catechin, so it is recognized as the main AA component in green tea (Kim et al. 2016). Different amount and type of compound present in green tea were influenced by extraction technique and conditions. Komes et al. (2010) studied the effect of multiple extractions on various green tea forms, including loose-leaf, bagged and powder. In order to obtain the first, second and third extract, Komes et al. (2010) extracted each sample three times under the same extraction conditions, 80°C for 3 min. This multiple extraction technique resulted in a lower TPC yield and TFC as the polyphenols compound was observed to degrade during the second and third extract. The practice of reusing tea samples is not an effective way of drinking since most health-promoting compounds decompose (Astill et al. 2001).

Fig. 7. The HPLC analysis for the MGTE. The detection was done at 280 nm. The numbered peaks and their corresponding authentic standards were 1: tannic acid, 2: gallic acid, 3: catechin, 4: chlorogenic acid, 5: epicatechin, 6: EGCG, 7: syringic acid, 8: ECG, 9: rutin, 10: rosmarinic acid, 11: myricetin, 12: luteolin, 13: kaempferol, and 14: cinnamic acid.
CONCLUSIONS
- The effect of the various extraction conditions (time, temperature, and the liquid-to-solid ratio) on the phenolic compounds and the antioxidant potential of the matcha green tea extract (MGTE) were examined. The best extraction conditions based on the central composite design (CCD) were observed at an extraction time of 20 min, a temperature of 80 °C, and a liquid-to-solid ratio of 100 mL/g sample.
- Taken together, these optimized conditions are promising to improve the total phenolic content (TPC) and antioxidant activity (AA) in MGTE, which can maximize the health benefits of green tea plants.
- The findings from this study found an optimized method to extract antioxidant polyphenols from MGTE, which can provide a sustainable and inexpensive approach for industrial applications.
ACKNOWLEDGMENTS
The authors are grateful for the support of the Universiti Putra Malaysia for the funding of this study (UPM/700-2/1/GPB/2017/9549900) and the Natural Medicines and Products Research Laboratory, Institute of Bioscience, Universiti Putra Malaysia for the laboratory facilities.
REFERENCES CITED
Abu Bakar, F. I., Abu Bakar, M. F., Abdullah, N., Endrini, S., and Fatmawati, S. (2020). “Optimization of extraction conditions of phytochemical compounds and anti-gout activity of Euphorbia hirta L. (ara tanah) using response surface methodology and liquid chromatography-mass spectrometry (LC-MS) analysis,” Evidence-Based Complementary and Alternative Medicine 2020, 450126. DOI: 10.1155/2020/4501261
Ahmad, R. S., Butt, M. S., Huma, N., Sultan, M. T., Arshad, M. U., Mushtaq, Z., and Saeed, F. (2014). “Quantitative and qualitative portrait of green tea catechins (GTC) through HPLC,” International Journal of Food Properties 17(7), 1626-1636. DOI: 10.1080/10942912.2012.723232
Ameer, K., Shahbaz, H. M., and Kwon, J.-H. (2017). “Green extraction methods for polyphenols from plant matrices and their byproducts: A review,” Comprehensive Reviews in Food Science and Food Safety 16(2), 295-315. DOI: 10.1111/1541-4337.12253
Ani, J. U., Okoro, U. C., Aneke, L. E., Onukwuli, O. D., Obi, I. O., Akpomie, K. G., and Ofomatah, A. C. (2019). “Application of response surface methodology for optimization of dissolved solids adsorption by activated coal,” Applied Water Science 9, 60. DOI: 10.1007/s13201-019-0943-7
Astill, C., Birch, M. R., Dacombe, C., Humphrey, P. G., and Martin, P. T. (2001). “Factors affecting the caffeine and polyphenol contents of black and green tea infusions,” Journal of Agricultural and Food Chemistry 49(11), 5340–5347. DOI: 10.1021/jf010759+
Fan, Z. L., Li, L., Bai, X. L., Zhang, H., Liu, Q. R., Zhang, H., Fu, Y. J., and Moyo, R. (2019). “Extraction optimization, antioxidant activity, and tyrosinase inhibitory capacity of polyphenols from Lonicera japonica,” Food Science and Nutrition 7(5), 1786-1794. DOI: 10.1002/fsn3.1021
Jakubczyk, K., Kochman, J., Kwiatkowska, A., Kałduńska, J., Dec, K., Kawczuga, D., and Janda, K. (2020). “Antioxidant properties and nutritional composition of matcha green tea,” Foods 9(4), 1-10. DOI: 10.3390/foods9040483
Kamarudin, A. A., Saad, N., Sayuti, N. H., Ab Razak, N. A., Mohd Esa, N. (2020). “Enhancement of phenolics and antioxidant activity via heat assisted extraction from Moringa oleifera using response surface methodology and its potential bioactive constituents,” Malaysian Journal of Medicine and Health Sciences 16(2), 83-90.
Kim, M. J., Ahn, J. H., Kim, S. B., Jo, Y. H., Liu, Q., Hwang, B. Y., and Lee, M. K. (2016). “Effect of extraction conditions of green tea on antioxidant activity and EGCG content: Optimization using response surface methodology,” Natural Product Sciences 22(4), 270-274. DOI: 10.20307/nps.2016.22.4.270
Koláčková, T., Kolofiková, K., Sytařová, I., Snopek, L., Sumczynski, D., and Orsavová, J. (2020). “Matcha tea: Analysis of nutritional composition, phenolics and antioxidant activity,” Plant Foods for Human Nutrition 75(1), 48-53. DOI: 10.1007/s11130-019-00777-z
Komes, D., Horžić, D., Belščak, A., Ganić, K. K., and Vulić, I. (2010). “Green tea preparation and its influence on the content of bioactive compounds,” Food Research International 43(1), 167-176. DOI: 10.1016/j.foodres.2009.09.022
Lee, L.-S., Lee, N., Kim, Y. H., Lee, C.-H., Hong, S. P., Jeon, Y.-W., and Kim, Y.-E. (2013). “Optimization of ultrasonic extraction of phenolic antioxidants from green tea using response surface methodology,” Molecules 18(11), 13530-13545. DOI: 10.3390/molecules181113530
Liu, W., Yu, Y., Yang, R., Wan, C., Xu, B., and Cao, S. (2010). “Optimization of total flavonoid compound extraction from Gynura medica leaf using response surface methodology and chemical composition analysis,” International Journal of Molecular Sciences 11(11), 4750-4763. DOI: 10.3390/ijms11114750
Luo, Q., Zhang, J.-R., Li, H.-B., Wu, D.-T., Geng, F., Corke, H., Wei, X.-L., and Gan, R.-Y. (2020). “Green extraction of antioxidant polyphenols from green tea (Camellia sinensis),” Antioxidants 9(9), 785. DOI: 10.3390/antiox9090785
Musial, C., Kuban-Jankowska, A., and Gorska-Ponikowska, M. (2020). “Beneficial properties of green tea catechins,” International Journal of Molecular Sciences 21(5), 1744. DOI: 10.3390/ijms21051744
Ramadan, M. F., Kroh, L. W., and Mörsel, J.-T. (2003). “Radical scavenging activity of black cumin (Nigella sativa L.), coriander (Coriandrum sativum L.), and niger (Guizotia abyssinica Cass.) crude seed oils and oil fractions,” Journal of Agricultural and Food Chemistry 51(24), 6961-6969. DOI: 10.1021/jf0346713
Re, R., Pellegrini, N., Proteggente, A., Pannala, A., Yang, M., and Rice-Evans, C. (1999). “Antioxidant activity applying an improved ABTS radical cation decolorization assay,” Free Radical Biology and Medicine 26(9-10), 1231-1237. DOI: 10.1016/S08915849(98)00315-3
Roselló-Soto, E., Martí-Quijal, F. J., Cilla, A., Munekata, P. E. S., Lorenzo, J. M., Remize, F., and Barba, F. J. (2019). “Influence of temperature, solvent and pH on the selective extraction of phenolic compounds from tiger nuts by-products: Triple-TOF-LC-MS-MS characterization,” Molecules 24(4), 797. DOI: 10.3390/molecules24040797
Sano, T., Horie, H., Matsunaga, A., and Hirono, Y. (2018). “Effect of shading intensity on morphological and color traits and on chemical components of new tea (Camellia sinensis L.) shoots under direct covering cultivation,” Journal of the Science of Food and Agriculture 98(15), 5666-5676. DOI: 10.1002/jsfa.9112
Sayuti, N. H., Kamarudin, A. A., Ab Razak, N. A., Saad, N., Pak Dek, M. S., and Esa, N. M. (2020). “Optimized aqueous extraction conditions for maximal phenolics, flavonoids and antioxidant capacity from Artocarpus heterophyllus (Jackfruit) leaves by response surface methodology (RSM),” Malaysia Journal of Medicine and Health Sciences 16(2), 135-144.
Sheng, Z.-L., Wan, P.-F., Dong, C.-L., and Li, Y.-H. (2013). “Optimization of total flavonoids content extracted from Flos Populi using response surface methodology,” Industrial Crops and Products 43, 778-786. DOI: 10.1016/j.indcrop.2012.08.020
Siracusa, L., and Ruberto, G. (2014). “Plant polyphenol profiles as a tool for traceability and valuable support to biodiversity,” Polyphenols in Plants: Isolation, Purification and Extract Preparation 1(1), 15-33. DOI: 10.1016/B978-0-12-397934-6.00002-4
Sulaiman, I. S. C., Basri, M., Masoumi, H. R. F., Chee, W. J., Ashari, S. E., and Ismail, M. (2017). “Effects of temperature, time, and solvent ratio on the extraction of phenolic compounds and the anti-radical activity of Clinacanthus nutans Lindau leaves by response surface methodology,” Chemistry Central Journal 11, 54. DOI: 10.1186/s13065-017-0285-1
Tan, S. P., Stathopoulos, C., Parks, S., and Roach, P. (2014). “An optimised aqueous extract of phenolic compounds from bitter melon with high antioxidant capacity,” Antioxidants 3(4), 814-829. DOI: 10.3390/antiox3040814
Tay, P. Y., Tan, C. P., Abas, F., Yim, H. S., and Ho, C. W. (2014). “Assessment of extraction parameters on antioxidant capacity, polyphenol content, epigallocatechin gallate (EGCG), epicatechin gallate (ECG) and iriflophenone 3-C-β-glucoside of agarwood (Aquilaria crassna) young leaves,” Molecules 19(8), 12304-12319. DOI: 10.3390/molecules190812304
Wong, B. Y., Tan, C. P., and Ho, C. W. (2013). “Effect of solid-to-solvent ratio on phenolic content and antioxidant capacities of Dukung Anak (Phyllanthus niruri),” International Food Research Journal 20(1), 325-330.
Xu, P., Bao, J., Gao, J., Zhou, T., and Wang, Y. (2012). “Optimization of extraction of phenolic antioxidants from tea (Camellia sinensis L.) fruit peel biomass using response surface methodology,” BioResources 7(2), 2431-2443. DOI: 10.15376/biores.7.2.2431-2443
Yan, Z., Zhong, Y., Duan, Y., Chen, Q., and Li, F. (2020). “Antioxidant mechanism of tea polyphenols and its impact on health benefits,” Animal Nutrition 6(2), 115-123 DOI: 10.1016/j.aninu.2020.01.001
Yusri, N. M., Chan, K. W., Iqbal, S., and Ismail, M. (2012). “Phenolic content and antioxidant activity of Hibiscus cannabinus L. seed extracts after sequential solvent extraction,” Molecules 17(11), 12612-12621. DOI: 10.3390/molecules171112612
Zhao, C.-N., Tang, G.-Y., Cao, S.-Y., Xu, X.-Y., Gan, R.-Y., Liu, Q., Mao, Q.-Q., Shang, A., and Li, H.-B. (2019). “Phenolic profiles and antioxidant activities of 30 tea infusions from green, black, oolong, white, yellow and dark teas,” Antioxidants 8(7), 215. DOI: 10.3390/antiox8070215
Article submitted: November 24, 2020; Peer review completed: January 31, 2021; Revised version received and accepted: March 4, 2021; Published: March 15, 2021.
DOI: 10.15376/biores.16.2.3255-3271