
Abstract
Three types of phenolic acids (caffeic, ferulic, and chlorogenic acid) were identified and quantified in two halophytic plants (Salicornia bigelovii and Salicornia sinus-persica). Analysis was performed using a high-performance liquid chromatography-tandem mass spectrometry (HPLC-MS/MS) system via the standard addition method. The matrix effect (ME), recovery efficiency (RE), and process efficiency (PE) parameters were evaluated for S. bigelovii extracts, which revealed a strong ME on the ionization of the three acids. The matrix had little to no effect on the extraction step for all samples. The quantitation results revealed that S. bigelovii was more abundant in the acids analyzed (total of 319.2 µg/g dry water extract) when compared to S. sinus-persica (117.2 µg/g dry water extract), and chlorogenic acid was the dominant component. The extractives content was high in both plants, representing over 35% of the dry plant weight. All the extracts exhibited antioxidant activity toward both DPPH and ABTS radicals at levels comparable to other medicinal plants.
Download PDF
Full Article
Optimizing Methods to Characterize Caffeic, Ferulic, and Chlorogenic Acids in Salicornia sinus-persica and Salicornia bigelovii Extracts by Tandem Mass Spectrometry (LC-MS/MS)
Iwona Cybulska,a,* Joanna Zembrzuska,b Grzegorz Brudecki,c,e and Mette Hedegaard Thomsen d
Three types of phenolic acids (caffeic, ferulic, and chlorogenic acid) were identified and quantified in two halophytic plants (Salicornia bigelovii and Salicornia sinus-persica). Analysis was performed using a high-performance liquid chromatography-tandem mass spectrometry (HPLC-MS/MS) system via the standard addition method. The matrix effect (ME), recovery efficiency (RE), and process efficiency (PE) parameters were evaluated for S. bigelovii extracts, which revealed a strong ME on the ionization of the three acids. The matrix had little to no effect on the extraction step for all samples. The quantitation results revealed that S. bigelovii was more abundant in the acids analyzed (total of 319.2 µg/g dry water extract) when compared to S. sinus-persica (117.2 µg/g dry water extract), and chlorogenic acid was the dominant component. The extractives content was high in both plants, representing over 35% of the dry plant weight. All the extracts exhibited antioxidant activity toward both DPPH and ABTS radicals at levels comparable to other medicinal plants.
Keywords: Salicornia; Phytochemicals; Halophytes; Phenolic acids; Antioxidants; Matrix effect
Contact information: a: Faculty of Bioscience Engineering, Université catholique de Louvain, Croix du Sud, 2 bte L7.05.01 B-1348 Louvain-la-Neuve, Belgium, b: Institute of Chemistry and Technical Electrochemistry, Poznan University of Technology, Chemical Technology Faculty, ul. Berdychowo 4, 60-965 Poznan, Poland, c: Khalifa University, P.O. Box 127788, Abu Dhabi, United Arab Emirates, d: Department of Energy Technology, Aalborg University, Niels Bohrsvej 8, DK-6700 Esbjerg, Denmark; e: Group 42 (Healthcare), Capital Gate, Al Khaleej Al Arabi Street Abu Dhabi, United Arab Emirates.
* Corresponding author: iwona.cybulska@uclouvain.be
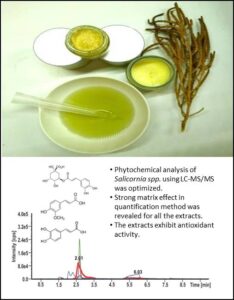
GRAPHICAL ABSTRACT
INTRODUCTION
Halophyte species appear to represent a valuable source of phytochemicals with demonstrated medicinal relevance. Some of the reported effects include the prevention of cardiovascular diseases, as well as anti-inflammatory, anti-carcinogenic, antioxidant, anti-microbial, anti-viral, anti-fungal, and anti-diabetic properties (Arakawa et al. 1982; Taha and Alsayed 2000; Bandaranayake 2002; Radwan and Shams 2007; Akbar and Al-Yahya 2011; Hamed et al. 2011; Al-Azzawi et al. 2012; Custódio et al. 2012; Oueslati et al. 2012; Yin et al. 2012; Abdou et al. 2013). Furthermore, valuable components that are used in the cosmetic and food industries have been identified, e.g., lauric acid and aromatic compounds from the bark of grey mangrove tree (Avicennia marina) (Zhu et al. 2009) and different terpenoids from essential oils of Sesuvium portulacastrum and Salsola annua, which are known as effective antiseptic compounds (Filipowicz et al. 2003; Magwa et al. 2006; Abdou et al. 2013). Several of the halophytes are edible and contain important free radical scavenging anti-inflammatory compounds, such as Suaeda vermiculata, which indicate their possible use in nutraceuticals (Oueslati et al. 2012). Similarly, sea lavender (Limonium algarvense Erben), have been reported to exhibit antioxidant, antiinflammatory, antidiabetic and neuroprotective properties, which are dependent on the cultivation conditions (Rodrigues et al. 2020). There have been several new halophyte species described recently in the Gulf region, including in the United Arab Emirates. However, as of now, there are no studies on the phytochemical content of these species (Beier et al. 2003). Phytochemicals have been found in closely related species, indicating that these new species may also be a source of useful compounds.
Salicornia spp. has been found to contain extremely valuable extractives, which have potential use as powerful antioxidants and cardiovascular medicines. One of the active components found in Salicornia herbacea is 3-caffeoyl-4-dihydrocaffeoyl quinic acid (tungtungmadic acid), which is a derivative of chlorogenic acid (an ester of caffeic and quinic acid). Chung et al. (2005) found that tungtungmadic acid has antioxidant properties in scavenging free radicals and protecting plasmid DNA from strand breakage by hydroxyl radicals. Chlorogenic acid, which is abundant in many plants and in Salicornia spp., is considered a powerful antioxidant. As a powerful antioxidant, chlorogenic acid has stronger activity than compounds such as ascorbic acid, and alfa-tocopherol (Kweon et al. 2001). Additionally, it has a protective effect over rat cardiomyocytes, suggesting its application in preventing cardiovascular disease (Bonita et al. 2007). Similar properties were observed for the entire family of hydroxycinnamic acids that can be extracted from Salicornia spp., including caffeic, coumaric, and ferulic acids (Medina et al. 2007). Caffeic, quinic, and chlorogenic acids (and their derivatives) were recently discovered to possess antiviral properties. Successful trials have been performed on their use as active components in antiviral drugs (e.g. human immunodeficiency virus type 1 and hepatitis B virus) (King et al. 1999). Ferulic acid is a potent antioxidant that is claimed to have a therapeutic effect on neurodegenerative disorders caused by oxidative stress (Kanski et al. 2002). Along with caffeic acid, ferulic acid was found to possess photoprotective properties against ultraviolet B (UVB) radiation and thus is capable of reducing photo-induced skin damage (Saija et al. 2000). In addition to medicinal applications, hydroxycinnamic acids can also be used as preservatives in fresh meat and fish storage (Medina et al. 2007). Newest research confirms that plant phenolics (including cinnamic acids) have anticancer potential, tested in both in vitro and in vivo trials (Abotaleb et al. 2020)
There are no known studies on the characterization of the extractives composition of these species, although the genus Salicornia has been researched previously (Lee et al. 2004; Ha et al. 2006; Kong et al. 2009).
Preliminary screening of various halophytic extracts based on the methodology described in literature (Tram et al. 2002; Lisko et al. 2013) have directed the attention of this study towards the three phenolic acids: caffeic, ferulic and chlorogenic. Alkaloids have been analyzed by gas chromatography (GC) with a triple quadrupole mass spectrometry (MS) detector using a HP1-MS capillary column or a DB-1701 capillary column with helium as a carrier gas; however, the results were inconclusive, and further analysis was warranted using more powerful technique – liquid chromatography-mass spectrometry (LC-MS) (Łuczkiewicz et al. 2004). The LC-MS technique has been reported as an excellent tool to detect hydroxycinnamic acids in various plant extracts using different methods. One or more of the three acids (caffeic, ferulic, and chlorogenic) have been previously analyzed in extracts from plants such as Inula britannica L., Ilex paraquariensis St. Hil., Prunus domestica, and Coffea spp. (Waldron et al. 1996; Fang et al. 2002;Bravo et al. 2007; Shi et al. 2013; Suárez-Quiroz et al. 2014); however there have been no known studies on the optimization of the analytical methodology, taking into account the matrix effect.
EXPERIMENTAL
Plant Material
Salicornia bigelovii and Salicornia sinus-persica were the two halophyte plants examined in this study for their active phytochemicals content. Both plants were locally collected. S. bigelovii seeds were provided to Masdar Institute by International Center for Biosaline Agriculture (ICBA), Dubai as a part of the Masdar Institute Integrated Seawater Energy Agricultural System (ISEAS) project. The plant was cultivated using 40 ppt NaCl water salinity. S. bigelovii was cultivated on a local site, while S. sinus-persica was a wild-growing strain collected on 8 July 2014 from a coastal site in the Western region of Abu Dhabi. This region (also known as the Al Dhafra Region or Al Gharbia in Arabic) is located between the areas of Al Hamra and Al Ruwais. The specimens were air-dried, milled using a laboratory scale knife mill (MF 10 basic; IKA, Wilmington, USA), and passed through a 1 mm screen.

Fig. 1. Photos of the Salicornia plant collected (wild growing – on the right, dried – on the left)
Reagents
The reference standards of chlorogenic acid ( 95%), ferulic acid ( 98%), and caffeic acid ( 98%) were purchased from Sigma-Aldrich (St. Louis, USA). Ammonium acetate ( 99.9%), which was used as a mobile phase additive, and MS-grade acetonitrile and methanol were purchased from Sigma-Aldrich (St. Louis, USA). Water was purified in a Demiwa system (Watek, Gaithersburg, USA) by reverse osmosis and double distillation using a quartz apparatus.
Extraction
The extractions for this study were performed using these two solvents. The dry and milled samples were extracted in a Soxhlet apparatus for 12 h per solvent (2 to 3 reflux cycles per h for water and 5 to 6 reflux cycles per h for ethanol). After the extraction, the extracts were transferred to ceramic evaporation basins and dried in a vacuum oven at 40 °C. In order to test the extraction efficiency and to determine the matrix effect (ME) on the analyte detection, standards of the three acids (ferulic, caffeic, and chlorogenic acids) were added in varying concentrations in two modes: 1) to the dry plant prior to extraction and 2) to the extract prior to the drying. Each extraction was performed in a triplicate. This was performed only for the S. bigelovii samples.
Quantitation of Caffeic (CA), Chlorogenic (CHA) and Ferulic (FA) Acids
High-performance liquid chromatography-tandem mass spectrometry (HPLC-MS/MS) operating conditions
The quantitative determination of caffeic, chlorogenic, and ferulic acid was performed using an UltiMate 3000 RSLC chromatographic system (Dionex, Sunnyvale, USA). A 150 mm × 2.0 mm I.D. analytical column (Luna 3µm C18; Phenomenex, Torrance, USA) was injected with 5 µL samples. The column was maintained at 35 °C, and the mobile phase was 5 mM ammonium acetate in water (A) and acetonitrile (B), at a flow rate of 0.2 mL/min. The following gradient was used: 0 min 10% B, 2.5 min 10% B, 2.51 min 100% B, 5 min 100% B, 5.1 min 10% B, 8 min 10% B, 8.5 min 100% B, and 10 min 100% B. The LC system was connected to an API 4000 QTRAP triple quadrupole mass spectrometer (Sciex, Foster City, USA). The Turbo Ion Spray source operated in the negative ion mode. The dwell time for the mass transition detected in the MS/MS multiple reaction monitoring mode (MRM) was set at 100 ms. All the acids were detected using the following settings for the ion source and the mass spectrometer: curtain gas 10 psi, nebulizer gas 40 psi, auxiliary gas 40 psi, temperature 400 °C, ion spray voltage -4500 V, and collision gas set to medium. In all the experiments, the [M-H]- complexes of the three acids were used as the precursor ions.
Quantitative analysis of the compounds was performed in multiple reaction monitoring (MRM) mode. For analytes, deprotonated molecular ion and their respective two product ions were chosen. The first MRM transition (precursor ion m/z → product ion m/z) was used to quantitate, the second was used as confirmation. These transitions (m/z) with associated declustering potentials (V) and collision energies (V) were: chlorogenic acid: 1) 353 → 191, -65, -24; 2) 353 → 85, -65, -64; ferulic acid: 1) 193 → 134, -55, -20; 2) 193 → 178, -55, -18; and caffeic acid 1) 179 → 135, -51, -22; 2) 179 → 106, -51, -32.
The three acids were first quantified in the original water and ethanol extracts using the standard addition method. Dry extracts were dissolved in the water with the use of an ultrasound bath. The volume of the obtained sample for analysis was adjusted based on the detection limits, and therefore varied for different samples.
Three levels of standard concentration for each acid were added to three separate samples to create a calibration curve. The standard solutions were prepared as follows: 0.60 g/L of caffeic acid in methanol, 0.66 g/L of ferulic acid in acetonitrile, and 1.18 g/L of chlorogenic acid in acetonitrile. For S. bigelovii, the amounts of standards were as follows (regardless of the acid analyzed): 0.05 µg/mL, 0.1 µg/mL, and 0.2 µg/mL. However, due to the large differences in the acid contents in the S. sinus-persica extracts, the amount of standard additions varied. The chlorogenic and ferulic acids were added at 0.05, 0.1, and 0.2 µg/mL, while caffeic acid was added at 0.01 µg/mL, 0.05 µg/mL, and 0.1 µg/mL to the water extracts. For the ethanol extracts, chlorogenic acid was added at 0.02 µg/mL, 0.05 µg/mL, and 0.1 µg/mL, ferulic acid was added at 0.05 µg/mL, 0.1 µg/mL, and 0.2 µg/mL, and caffeic acid was added at 0.005 µg/mL, 0.01 µg/mL, and 0.05 µg/mL. The resulting samples were filtered through 0.22 µm PTFE syringe filters prior to analysis. The contents of the acids in the extracts and in the original plant were determined using the regression equations of the calibration curves.
Method validation
The linearity of the calibration was checked by analyzing mixtures of the standards (caffeic, chlorogenic, and ferulic acid) at different concentrations ranging from 0.000125 μg/mL to 1 μg/mL. The limits of detection (LODs), defined as the concentrations that yielded signal-to-noise (S/N) ratios greater than or equal to 3, and the limits of quantitation (LOQs), defined as the concentrations that yielded S/N ratios greater than or equal to 10, were determined.
An important element of the uncertainty evaluation was eliminating the variability of all the other parameters (e.g. the quality of reagents, the standards, and the quality of the measuring instruments). A noticeable source of uncertainty can be represented by the preparation of excipients or matrix effects of the sample.
The expanded uncertainty was calculated with Eq. 1 (Debska et al. 2005),
 (1)
(1)
where U is the expanded uncertainty, U(calibration) is the uncertainty of the calibration step, is the relative standard deviation of the results, and n is the number of independent determinations. The expanded uncertainty was calculated for two concentration levels: 0.01 µg/mL and 0.5 µg/mL.
Evaluation of the ME, recovery efficiency (RE), and process efficiency (PE) for S. bigelovii
The presence of other components in the matrix carrying the analyte can influence the analyte detection and quantification. Therefore, the ME factor can be evaluated to account for those interferences with Eq. 2 (Matuszewski et al. 2003; Zając et al. 2014; Zembrzuska et al. 2014),
 (2)
(2)
where ME is the matrix effect (%), A is the peak area of the analyte in a standard solution with analyte concentration x, and B is the peak area of the analyte standard added to the extract at concentration x. A ME with a value higher than 100% indicates signal enhancing, while a value below 100% indicates signal suppressing. The matrix components have no influence on the analyte detection when the ME is exactly 100%.
The composition of the matrix can influence the analyte quantification during extraction prior to analysis. Therefore, another evaluating factor, the RE, was used with Eq. 3 (Matuszewski et al. 2003),
 (3)
(3)
where RE is the recovery efficiency (%) and C is the peak area of the analyte standard added to the sample before extraction at concentration x.
The entire quantification process efficiency (PE), including both factors, has been expressed by Matuszewski et al. (2003), as seen with Eq. 4,
 (4)
(4)
where PE is the process efficiency (%).
In order to find the three factors evaluating the matrix effect, two sets of standard additions were performed for each extract (water and ethanol). Each set consisted of three concentration levels for each acid. The first set was added to the plant prior to extraction (following the procedure described above), whereas the second set was added to the extract prior to drying. All the samples were prepared in triplicates. The standards were added in amounts corresponding to the acid content in the original extract (50%, 100%, and 150%). The standard solutions were prepared in ethanol as the solvent at the following concentrations: 0.92 g/L caffeic acid, 9.30 g/L chlorogenic acid, and 2.10 g/L ferulic acid for the water extraction and 0.09 g/L caffeic acid, 3.91 g/L chlorogenic acid, and 0.48 g/L ferulic acid for the ethanol extraction. The samples were prepared for analysis following the same protocol as the preparation of the pure extracts.
Antioxidant Assays
The antioxidant activity (AA, %) of the extracts was analyzed using two methods based on two different radicals. The first assay was performed using ABTS radical (2,2′-azino-bis(3-ethylbenzothiazoline-6-sulphonic acid), while the second was performed using DPPH radical (2,2-diphenyl-1-picryl hydrazyl).
Trolox equivalent antioxidant capacity (TEAC) assay
The TEAC assay kit was purchased from Sigma-Aldrich (St. Louis, USA). The assay was based on the formation of a ferryl myoglobin radical from metmyoglobin (obtained from an equine heart) and hydrogen peroxide, which oxidizes the ABTS to a radical cation (ABTS˙+). The ABTS radical cation is a green chromogen that absorbs visible light at 405 nm. Trolox (6-hydroxy-2,5,7,8-tetramethylchroman-2-carboxylic), a water-soluble vitamin E analog solution (1.5 mM), was used as a standard radical scavenger. The AA of the tested extracts was expressed as Trolox equivalent (µM/g dry extract). The calibration curve was prepared for concentrations of 0.015 mM, 0.045 mM, 0.105 mM, 0.210 mM, and 0.420 mM. The extract samples were tested at different concentrations to find the optimal one which kept the absorbance measurement in the calibration range and gave repeatable results (relative standard deviation < 15%). The optimal concentration for the water and ethanol extracts of both Salicornia species was 2 mg/mL.
The test solutions were prepared by mixing a 10 µL of test sample, standard or Assay Buffer (for the control), 20 µL of myoglobin solution, and 150 µL of ABTS radical solution. After 5 min of incubation at room temperature, the scavenging reaction was stopped by adding 100 µL of Stop Solution (Thermo Fischer Scientific, Waltham, USA) and immediately measured for the absorbance at 405 nm using a UV-vis spectrophotometer (Genesys 10s; Thermo Fischer Scientific, Waltham, USA). Water was used as the blank. In addition to expressing the antioxidant capacity as Trolox equivalent (TE), the AA was also calculated (as described in the following DPPH assay methodology).
DPPH assay
The second assay was performed using the DPPH radical, following a procedure described in Govindarajan et al. (2003). The methanolic solution of the DPPH changed in color, so the absorbance of the visible light (at 517 nm) and the scavenging effect of the added antioxidant was used to evaluate the AA of the extracts. Ascorbic acid in methanol was used as a standard scavenger and was tested at 2 mg/mL, 4 mg/mL, 6 mg/mL, 8 mg/mL, and 10 mg/mL. The same set of concentrations was prepared for the extracts. However, due to their limited solubility in organic solvents, the water extracts were first dissolved in water (at 100 mg/mL) and then diluted with methanol. The test solutions were prepared by mixing 2950 µL of methanol with a 50 µL test sample, standard or methanol (for the control), and adding 100 µL of 100 µM DPPH solution in methanol. The solutions were incubated at room temperature for 15 min, and then the absorbance was measured at 517 nm using the Genesys 10s UV-vis spectrophotometer. Methanol was used as the blank. The control was measured immediately after mixing.
The AA was calculated as a % ratio of the radicals scavenged by the extract (or standard) via comparison with the control, as seen with Eq. 5,
 (5)
(5)
where AA is the antioxidant activity (%), Abss is the absorbance of the sample, and Absc is the absorbance of the control.
RESULTS AND DISCUSSION
Extraction
Extractives represent a substantial part of the two plants analyzed, so attention should be paid to the possible utilization of this fraction. The extractives were quantified at the following levels: 37.79 g ± 1.23 g water extract/100g DM and 8.82 g ± 0.27 g ethanol extract/100g DM for S. sinus-persica, 47.38 g ± 0.20 g water extract/100g DM and 20.73 g ± 0.11 g ethanol extract/100g DM for S. bigelovii. The water extractives value included the extractable ash of the plant.
Quantitation of Caffeic (CA), Chlorogenic (CHA), and Ferulic (FA) Acids
Figure 1 illustrates exemplary MRM chromatograms for caffeic, chlorogenic, and ferulic acids in water extracts from S. sinus-persica.

Fig. 1. The MRM chromatograms of S. sinus-persica water extract at different levels of standard addition: a) caffeic acid, b) chlorogenic acid, and c) ferulic acid
The chromatograms were obtained without standard addition and with increasing levels of standards added. The retention times for the acids were 2.06 min for caffeic acid, 2.61 min for chlorogenic acid, and 2.68 min for ferulic acid.
The MRM chromatogram of the caffeic acid (Fig. 1a) shows multiple unidentified peaks besides the caffeic acid peak, which suggests the presence of derivatives. Identification of the unknown derivatives requires more elaborate analytical techniques, including coupling mass spectrometry with nuclear magnetic resonance (NMR). Previous research on other Salicornia species confirms the presence of various phenolic acid derivatives (Chung et al. 2005). Quantitative analysis for each of the acids was performed by plotting the responses for three levels of standard addition and finding the regression equations to fit the curves. The equations were then used to find the amount of each acid in the extracts. The results of the quantitative analysis for the caffeic, chlorogenic, and ferulic acid contents in the water and ethanol extracts for both plants (S. sinus-persica and S. bigelovii) are summarized in Table 1.

The water extracts contained higher concentrations of all three phenolic acids (in both plants), suggesting that water is a more suitable solvent than ethanol (Table 1). S. bigelovii contained a higher content of total phenolic acids (319.6 µg/g in water extract) than S. sinus-persica (117.2 µg/g in water extract). The most abundant phenolic acid detected in the water extract from S. bigelovii was chlorogenic acid (240.98 µg/g ± 9.40 µg/g), whereas the water extract from S. sinus-persica was the most abundant in ferulic acid (75.70 µg/g ± 10.77 µg/g). S. bigelovii was found to contain a phenolic acid content comparable to that of common cereal (70 µg to 90 µg phenolic acids/g) (Manach et al. 2004) coloured wheat (599 to 798 µg phenolic acids/g) (Paznocht et al. 2020), opuntia fruits (58 μg phenolic acids/g) (Oniszczuk et al. 2020) and some types of apple (333 µg to 3333 µg phenolic acids/g) (Manach et al. 2004). Despite the fact that this number is lower than in some other plants such as green coffee beans (55000 µg to 100000 µg phenolic acids/g) (Ohiokpehai 1982) or blueberry (13000 µg phenolic acids/g) (Manach et al. 2004), Salicornia species contain a combination of three acids (caffeic, ferulic, and chlorogenic), which may add to their therapeutic properties.
Method Validation
All the phenolic acids exhibited good linearity with correlation coefficients above 0.98. The LODs ranged from 0.0005 µg/mL for ferulic acid and caffeic acid to 0.0025 µg/mL for chlorogenic acid, while the LOQs ranged from 0.001 µg/mL for ferulic acid and caffeic acid to 0.005 µg/mL for chlorogenic acid.
Evaluation of the ME, RE, and PE parameters
Because both water and ethanol extracts (especially water extracts) contain many components that were not quantified in this study, the ME was evaluated to test the possibility of their interference with the signal measured. The presence of components other than analytes can cause ionization of the three acids being augmented or suppressed. S. bigelovii samples were chosen to demonstrate the ME, as they were found to have a higher phenolic acid content than S. sinus-persica. The RE and PE parameters were also determined to evaluate the matrix composition influence on the efficiency of the entire extraction and quantification process. The three parameters are presented in Table 2.
Based on the results in Table 2, it can be concluded that the ME for all the acids analyzed was smaller in the water extracts than in the ethanol extracts. The matrix enhanced the signal measured for the chlorogenic acid but mostly suppressed the signal for the caffeic and ferulic acids in the water extract. The ME for the caffeic acid suppressed the signal for two levels of standard addition (50% to 87%) but enhanced or did not alter the signal for the third and highest level of standard addition (100% to 111%). Therefore, doubling the amount of caffeic acid present in the original plant reduced or eliminated the ME on the ionization. The ferulic acid results showed a strong negative influence of the ME on the signal detection in the water extract (ME between 9% and 21%), regardless of the standard amount added. The chlorogenic acid ionization was enhanced (ME between 113% and 175%) for all the standard addition levels, increasing with higher standard amounts.
A positive effect of the matrix components was observed for the caffeic acid ionization in the ethanol extract, which enhanced the signal by approximately 100% (ME between 219% and 302%) (Table 2). Little or no ME was observed for ferulic acid detection in the ethanol extract. A strongly positive ME was observed for the ionization of chlorogenic acid in the ethanol extract, resulting in an enhanced signal, which increased proportionally to the addition of the standard (ME between 597% and 1,080%).

The extraction efficiency (expressed by recovery efficiency, RE), for both extractions of the three acids was mostly near 100%, not dropping below 62%, which shows that the process was efficient. For the water extraction, the RE decreased with an increasing amount of the standard added. The same trend was observed for caffeic and ferulic acid detection in the ethanol extract. However, the chlorogenic acid was extracted to ethanol with the highest efficiency at the highest amount of standard added (RE between 96% and 123%). The water extraction was the most efficient for ferulic acid at the lowest addition of the standard (20.94 µg/g RM, corresponding to approximately 50% of the original content of the acid in the plant). This resulted in a RE value of 120% to 127% and the least efficient for chlorogenic acid at the highest addition of the standard (278.95 µg/g RM, corresponding to approximately 150% of the original content of the acid in the plant), resulting in a RE value of 72%. The ethanol extraction was the most efficient for caffeic acid at the lowest addition of the standard (0.93 µg/g RM, corresponding to approximately 50% of the original content of the acid in the plant). This resulted in a RE value of 112% to 121% and the least efficient for ferulic acid at the highest addition of the standard (14.37 µg/g RM, corresponding to approximately 150% of the original content of the acid in the plant), resulting in a RE value of 62% to 85%.
The results show that there was a strong ME, influencing both the extraction and ionization part of the quantitation process. The ionization part (expressed by the ME parameter) was influenced to a higher extent. Therefore, the standard addition method technique chosen for quantitation was suitable, as it accounted for the ME by creating the calibration curve from standards analyzed in the original sample matrix.
Antioxidant assays
The TEAC (µmol/g) assay
As mentioned in the Materials and Methods section, the optimal concentration of the extract samples was determined to be 2 mg/mL for the absorbance measurement to be within the calibration range and to be repeatable. The results of the TEAC are presented in Table 3. The samples in the water extract are denoted as WE while samples in the ethanol extract are denoted as EE.

The S. bigelovii samples showed higher AA for both the water and ethanol extracts than the S. sinus-persica samples. The results are in the high end for all samples when compared to a variety of fruit and grain (e.g. plum, red currant, orange, kiwi, barley, or wheat) (Stratil et al. 2007), or medicinal plants (Schulz et al. 2003). The higher AA expressed by S. bigelovii was expected as this plant was found to contain higher amounts of the three phenolic acids analyzed in this study. Also, the comparable TEAC of water and ethanol extracts eliminate the limitation of the solvent choice, which can be made using other factors (such as water scarcity in the arid regions) without compromising the activity of the desired product.
DPPH assay
All the extracts were found to scavenge the DPPH radicals in the concentrations tested, increasing with the concentration of the extract (Fig. 2). At low concentrations of the extracts (2 mg/mL), the AA was close (approximately 30%) for the water extracts from both plants and the ethanol extract from S. bigelovii. As the concentrations increased, the differences between the plants also increased. This revealed higher AAs for S. bigelovii, which reached an AA of 80% for the water extract (Fig. 2). The AAs toward the DPPH radical exhibited by the extracts are similar to other medicinal plants such as Matricaria recutita or Desmodium gangeticum (Govindarajan et al. 2003; Miliauskas et al. 2004). The ABTS radical was scavenged by the S. bigelovii extracts (at 2 mg/mL) to a higher extent than the DPPH radical, as opposed to the S. sinus-persica extracts, which exhibited a higher scavenging activity towards the DPPH radical (Table 4).

Fig. 2. The AA exhibited by the water and ethanol extracts from S. sinus-persica and S. bigelovii against the DPPH radical

CONCLUSIONS
- Caffeic, ferulic, and chlorogenic acids were detected in two halophytic plants (S. bigelovii and S. sinus-persica). The identification and quantitation of the acids were performed using a tandem HPLC-MS/MS system via the standard addition method in order account for the matrix effect (ME) as the extracts are complex samples and interfere with the ionization and extraction processes.
- The samples exhibited a noticeable matrix influence on the analysis, which was confirmed by evaluating the ME, RE, and PE parameters for the S. bigelovii extracts. This revealed that there was a strong ME on the ionization of the three acids and a small ME on the extraction step. Therefore, the standard addition analysis method was determined to be suitable and necessary for the correct quantitation of the caffeic, ferulic, and chlorogenic acids.
- S. bigelovii was found to have more total phenolic acids (total of 319.2 µg/g dry water extract) than S. sinus-persica (117.2 µg/g dry water extract), and water was found to be a more efficient extraction solvent than ethanol for both plants. This result is comparable to other plants such as cereal and fruit (opuntia, apples).
- Chlorogenic acid was a dominant component of the total phenolic acids for S. bigelovii, while ferulic acid was the dominant component in S. sinus-persica.
- As expected from the quantitation of the three phenolic acids, extracts from S. bigelovii exhibited higher antioxidant activities (toward both DPPH and ABTS radicals) than the extracts from S. sinus-persica, as it contained higher amounts of the acids. The results of the AA measurements were comparable to other widely used medicinal plants and considerably higher than typical food products, such as fruits and grains.
ACKNOWLEDGMENTS
This work was funded by the Masdar Institute of Science and Technology (Masdar Institute), Abu Dhabi, UAE.
REFERENCES CITED
Abdou, A. M., Abdallah, H. M., Mohamed, M. A., Fawzy, G. A., and Abdel-Naim, A. B. (2013). “A new anti-inflammatory triterpene saponin isolated from Anabasis setifera,” Arch. Pharm. Res. 36(6), 714-722. DOI: 10.1007/s12272-013-0075-9
Abotaleb, M., Liskova, A., Kubatka, P., and Büsselberg, D. (2020). “Therapeutic potential of plant phenolic acids in the treatment of cancer,” Biomolecules 10(2), 221. DOI: 10.3390/biom10020221
Akbar, S., and Al-Yahya, M. A. (2011). “Screening of Saudi plants for phytoconstituents, pharmacological and antimicrobial properties,” Aust. J. Med. Herbalism 23(2), 76-87.
Al-Azzawi, A., Alguboori, A., Hachim, M. Y., Najat, M., Al Shaimaa, A., and Sad, M. (2012). “Preliminary phytochemical and antibacterial screening of Sesuvium portulacastrum in the United Arab Emirates,” Pharmacogn. Res. 4(4), 219-224. DOI: 10.4103/0974-8490.102269
Arakawa, Y., Asada, Y.-z., Ishida, H., Chiji, H., and Izawa, M. (1982). “Structures of new two isoflavones and one flavanone from glasswort (Salicornia europaea L.),” Journal of the Faculty of Agriculture, Hokkaido University 61(1), 1-12.
Bandaranayake, W. M. (2002). “Bioactivities, bioactive compounds and chemical constituents of mangrove plants,” Wetl. Ecol. Manag. 10(6), 421-452. DOI: 10.1023/A:1021397624349
Beier, B.-A., Chase, M. W., and Thulin, M. (2003). “Phylogenetic relationships and taxonomy of subfamily Zygophylloideae (Zygophyllaceae) based on molecular and morphological data,” Plant Syst. Evol. 240(1-4), 11-39. DOI: 10.1007/s00606-003-0007-0
Bonita, J. S., Mandarano, M., Shuta, D., and Vinson, J. (2007). “Coffee and cardiovascular disease: In vitro, cellular, animal, and human studies,” Pharmacol. Res. 55(3), 187-198. DOI: 10.1016/j.phrs.2007.01.006
Bravo, L., Goya, L., and Lecumberri, E. (2007). “LC/MS characterization of phenolic constituents of mate (Ilex paraguariensis, St. Hil.) and its antioxidant activity compared to commonly consumed beverages,” Food Res. Int. 40(3), 393-405. DOI: 10.1016/j.foodres.2006.10.016
Chung, Y. C., Chun, H. K., Yang, J. Y., Kim, J. Y., Han, E. H., Kho, Y. H., and Jeong, H. G. (2005). “Tungtungmadic acid, a novel antioxidant, from Salicornia herbacea,” Arch. Pharm. Res. 28(10), 1122-1126. DOI: 10.1007/BF02972972
Custódio, L., Ferreira, A. C., Pereira, H., Silvestre, L., Vizetto-Duarte, C., Barreira, L., Rauter, A. P., Alberício, F., and Varela, J. (2012). “The marine halophytes Carpobrotus edulis L. and Arthrocnemum macrostachyum L. are potential sources of nutritionally important PUFAs and metabolites with antioxidant, metal chelating and anticholinesterase inhibitory activities,” Bot. Mar. 55(3), 281-288. DOI: 10.1515/bot-2012-0098
Debska, J., Kot-Wasik, A., and Namiesnik, J. (2005). “Determination of nonsteroidal antiinflammatory drugs in water samples using liquid chromatography coupled with diode‐array detector and mass spectrometry,” J. Sep. Sci. 28(17), 2419-2426. DOI: 10.1002/jssc.200400055
Fang, N., Yu, S., and Prior, R. L. (2002). “LC/MS/MS characterization of phenolic constituents in dried plums,” J. Agr. Food Chem. 50(12), 3579-3585. DOI: 10.1021/jf0201327
Filipowicz, N., Kamiński, M., Kurlenda, J., Asztemborska, M., and Ochocka, J. R. (2003). “Antibacterial and antifungal activity of juniper berry oil and its selected components,” Phytother. Res. 17(3), 227-231. DOI: 10.1002/ptr.1110
Govindarajan, R., Rastogi, S., Vijayakumar, M., Shirwaikar, A., Rawat, A. K. S., Mehrotra, S., and Pushpangadan, P. (2003). “Studies on the antioxidant activities of Desmodium gangeticum,” Biol. Pharm. Bull. 26(10), 1424-1427. DOI: 10.1248/bpb.26.1424
Ha, B. J., Lee, S. H., Kim, H. J., and Lee, J. Y. (2006). “The role of Salicornia herbacea in ovariectomy-induced oxidative stress,” Biol. Pharm. Bull. 29(7), 1305-1309. DOI: 10.1248/bpb.29.1305
Hamed, A. I., Masullo, M., Sheded, M. G., Mahalel, U. A., Tawfik, M. M., Perrone, A., and Piacente, S. (2011). “Triterpene saponins from Salsola imbricata,” Phytochem. Lett. 4(3), 353-356. DOI: 10.1016/j.phytol.2011.07.010
Kanski, J., Aksenova, M., Stoyanova, A., and Butterfield, D. A. (2002). “Ferulic acid antioxidant protection against hydroxyl and peroxyl radical oxidation in synaptosomal and neuronal cell culture systems in vitro: Structure-activity studies,” J. Nutr. Biochem. 13(5), 273-281. DOI: 10.1016/S0955-2863(01)00215-7
King, P. J., Ma, G., Miao, W., Jia, Q., McDougall, B. R., Reinecke, M. G., Cornell, C., Kuan, J., Kim, T. R., and Robinson, W. E. (1999). “Structure-activity relationships: Analogues of the dicaffeoylquinic and dicaffeoyltartaric acids as potent inhibitors of human immunodeficiency virus type 1 integrase and replication,” J. Med. Chem. 42(3), 497-509. DOI: 10.1021/jm9804735
Kong, C.-S., Kim, J.-A., Qian, Z.-J., Kim, Y. A., Lee, J. I., Kim, S.-J., Nam, T.-J., and Seo, Y. (2009). “Protective effect of isorhamnetin 3-О-beta-D-glucopyranoside from Salicornia herbacea against oxidation-induced cell damage,” Food Chem. Toxicol. 47(8), 1914-1920. DOI: 10.1016/j.fct.2009.05.002
Kweon, M.-H., Hwang, H.-J., and Sung, H.-C. (2001). “Identification and antioxidant activity of novel chlorogenic acid derivatives from bamboo (Phyllostachys edulis),” J. Agric. Food Chem. 49(10), 4646-4655. DOI: 10.1021/acs.jafc.0c03804
Lee, Y. S., Lee, H. S., Shin, K. H., Kim, B.-K., and Lee, S. (2004). “Constituents of the halophyte Salicornia herbacea,” Arch. Pharm. Res. 27(10), 1034-1036. DOI: 10.1007/BF02975427
Lisko, J. G., Stanfill, S. B., Duncan, B. W., and Watson, C. H. (2013). “Application of GC-MS/MS for the analysis of tobacco alkaloids in cigarette filler and various tobacco species,” Anal. Chem. 85(6), 3380-3384. DOI: 10.1021/ac400077e
Łuczkiewicz, M., Głód, D., Baczek, T., and Buciński, A. (2004). “LC-DAD UV and LC-MS for the analysis of isoflavones and flavones from in vitro and in vivo biomass of Genista tinctoria L.,” Chromatographia 60(3-4), 179-185. DOI: 10.1365/s10337-004-0357-y
Magwa, M. L., Gundidza, M., Gweru, N., and Humphrey, G. (2006). “Chemical composition and biological activities of essential oil from the leaves of Sesuvium portulacastrum,” J. Ethnopharmacol. 103(1), 85-89. DOI: 10.1016/j.jep.2005.07.024
Manach, C., Scalbert, A., Morand, C., Rémésy, C., and Jiménez, L. (2004). “Polyphenols: Food sources and bioavailability,” Am. J. Clin. Nutr. 79(5), 727-747. DOI: 10.1093/ajcn/79.5.727
Matuszewski, B. K., Constanzer, M. L., and Chavez-Eng, C. M. (2003). “Strategies for the assessment of matrix effect in quantitative bioanalytical methods based on HPLC-MS/MS,” Anal. Chem. 75(13), 3019-3030. DOI: 10.1021/ac020361s
Medina, I., Gallardo, J. M., González, M. J., Lois, S., and Hedges, N. (2007). “Effect of molecular structure of phenolic families as hydroxycinnamic acids and catechins on their antioxidant effectiveness in minced fish muscle,” J. Agr. Food Chem. 55(10), 3889-3895. DOI: 10.1021/jf063498i
Miliauskas, G., Venskutonis, P. R., and van Beek, T. A. (2004). “Screening of radical scavenging activity of some medicinal and aromatic plant extracts,” Food Chem. 85(2), 231-237. DOI: 10.1016/j.foodchem.2003.05.007
Ohiokpehai, O. (1982). Chlorogenic Acid Content of Green Coffee Beans, Ph.D. Dissertation, University of Surrey, Guildford, UK.
Oniszczuk, A., Wójtowicz, A., Oniszczuk, T., Matwijczuk, A., Dib, A., and Markut-Miotła, E. (2020). “Opuntia fruits as food enriching ingredient, the first step towards new functional food products,” Molecules 25(4), 916. DOI: 10.3390/molecules25040916
Oueslati, S., Trabelsi, N., Boulaaba, M., Legault, J., Abdelly, C., and Ksouri, R. (2012). “Evaluation of antioxidant activities of the edible and medicinal Suaeda species and related phenolic compounds,” Ind. Crop. Prod. 36(1), 513-518. DOI: 10.1016/j.indcrop.2011.10.006
Paznocht, L., Kotíková, Z., Burešová, B., Lachman, J., and Martinek, P. (2020). “Phenolic acids in kernels of different coloured-grain wheat genotypes,” Plant Soil and Environ. 66(2): 57-64. DOI: 10.17221/380/2019-PSE
Radwan, H. M., and Shams, K. A. (2007). “Phytochemical and biological investigations on Halocnemum strobilaceum (Chenopodiaceae),” Planta Med. 73(09). DOI: 10.1055/s-2007-987117
Rodrigues, M. J., Monteiro, I., Castañeda-Loaiza, V., Placines, C., Oliveira, M. C., Reis, C., Caperta, A. D., Soares, F., Pousão-Ferreira, P., and Pereira, C. (2020). “Growth performance, in vitro antioxidant properties and chemical composition of the halophyte Limonium algarvense Erben are strongly influenced by the irrigation salinity,” Ind. Crop. Prod. 143, article no. 111930. DOI: 10.1016/j.indcrop.2019.111930
Saija, A., Tomaino, A., Trombetta, D., De Pasquale, A., Uccella, N., Barbuzzi, T., Paolino, D., and Bonina, F. (2000). “In vitro and in vivo evaluation of caffeic and ferulic acids as topical photoprotective agents,” Int. J. Pharm. 199(1), 39-47. DOI: 10.1016/S0378-5173(00)00358-6
Schulz, H., Joubert, E., and Schütze, W. (2003). “Quantification of quality parameters for reliable evaluation of green rooibos (Aspalathus linearis),” Eur. Food Res. Technol. 216(6), 539-543. DOI: 10.1007/s00217-003-0696-1
Shi, X., Zhang, K., Xue, N., Su, L., Ma, G., Qi, J., Wu, Y., Wang, Q., and Shi, Q. (2013). “Differentiation of genuine Inula britannica L. and substitute specimens based on the determination of 15 components using LC–MS/MS and principal components analysis,” Food Chem. 141(4), 4019-4025. DOI: 10.1016/j.foodchem.2013.06.123
Stratil, P., Klejdus, B., and Kubáň, V. (2007). “Determination of phenolic compounds and their antioxidant activity in fruits and cereals,” Talanta 71(4), 1741-1751. DOI: 10.1016/j.talanta.2006.08.012
Suárez-Quiroz, M. L., Campos, A. A., Alfaro, G. V., González-Ríos, O., Villeneuve, P., and Figueroa-Espinoza, M. C. (2014). “Isolation of green coffee chlorogenic acids using activated carbon,” J. Food Compos. Anal. 33(1), 55-58. DOI: 10.1016/j.jfca.2013.10.005
Taha, A., and Alsayed, H. (2000). “Brine shrimp bioassay of ethanol extracts of Sesuvium verrucosum, Salsola baryosma and Zygophyllum quatarense medicinal plants from Bahrain,” Phytother. Res. 14(1), 48-50. DOI: 10.1002/(SICI)1099-1573(200002)14:1<48::AID-PTR536>3.0.CO;2-Z
Tram, N. T. N., Mitova, M., Bankova, V., Handjieva, N., and Popov, S. S. (2002). “GC-MS of Crinum latifolium L. alkaloids,” Z. Naturforsch. C 57(3-4), 239-242. DOI: 10.1515/znc-2002-3-407
Waldron, K. W., Parr, A. J., Ng, A., and Ralph, J. (1996). “Cell wall esterified phenolic dimers: Identification and quantification by reverse phase high performance liquid chromatography and diode array detection,” Phytochem. Analysis 7(6), 305-312. DOI: 10.1002/(SICI)1099-1565(199611)7:6<305::AID-PCA320>3.0.CO;2-A
Yin, M., Wang, X., Wang, M., Chen, Y., Dong, Y., Zhao, Y., and Feng, X. (2012). “A new triterpenoid saponin and other saponins from Salicornia europaea,” Chem. Nat. Compd. 48(2), 258-261. DOI: 10.1007/s10600-012-0216-2
Zając, A., Zembrzuska, J., Ginter-Kramarczyk, D., and Kruszelnicka, I. (2014). “Biodegradation of nonsteroidal anti-inflammatory drugs in wastewater treatment processes in large urban areas,” Przem. Chem. 93(12), 2265-2269. DOI: 10.12916/przemchem.2014.2265
Zembrzuska, J., Budnik, I., and Lukaszewski, Z. (2014). “Separation and determination of homogenous fatty alcohol ethoxylates by liquid chromatography with multistage mass spectrometry,” J. Sep. Sci. 37(13), 1694-1702. DOI: 10.1002/jssc.201301391
Zhu, F., Chen, X., Yuan, Y., Huang, M., Sun, H., and Xiang, W. (2009). “The chemical investigations of the mangrove plant Avicennia marina and its endophytes,” Open Nat. Prod. J. 2, 24-32. DOI: 10.2174/1874848100902010024
Article submitted: March 26, 2019; Peer review completed: July 28, 2019; Revised version received and accepted: May 18, 2021; Published: June 15, 2021.
DOI: 10.15376/biores.16.3.5508-5523