
Abstract
This study combined chemical ultrasonic modifications and microwave oven heating to prepare a novel adsorbent, bagasse iron oxide biochar, (BIBC) to remove phosphate from aqueous solutions. The characterization of BIBC was made by energy dispersive spectrometry (EDS), Brunauer–Emmett–Teller (BET), Fourier transform infrared spectroscopy (FTIR), X-ray diffraction (XRD), and X-ray photoelectron spectroscopy (XPS) analyses, and the mechanism of phosphorus adsorption on BIBC was researched by adsorption batch experiments with emphasis on pH, dosages of BIBC, initial phosphorus concentration, and adsorption time. The BIBC’s BET specific surface area and pore volumes were 81.94 m2 g−1 and 26.74 cm3 g−1, respectively. The pH for the optimal phosphorus adsorption by BIBC ranged from 5.0 to 7.0. The maximum adsorption capacities of phosphorus (according to the Langmuir model) were 3.62, 4.06, and 4.32 mg g-1 at temperatures of 25, 35, and 45 °C, respectively. Electrostatic interaction, surface adsorption of phosphorus on BIBC, and ion exchange were the main mechanisms of phosphorus adsorption. According to XPS results, Fe2p was involved in the adsorption reaction. The adsorption of phosphorus by BIBC is considered to be mainly chemical adsorption. The BIBC was stable under a pH range from 4.0 to 10.0 and secondary pollution did not result.
Download PDF
Full Article
Phosphate Adsorption onto Bagasse Iron Oxide Biochar: Parameter Optimization, Kinetic Analysis, and Study of Mechanisms
Qing Zhang, Yan-mei Ding, Lin Lu, Jing-xi Li, Mei-na Liang,* and Yi-nian Zhu
This study combined chemical ultrasonic modifications and microwave oven heating to prepare a novel adsorbent, bagasse iron oxide biochar, (BIBC) to remove phosphate from aqueous solutions. The characterization of BIBC was made by energy dispersive spectrometry (EDS), Brunauer–Emmett–Teller (BET), Fourier transform infrared spectroscopy (FTIR), X-ray diffraction (XRD), and X-ray photoelectron spectroscopy (XPS) analyses, and the mechanism of phosphorus adsorption on BIBC was researched by adsorption batch experiments with emphasis on pH, dosages of BIBC, initial phosphorus concentration, and adsorption time. The BIBC’s BET specific surface area and pore volumes were 81.94 m2 g−1 and 26.74 cm3 g−1, respectively. The pH for the optimal phosphorus adsorption by BIBC ranged from 5.0 to 7.0. The maximum adsorption capacities of phosphorus (according to the Langmuir model) were 3.62, 4.06, and 4.32 mg g-1 at temperatures of 25, 35, and 45 °C, respectively. Electrostatic interaction, surface adsorption of phosphorus on BIBC, and ion exchange were the main mechanisms of phosphorus adsorption. According to XPS results, Fe2p was involved in the adsorption reaction. The adsorption of phosphorus by BIBC is considered to be mainly chemical adsorption. The BIBC was stable under a pH range from 4.0 to 10.0 and secondary pollution did not result.
Keywords: Adsorption; Bagasse biochar; Iron oxide; Phosphate; Pollution mediation
Contact information: School of Environmental Science and Engineering, Guilin University of Technology, Guilin, 541004, P.R. China; *Corresponding author: liangmeinaa@163.com
GRAPHICAL ABSTRACT
INTRODUCTION
The excessive emission of nutrients, particularly phosphorous, has become a tough environmental issue around the world (Qamouche et al. 2020). Aquatic ecosystems have been ruined because of high level phosphate can stimulate the growth of organisms in water bodies (Isiuku and Enyoh 2020). When phosphate concentrations in water bodies are in excess, there is overgrowth of water plants, leading to the formation of algal bloom. This causes a high consumption of dissolved oxygen in the water. Dissolved oxygen in the water body is drastically reduced, leading to the suffocation and death of aquatic plants and animals. The dead plants and animals decay, creating deterioration of water quality. The natural recovery of phosphate is inefficient, whereby the phosphate is temporally converted into sediment and then subsequently released into water. Therefore, it is imperative to explore an efficient technology to remove phosphate from water.
Different methods are used to limit or remove phosphorus from water to effectively control eutrophication. These include oxidation ditches, anaerobic/aerobic-activated sludge processes, biological treatment (Sano et al. 2012), dosing calcium and iron salts (besides other chemical phosphorus removal methods), and combined biological/chemical technologies (Kim et al. 2015). Adsorption methods, which are cheap and easy to operate, can effectively treat low concentration phosphorus wastewater (Özacar 2003). The adsorbed phosphorus can be reused in agricultural production or recycled. Zeolite (Jiang et al. 2019; Liu et al. 2019), fly coal ash (Wang et al. 2019), diatomite (Vikrant et al. 2018), biochar (Liao et al. 2018), and other materials can remove phosphorus through adsorption. Biochar is one of the most common adsorbents employed. It is a low-cost and environmentally friendly material derived by the pyrolysis of feedstock biomass, and it has applications in various contaminated environments (Rajapaksha et al. 2016). However, these natural polymer adsorbents have low adsorption capacity and relatively low treatment efficiency, which restricts their widespread use (Md. Munjur et al. 2020; Hızal et al. 2021). Therefore, modification of these adsorbents to improve performance has attracted much attention (Marshall et al. 2017; Qiao et al. 2017).
Using Chinese cabbage and cole-crop residues as adsorbents, Zhang et al. (2019) prepared biochar/Mg-Al-layered double oxides for removing phosphate from aqueous solution. The removal of phosphate was greater than 92% at pH values ranging from 2 to 10. The removal of phosphorus was greater than 95% in the first 5 min for 50 mg L-1 phosphate when using biochar/layered double oxides of 0.05 g. Tang et al. (2019) used rice hull biochar as the base material for La(OH)3 nanoparticles to prepare a series of rice husk biochars with high mesoporous rates by focusing on the influences of base pore structure and zero-point charge (pHpzc). Phosphate can be retained with pH 3 to 10 with inappreciable La leaching.
However, most materials applied in such research applications are not fit for commercial and industrial purposes due to problems caused by their powders during operations, such as pore clogging, pressure decrease, and mass loss (El-Nahas et al. 2020; Sheth et al. 2021). In this study, bagasse iron oxide biochar (BIBC) was considered as an alternative for stabilization and immobilization in phosphate adsorption. In this study, novel adsorbents were produced for removing phosphate using BIBC as the main ingredient. This study aimed to (1) assess the influence of various operational elements on phosphate adsorption onto BIBC, (2) analyze the adsorption process by kinetic models and isotherm models, and (3) identify the main mechanisms of phosphate adsorption by characterizing BIBC before and after phosphate adsorption.
EXPERIMENTAL
Preparation of BIBC
Wash and sift
Bagasse was purchased from Nanning Sugar Co., Ltd. The sugar was rinsed from the bagasse thoroughly. Then the bagasse was dried using an electric constant-temperature blast-drying oven at 80 °C.The material was pulverized using a universal crusher, then screened using a 0.085 mm standard sieve.
Impregnation with a ferric solution
Ferrous sulfate solution (0.15 mol L−1) was added into a reagent bottle with a wide, frosted mouth, and 50 g of bagasse was added. After mechanical agitation, the sample underwent ultrasonic oscillation for 30 min and was left for 36 h. Under mechanical agitation, the pH was adjusted to 8.5 by slowly adding the ammonia solution (10% v/v). Then, the product was heated to 85 °C in a microwave oven and filtered. The filter cake was obtained. Ultrapure water was applied to wash the filter cake until the pH was 7.0, and the filter cake was placed in a beaker filled with 200 mL absolute ethanol for a 30 min oscillation. Next, it was filtered and a mixture of ferric hydroxide and mixture bagasse was obtained.
Drying and calcination
The mixture was placed on a porcelain plate and dried at 110 °C, and then a dry bagasse iron hydroxide mixture was prepared. The bagasse iron hydroxide mixture was carbonized for 4 h at 450 °C, and a 100-mesh sieve was used for screening. The material, denoted as BIBC, was then cooled.
The sugar was thoroughly rinsed from the bagasse. Then, bagasse was dried using an electric constant-temperature blast drying oven at 80 °C. The dried bagasse was placed into a porcelain crucible, which was placed in the muffle furnace for calcination, grinding, and screening at 450 °C. In this way, BBC was prepared.
Preparation of bagasse biochar (BBC) without magnetic iron oxide is described in the Appendix as Supporting information S1. Commercial activated carbon was purchased from chemical stores.
Instrument
The bagasse iron hydroxide mixture was carbonized using a muffle furnace (Thermo Fisher Scientific, USA). The C, H, N, and S elemental analysis was performed with an elemental analyzer (EA 2400 II; PerkinElmer, Waltham, MA, USA), and the Brunauer–Emmett–Teller (BET) equation was used to determine the specific surface area and pore diameter with information from a JW-BK200C apparatus (Beijing Jingwei Gaobo Science and Technology Co., Ltd., Beijing, China). Infrared spectra were measured using an FTIR spectrometer (CAT500A; PerkinElmer, Beaconsfield, UK). The zero-point potential was determined with a Zeta potential analyzer (NOVAe1000; Quantachrome, Boynton Beach, FL, USA) and an ESCALAB 250Xi (Thermo Electron Corporation, Waltham, MA, USA) was employed to perform X-ray photoelectron spectroscopy (XPS) experiments. X-ray diffraction (X’Pert PRO X; PANalytical, Almelo, Netherlands) was used to carry out powder X-ray diffraction analyses. Energy dispersive spectrometry (EDS) (JEM-6380LV; JEOL Ltd., Tokyo, Japan) was adopted to observe the chemical composition of BIBC before and after phosphorus adsorption.
Batch Adsorption Experiment
Parameters influencing phosphorus adsorption
After adding BIBC (0.20 g) to 100 mL plastic centrifuge tubes, a phosphorus-containing solution of 50 mL at different concentrations was added into the plastic centrifuge tube. The pH value of the solution was adjusted to the set values by adding 1.0 mol L-1 NaOH or 1.0 mol L-1 HNO3. Then, a constant-temperature water bath oscillator was used to hold plastic centrifuge tubes for a 48 h adsorption reaction at a speed of 150 rpm at 25 °C. After adsorption equilibrium, the solution was filtered with a 0.45-μm membrane to determine the phosphate concentration in the filter solution by the Mo-Sb molybdenum blue spectrophotometry method. More details on experimental conditions are as follows:
(1) The effect of adsorbent types on adsorption, BIBC, BBC and Active Carbon were selected as adsorbents. Concentration of phosphorus solution, 2, 5, and 10 mg L−1, solution pH, 5.0; temperatures, 25 °C; and adsorption time, 48 h.
(2) The effect of various operating parameters, such as solution pH (2.0, 3.0, 4.0, 5.0, 6.0, 7.0, 8.0, 9.0, 10.0, 11.0, and 12.0), adsorbent dosage (0.05, 0.10, 0.20, 0.30, 0.40, 0.50, and 0.60 g L-1), initial phosphorus concentration (2, 4, 6, 8, 10, 12, 15, 20, 30, 40, 50, 60, 80, and 100 mg L−1), and adsorption time (0.25, 0.5, 0.75, 1, 2, 3, 4, 6, 8, 10, 12, 15, 18, 21, 24, 27, 30, 36, and 48 h), on phosphorus adsorption were studied. The effect of coexisting ions, such as NO3–, SO42-, CO32-, and PO43-, at 10 mg L−1 was also studied.
The relationship between removal efficiency R (%) and equilibrium concentration (Eq. 1); between adsorption capacity Q (mg g-1) and dosage (g L-1) (Eq. 2) could be described by two equations below.

where C0 and Ce (mg L-1) are defined as initial and equilibrium concentration of phosphate, and m (g) and V (L) are the dosage of BIBC and volume of solution, respectively.
Adsorption Kinetics
A series of 100-mL plastic centrifuge tubes containing 0.2 g BIBC in 50 mL phosphorus solution at initial concentrations of 2, 5, and 10 mg L-1 and a constant pH value of 5 were used to examine adsorption kinetics. The mixing was made in centrifuge tubes at a speed of 150 rpm by an isothermal shaker at 25 °C. After collecting and filtering samples at different time intervals (0.25, 0.5, 0.75, 1, 2, 3, 4, 6, 8, 10, 12, 15, 18, 21, 24, 27, 30, 36, and 48 h), residual phosphorus concentration was analyzed according to collected filtrates.
Isothermal Adsorption
Experiments on equilibrium adsorption were made by employing a range of phosphorus solutions that contained initial concentrations (0.1, 0.5, 2.0, 3.5, 5.0, 7.0, 10.0, 12.0, 25.0, 30.0, 40.0, 45.0, 80.0, 90.0, and 100.0 mg L-1). All solutions contained 0.2 mg per 50 mL BIBC with a pH value of 5. In a shaker, all solids and solutions were mixed at different temperatures (25, 35, and 45 °C). Residual phosphorus concentrations were measured according to the procedures of kinetics experiments.
RESULTS AND DISCUSSION
Characterization of BIBC
The C, H, N, and S were found to account for 35.15%, 1.40%, 0.46%, and 0.66%, respectively, in BIBC. The EDS analysis showed oxygen content to be 45.37%. Atomic absorption spectrophotometry showed Fe content to be 16.96%. These results indicated that the essential components of BIBC were C, O, and Fe. The pore volume of BIBC was 26.74 cm3 g−1. The BET specific surface area of BIBC was 81.9 m2 g−1, which was greater than that 26.79 m2 g-1 of the Fe(III)-impregnated sorbent (Zhu et al. 2011).
The diffraction peaks of BIBC at 2θ of 30.16°, 35.58°, 57.32°, and 62.65° agree with the diffraction (220), (311), (511), and (440), respectively, of Fe3O4 (magnetite, reference code 00-003-0863) (Fig. 1). The peaks of BIBC match the XRD reference code of Fe3O4 in the international diffraction data center, confirming the existing form of Fe3O4 in the BIBC sample. At 2θ of 30.16° and 35.58°, wide peaks with weak intensity were found. The XRD peaks indicate that small Fe3O4 particles may be present in BIBC (Özlem Kocabaş-Ataklı and Yürüm 2013), with a small degree of crystallization and an amorphous structure.

Fig. 1. X-ray diffractometer patterns of BIBC
Effect of Adsorption Elements
Effect of adsorbent types on adsorption
The adsorption effect of phosphorus on the BIBC, BBC, and activated carbon was compared under the same conditions. The test results showed (Fig. 2) that the adsorption effect of BIBC was much better than that of BBC because of the doping of iron oxide on the surface. At the phosphorus concentration of 2, 5, and 10 mg L-1, the BIBC removal increased from 61.8%, 50.8%, and 25.6% to 97.8%, 93.0%, and 65.2%, respectively. The adsorption ability of the three types of materials to remove phosphorus was: BIBC > BBC > Active Carbon. The bagasse biochar modified by iron oxide obviously increases the ability to remove phosphorus. By contrast, the BET specific surface area of BBC was 10.19 m2 g-1, and the pore volume was 3.05 cm3 g-1, the BET specific surface area of active carbon was 5.41 m2 g-1, and the pore volume was 3.05 cm3 g-1.

Fig. 2. Removal of three kinds of adsorbents for different concentrations of phosphorus
Effect of solution pH
As one of the main factors influencing the removal of ions from aqueous solution, the pH value influences the adsorption effect, which is shown in Fig. 3. At pH 4 to 7, the removal of phosphorus by BIBC was greater than 98%. At pH 6, the removal reached 98.8% as the maximum value. At pH 7 to 12, the removal gradually dropped from 98.1% to 12.6%, indicating that the removal of phosphorus by BIBC is remarkable affected by the pH value. Due to the different pH values of the solution, the form of phosphorus also changed. Phosphate was in the form H2PO4− at pH from 2 to 3. At pH 4 to 7, phosphate existed in the form of H2PO4− and HPO42− (Zhu et al. 2018). At pH 7 to 12, phosphate existed in the form of HPO42−. According to the zeta potential measurement, the zero-charge point of BIBC (pHzpc) was 6.20. The surface of BIBC carried a positive charge when the pH value of the solution was less than 6.20 and a negative charge when the pH value of the solution was greater than 6.20. At pH < 6.2, the surface of BIBC was positively charged and electrostatically reacted with H2PO4− and HPO42− in solution, thereby indicating that BIBC more strongly adsorbs to phosphorus. At pH > 6.2, the surface of BIBC was negatively charged and demonstrated electrostatic repulsion of H2PO4− and HPO42− in the solution. The OH− competes for the same adsorption sites on the surface of BIBC in alkaline conditions, resulting in a decrease in the removal of phosphorus by BIBC. The pH for the optimal phosphorus adsorption by BIBC was 5.0 to 7.0.

Fig. 3. Effect of solution pH on the BIBC adsorption of phosphorus. Notes: Concentration of phosphorus = 2 mg L-1, dosage = 0.2 g, solution volume = 50 mL, adsorption time = 48 h, temperature = 25°C
Effect of BIBC dosage
Figure 4 shows the influence of BIBC dosage on the removal of phosphorus. At pH 5.0, the removal of phosphorus and phosphorus adsorption capacity gradually increased and decreased, respectively, with increased dosage of BIBC. At a BIBC dosage of 0.05 to 0.20 g in 50 mL solution, the removal of phosphorus by BIBC increased with increasing BIBC dosage. With the concentration of phosphorus in the solution remaining constant, the increase in BIBC dosage led to an increased total surface area of the adsorbent, resulting in more phosphate ions that can be adsorbed. At a dosage of 0.20 g per 50 mL, the removal of phosphorus was 98.2%, and the phosphorus adsorption capacity was 0.49 mg g−1. The removal was unchanged when the dosage exceeded 0.20 g in 50 mL solution, whereas the phosphorus adsorption capacity remarkably decreased (only by 0.17 mg g−1). Therefore, the optimal dosage of BIBC selected in the experiment was 0.20 g in 50 mL solution to ensure maximum phosphorus adsorption capacity and removal.

Fig. 4. Effect of dosage on the BIBC adsorption of phosphorus. Notes: Concentration of phosphorus = 2 mg L-1, solution volume = 50 mL, pH = 6.0, adsorption time = 48 h, temperature = 25 °C
Effect of initial phosphorus concentration
With the increase in the concentration of the phosphorus-containing solution, phosphorus adsorption capacity gradually increased until it stabilized (Fig. 5). This may be because of the increase in the concentration of phosphorus that can be adsorbed results in a larger concentration difference with BIBC, which reduces mass transfer resistance and improves the adsorption capacity of phosphorus (Lv et al. 2013). When the initial concentration of the phosphorus solution reached 60 mg L−1, the phosphorus adsorption capacity was saturated. At temperatures of 25, 35, and 45 °C, the equilibrium adsorption capacity of phosphorus by BIBC was 3.53, 3.80, and 4.05 mg g−1, respectively.

Fig. 5. Effect of initial phosphorus concentration on the BIBC adsorption of phosphorus
Dosage = 0.2 g, solution volume = 50 mL, pH = 6.0, adsorption time = 48 h, temperature = 25°C
Effect of adsorption time
The phosphorus adsorption capacity increased as the adsorption time increased (Fig. 6). There was no noticeable change due to phosphorus’ lower adsorption capacity at the initial concentration of 2 mg L−1. However, the general trend was that the amount of adsorption increased with increased reaction time. For initial concentrations of 5 and 10 mg L−1, BIBC had a relatively large adsorption rate for phosphate within the first 15 h when the reaction started and phosphorus’ adsorption strengthened.

Fig. 6. Effect of adsorption time on the BIBC adsorption of phosphorus
Dosage = 0.2 g, solution volume = 50 mL, pH = 6.0, temperature = 25 °C
At an initial phosphorus concentration of 10 mg L-1, the process of adsorption may consist of three different phases (0 to 15 h, 15 to 28 h, and 28 to 48 h) (Ahmed and Hameed 2018; Araújo et al. 2018; Zhu et al. 2018). In the first phase, the adsorption rate increased rapidly, as the adsorbate was adsorbed on the inner surface by the adsorbent, and the electrostatic attraction was prominent (Gaikwad et al. 2016). In the second stage (15 to 28 h), diffusing adsorbate into the pores inside the adsorbent led to a slower absorption rate and thus intra-membrane diffusion was the main adsorption force (Zhu et al. 2018). In the third stage (28 to 48 h), adsorption rate gradually weakened with a saturation of the adsorption sites (Hu et al. 2018; Liang et al. 2018). As the adsorption reaction continued, the adsorption capacity stabilized and the reaction reached equilibrium in approximately 30 h.
Effect of coexisting ions
Large amounts of NO3–, CO32-, and SO42- were present in the solution, and they competed with phosphorus for adsorption, which reduced the adsorption capacity of the BIBC for phosphorus. Concentrations of NO3–, CO32-, and SO42- at 10 mg L-1 had different effects on phosphorus adsorption capacity (Fig. 7). Phosphorus adsorption capacity decreased from 1.28 (Blank) mg g-1 to 1.15 mg g-1 (NO3–), 1.17 mg g-1 (SO42-), and 1.25 mg g-1 (CO32-). The order of inhibition in the adsorption process was NO3– > SO42- > CO32- with a large negative effect of NO3– on phosphorus absorbability by the BIBC. In contrast, in the presence of carbonate, the adsorption capacity decreased only 2.5%. In the presence of nitrate and sulfate, the phosphorus adsorption capacity decreased 10.2% and 8.6%, respectively. NO3–, SO42, and CO32- have different degrees of inhibition on phosphorus adsorption capacity, which ultimately stem from differences in the affinity form these anions to BIBC (Shi et al. 2011; Yang et al. 2019).

Fig. 7. Effect of coexisting ions on phosphate adsorption
Adsorption Kinetics
The adsorption kinetics data were fitted using Eq. 3 for the pseudo-second-order kinetic equation. The adsorption kinetics data were also fitted by pseudo-first-order kinetic equation, Bangham kinetic equation, and Elovich kinetic equation, as shown in the Supporting Information S3 (Wong et al. 2004; Fan et al. 2011), respectively.

where Qe is in mg g−1 and represents the adsorption capacity of BIBC when the adsorption reaction is stable; Qt is in mg g−1 and is the adsorption capacity of adsorbent to adsorbate at time t; t (min) is the adsorption time; and K2 indicates the pseudo-second-order kinetic equation constant in g mg-1 min-1.

Fig. 8. Fitting curves of pseudo-second-order kinetic equations of the BIBC adsorption of phosphorus
The experimental data in Fig. 8 were fitted by the pseudo-second-order kinetic equation. In addition, Figs. S1, S2 and S3 were fitted by the pseudo-first-order equation, the Bangham kinetic equation, and the Elovich kinetic equation in the Supporting information S3. Table 1 shows the summary of kinetic parameters extracted from the fitting results. From Table 1, the coefficients of determination (R2) of the pseudo-second-order kinetic equation were 0.9999, 0.9997, and 0.9978 at initial phosphorus concentrations of 2, 5, and 10 mg L−1, respectively. The calculated phosphorus adsorption capacities (0.49, 1.12, and 1.29 mg g−1) were close to the actual measured phosphorus adsorption capacities (0.49, 1.12, and 1.28 mg g−1). This result shows that the adsorption process can be fitted by the pseudo-second-order kinetic equation.
Table 1. Kinetic Equation Parameters of the BIBC Adsorption of Phosphorus

qe,exp, corresponds to experimental value
Adsorption Isotherm
The association between the concentration of the solution and the adsorbent at a specific temperature is described by an adsorption isotherm curve (Zhu et al. 2018). When the adsorption reaction reaches equilibrium, the relevant parameters are calculated from the adsorption isotherm curve, and the dosage of the adsorbent for different pollutants and adsorbents can be determined. In the solid-liquid phase adsorption process, the Langmuir and the Freundlich adsorption isotherms (Wang et al. 2017) are adopted most widely.
(1) Langmuir isotherm
The Langmuir adsorption isotherm model is an ideal monomolecular layer adsorption model based on the interaction between adsorbate and adsorbent. The Langmuir equation is shown as Eq. 4 (N. Wang et al. 2017),

where Ce is the concentration of the adsorbate solution at equilibrium in mg L-1, Qe (g−1) is the adsorption capacity at equilibrium, Qm (mg g−1) is the maximum adsorption capacity, and KL refers to the Langmuir equation constant.
(2) Freundlich isotherm
The model of Freundlich isotherm adsorption applied to the description of the adsorption process in dilute aqueous solutions (Wang et al. 2017). See Eq. 5,

where Ce (mg L−1) refers to the concentration of adsorbate solution at equilibrium, Qe (mg g−1) is the adsorption capacity at equilibrium, n is a nondimensional parameter, and Kf is the Freundlich adsorption equilibrium constant.

Fig. 9. Adsorption isotherms of phosphorus with the BIBC and BBC
The data were fitted using the adsorption isotherm equations. Figure 9 shows the experimental results. The maximum adsorption capacities (Qmax) of phosphorus by BBC and BIBC were 1.45 and 3.53 mg g−1, respectively, at 25 °C. Compared to BBC, the adsorption capacity of BIBC with phosphorus increased 58.9%. With an increase in the reaction temperature from 25 °C to 45 °C, the adsorption of phosphorus increased from 3.53 to 4.05 mg g−1. The result indicates that increasing temperature is advantageous for the adsorption reaction.
Figure 10 show the data fitted using the Langmuir adsorption isotherm, and Fig. S4 is shown in the Supporting Information as S4.

Fig. 10. Isotherm plots for Langmuir equations of the BIBC adsorption of phosphorus
The data of the two adsorption models are listed in Table 2. The coefficients of determination (R2) of the Langmuir model were 0.9758, 0.9802, and 0.9867, respectively, at 25, 35, and 45 °C. There was a slight difference between calculated maximum adsorption capacities of phosphorus (3.62, 4.06, and 4.32 mg g−1) and the experimental equilibrium adsorption capacities of phosphorus (3.53, 3.80, and 4.05 mg g−1, respectively). This result indicates that the adsorption process can be described by the Langmuir equation. The maximum adsorption capacity of BIBC is higher or comparable to that of water clinker ash and iron oxide tailings composite 1.29 mg g-1 (Sima et al. 2018), longleaf pine biochar 1.49 mg g-1 (Oginni et al. 2020), red oak biochar 2.42 mg g-1 (Oginni et al. 2020), hard maple biochar 1.05 mg g-1 (Oginni et al. 2020), and nano biochar 1.14 mg g-1 (Mahmoud et al. 2020).
Table 2. Adsorption Isotherm Parameters of BIBC for Phosphorus

The adsorption of BIBC of phosphorus at initial concentrations of 1 to 100 mg L-1 was relatively strong, and the adsorption process may be monomolecular layer adsorption. The data also were fitted using the Freundlich adsorption isotherm-fitting curve. The correlation coefficients (R2) of the Freundlich model were 0.8759, 0.8954, and 0.8903, respectively, at 25, 35, and 45 °C, which indicates that the phosphorus adsorption process by BIBC cannot be well described using this adsorption isotherm model. The value of 1 / n was 0.2528, 0.2780, and 0.2788, respectively, at 25, 35, and 45 °C, all values of 1 / n < 1.0, which indicates that BIBC has a relatively strong absorbability for phosphorus and the adsorption is chemical in nature (Crini 2008).
Through the study of the adsorption thermodynamics, the progress and the driving force of the adsorption reaction can be identified (Wei et al. 2019; C.-L. Chen et al. 2019). The adsorption free energy and enthalpy change at different experimental temperatures can be calculated based on Eqs. 6 and 7 to study the adsorption mechanisms,

where ΔG° (kJ mol−1) is the Gibbs free energy, R is 8.314 J mol-1 K-1, the ideal gas constant, T (K) is the adsorption temperature, KL (L mg−1) is the Langmuir constant, and ΔH° (kJ mol−1) is adsorption enthalpy.
With the constant KL, adsorption temperature, and standard gas constant of the Langmuir isotherm adsorption model, the free energy change (ΔG°) can be calculated. Table 3 shows the thermodynamic parameters. The values of ΔG° were 5.36, 5.46, and 5.16 kJ mol-1, respectively, at 25, 35, and 45 °C, which indicated that the adsorption of phosphorus on BIBC was spontaneous. According to ΔH° = 8.183 kJ mol-1 (i.e., ΔH° > 0), the adsorption reaction is endothermic and the increase in temperature is conducive to the adsorption process. In addition, ΔS0 = 9.578 J mol-1 K-1 (i.e., ΔS° > 0), which indicated adsorption reaction was driven by entropy.
Table 3. Adsorption Thermodynamic Parameters

Adsorption Mechanism
FTIR analysis
The infrared spectra of BIBC before and after phosphorus adsorption are shown in Fig. 11. The stretching vibrations of -C = C and -C = O lead to the absorption peak at wavenumber 1605 cm-1 (Y.-H. Jiang et al. 2019). After BIBC phosphorus adsorption, the absorption peak at wavenumber 1605 cm-1 shifted to 1602 cm-1, and the characteristic peak at 1034 cm−1 disappeared, indicating the participation of -C = C, -C = O, and C – O in the adsorption reaction. The peaks of the Fe-O of Fe3O4 vibrations (Y.-H. Jiang et al. 2019; Yoon et al. 2014) were 636 and 534 cm−1; after BIBC phosphorus adsorption, the absorption peaks at 636 and 534 cm−1 shifted to 654 and 557 cm−1, respectively, and the peak intensity became weaker. This indicates that an inner spherical surface complex between phosphate and Fe3O4 in the BIBC formed (Yoon et al. 2014).

Fig. 11. Fourier-transform infrared spectra before and after phosphorus adsorption
EDS analysis
The EDS analysis of BIBC before and after phosphorus adsorption was shown in Table 4. The C content decreased 10.4% and O content increased 7.9%. A peak of phosphorus appeared on the energy spectrum, which indicates that after the adsorption of phosphorus, the phosphorus was found on the surface of the BIBC. Its weight percentage was 0.71%, confirming phosphorus adsorption on BIBC (Bhaumik et al. 2011; Ye et al. 2015).
Table 4. Surface Composition of the BIBC and BIBC After Phosphorus Adsorption by EDS Analysis

XPS analysis
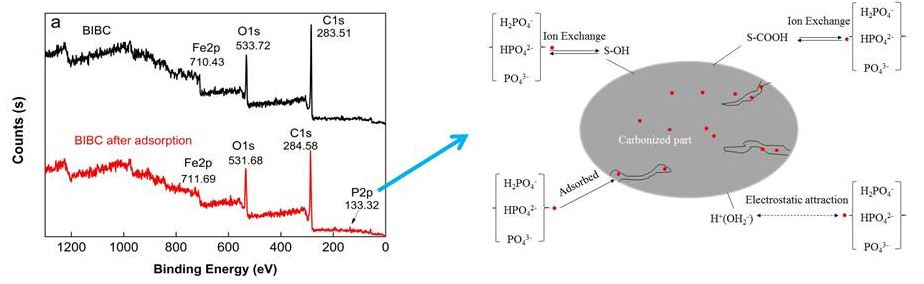
The X-ray photoelectron spectra of the BIBC and the BIBC after phosphorus adsorption are shown in Fig. 12(a). The P2p region of BIBC after phosphorus adsorption is shown in Fig. 12(b). The corresponding orbital binding energy data are listed in Table 5.

Fig. 12. X-ray photoelectron spectra of BIBC before and adsorption phosphorus (a) and the P2p region of BIBC (b) after phosphorus adsorption
Table 5. XPS Peak Spectral Analysis of BIBC and BIBC After Phosphorus Adsorption

The observed photoelectron signals were C1s (283.51 to 284.58 eV), O1s (530.72 to 531.68 eV), and Fe2p (710.43 to 711.69 eV), as presented in Fig. 12 (a). Because phosphorus content was only 1.71% (Table 5) of the BIBC after phosphorus adsorption, its XPS intensity was relatively low. It could be seen that after BIBC phosphorus adsorption, the binding energy of the Fe2P, C1s, and O1s of BIBC shifted from 710.43 to 711.69 eV, 283.51 to 284.58 eV, and 530.72 to 531.68, respectively, which indicates that iron oxides in the BIBC, oxygen-containing functional groups, and carbon-containing functional groups participated in the adsorption reaction. The adsorption of phosphorus on the BIBC is chemical (Liang et al. 2018; Rupa et al. 2020; Y. Chen et al. 2020).
On the surface of BIBC, associated with C-OH, Fe-OH (represented by ≡S-OH), and –COOH (displayed by ≡S-COOH), there were several functional groups. The assumptions regarding the adsorption reaction between BIBC and phosphorus in various forms are shown in Fig. 13. In addition, equations S1 to S9 are provided in Supporting Information S4.

Fig. 13. The proposed reaction mechanism of phosphorus on the BIBC
Furthermore, it was inferred that phosphorus could adsorb onto the BIBC surface with electrostatic binding—surface adsorption of phosphorus onto BIBC and the ion exchange between the functional groups was on the surfaces of the BIBC and phosphorus.
CONCLUSIONS
Bagasse iron oxide biochar (BIBC) was characterized by energy dispersive spectroscopy (EDS), Brunauer-Emmett-Teller analysis (BET), Fourier transform infrared spectrometry (FTIR), X-ray diffraction (XRD), and X-ray photoelectron spectrometry (XPS). The experiments involved alteration of pH, dosages of BIBC, and initial phosphorus concentration. The mechanisms of phosphorus adsorption on BIBC and the main factors influencing it were examined.
- The adsorption process could be well fitted by the pseudo-second-order kinetic equation and by the Langmuir isotherm model. The BIBC adsorption of phosphorus was spontaneous and endothermic chemical adsorption, based on thermodynamics.
- Carboxyl groups of the biochar as well as hydroxyl groups related to Fe were involved with the adsorption process. As a chemical adsorption process, the comparison of XPS data before and after phosphorus adsorption provided evidence of the participation of Fe3O4. Electrostatic interaction, surface adsorption of phosphorus on BIBC, and ion exchange were the main mechanisms of phosphorus adsorption onto BIBC.
- The BIBC developed in this work can be used as an alternative remediation agent in many environmental applications to mitigate the risks of phosphorus contamination.
ACKNOWLEDGEMENTS
This work was supported by Guangxi Natural Science Foundation Project (No. 2017GXNSFAA198186), Guangxi Mid-Youth Capability Project (No. 2020KY06038), the National Natural Science Foundation of China (Nos. 21367010 and 21707024).
REFERENCE CITED
Ahmed, M. J., and Hameed, B. H. (2018). “Removal of emerging pharmaceutical contaminants by adsorption in a fixed-bed column: A review,” Ecotoxicology and Environmental Safety 149, 257-266. DOI: 10.1016/j.ecoenv.2017.12.012.
Araújo, C. S. T., Almeida, I. L. S., Rezende, H. C., Marcionilio, S. M. L. O., Léon, J. J. L., and de Matos, T. N. (2018). “Elucidation of mechanism involved in adsorption of Pb(II) onto lobeira fruit (Solanum lycocarpum) using Langmuir, Freundlich, and Temkin isotherms,” Microchemical Journal 137, 348-354. DOI: 10.1016/j.microc.2017.11.009.
Bhaumik, M., Maity, A., Srinivasu, V. V., and Onyango, M. S. (2011). “Enhanced removal of Cr(VI) from aqueous solution using polypyrrole/Fe3O4 magnetic nanocomposite,” Journal of Hazardous Materials 190(1), 381-390. doi:https://doi.org/10.1016/j.jhazmat.2011.03.062.
Chen, C. L., Park, S.-W., Su, J. F., Yu, Y.-H., Heo, J.-e., Kim, K.-d., et al. (2019). “The adsorption characteristics of fluoride on commercial activated carbon treated with quaternary ammonium salts (Quats),” Science of The Total Environment 693, 133605. DOI: 10.1016/j.scitotenv.2019.133605.
Chen, Y., Shi, J., Rong, H., Zhou, X., Chen, F., Li, X., et al. (2020). “Adsorption mechanism of lead ions on porous ceramsite prepared by co-combustion ash of sewage sludge and biomass,” Science of The Total Environment 702, 135017. DOI: 10.1016/j.scitotenv.2019.135017.
Crini, G. (2008). “Kinetic and equilibrium studies on the removal of cationic dyes from aqueous solution by adsorption onto a cyclodextrin polymer,” Dyes and Pigments 77(2), 415-426. DOI: 10.1016/j.dyepig.2007.07.001.
El-Nahas, S., Osman, A. I., Arafat, A. S., Al-Muhtaseb, A. a. H., and Salman, H. M. (2020). “Facile and affordable synthetic route of nano powder zeolite and its application in fast softening of water hardness,” Journal of Water Process Engineering 33, 101104. DOI: 10.1016/j.jwpe.2019.101104.
Fan, J., Cai, W., and Yu, J. (2011). “Adsorption of N719 dye on anatase TiO2 nanoparticles and nanosheets with exposed (001) facets: Equilibrium, kinetic, and thermodynamic studies,” Chemistry: an Asian Journal 6(9), 2481-2490. DOI:10.1002/asia.201100188.
Gaikwad, M. A., Suryawanshi, M. P., Nikam, S. S., Bhosale, C. H., Kim, J. H., and Moholkar, A. V. (2016). “Influence of Zn concentration and dye adsorption time on the photovoltaic performance of M-SILAR deposited ZnO-based dye sensitized solar cells,” Journal of Photochemistry and Photobiology A: Chemistry 329, 246-254. DOI: 10.1016/j.jphotochem.2016.07.006.
Hızal, J., Kanmaz, N., and Yılmazoğlu, M. (2021). “Adsorption efficiency of sulfonated poly (ether ether ketone) (sPEEK) as a novel low-cost polymeric adsorbent for cationic organic dyes removal from aqueous solution,” Journal of Molecular Liquids 322, 114761. DOI: 10.1016/j.molliq.2020.114761.
Hu, Q., Liu, Y., Feng, C., Zhang, Z., Lei, Z., and Shimizu, K. (2018). “Predicting equilibrium time by adsorption kinetic equations and modifying Langmuir isotherm by fractal-like approach,” Journal of Molecular Liquids 268, 728-733. DOI: 10.1016/j.molliq.2018.07.113.
Isiuku, B. O., and Enyoh, C. E. (2020). “Pollution and health risks assessment of nitrate and phosphate concentrations in water bodies in South Eastern, Nigeria”. Environmental Advances 2, 100018. DOI: 10.1016/j.envadv.2020.100018.
Jiang, J., Kim, D. I., Dorji, P., Phuntsho, S., Hong, S., and Shon, H. K. (2019). “Phosphorus removal mechanisms from domestic wastewater by membrane capacitive deionization and system optimization for enhanced phosphate removal,” Process Safety and Environmental Protection 126, 44-52. DOI: 10.1016/j.psep.2019.04.005.
Jiang, Y.-H., Li, A.-Y., Deng, H., Ye, C.-H., Wu, Y.-Q., Linmu, Y.-D., and Hang, H.-L. (2019). “Characteristics of nitrogen and phosphorus adsorption by Mg-loaded biochar from different feedstocks,” Bioresource Technology 276, 183-189. DOI: 10.1016/j.biortech.2018.12.079.
Kim, W. K., Sung, Y. K., Yoo, H. S., and Kim, J. T. (2015). “Optimization of coagulation/flocculation for phosphorus removal from activated sludge effluent discharge using an online charge analyzing system titrator (CAST),” Journal of Industrial and Engineering Chemistry 21, 269-277. DOI: 10.1016/j.jiec.2014.02.034.
Liang, M., Wang, D., Zhu, Y., Zhu, Z., Li, Y., and Huang, C. P. (2018). “Nano-hematite bagasse composite (n-HBC) for the removal of Pb(II) from dilute aqueous solutions,” Journal of Water Process Engineering 21, 69-76. DOI: 10.1016/j.jwpe.2017.11.014.
Liao, T., Li, T., Su, X., Yu, X., Song, H., Zhu, Y., and Zhang, Y. (2018). “La(OH)3-modified magnetic pineapple biochar as novel adsorbents for efficient phosphate removal,” Bioresource Technology 263, 207-213. DOI: 10.1016/j.biortech.2018.04.108.
Liu, X., Shen, F., and Qi, X. (2019). “Adsorption recovery of phosphate from aqueous solution by CaO-biochar composites prepared from eggshell and rice straw,” Science of The Total Environment 666, 694-702. DOI: 10.1016/j.scitotenv.2019.02.227.
Lv, X., Jiang, G., Xue, X., Wu, D., Sheng, T., Sun, C., et al. (2013). “Fe0-Fe3O4 nanocomposites embedded polyvinyl alcohol/sodium alginate beads for chromium (VI) removal,” Journal of Hazardous Materials 262, 748-758. DOI: 10.1016/j.jhazmat.2013.09.036.
Mahmoud, E., El Baroudy, A., Ali, N., and Sleem, M. (2020). “Spectroscopic studies on the phosphorus adsorption in salt-affected soils with or without nano-biochar addi-tions,” Environmental Research 184, 109277. DOI: 10.1016/j.envres.2020.109277.
Marshall, J. A., Morton, B. J., Muhlack, R., Chittleborough, D., and Kwong, C. W. (2017). “Recovery of phosphate from calcium-containing aqueous solution resulting from biochar-induced calcium phosphate precipitation,” Journal of Cleaner Production 165, 27-35. DOI: 10.1016/j.jclepro.2017.07.042.
Md. Munjur, H., Hasan, M. N., Awual, M. R., Islam, M. M., Shenashen, M. A., and Iqbal, J. (2020). “Biodegradable natural carbohydrate polymeric sustainable adsorbents for efficient toxic dye removal from wastewater,” Journal of Molecular Liquids 319, 114356. DOI: 10.1016/j.molliq.2020.114356.
Oginni, O., Yakaboylu, G. A., Singh, K., Sabolsky, E. M., Unal-Tosun, G., Jaisi, D., et al. (2020). “Phosphorus adsorption behaviors of MgO modified biochars derived from waste woody biomass resources,” Journal of Environmental Chemical Engineering 8(2), 103723. DOI: 10.1016/j.jece.2020.103723.
Özacar, M. (2003). “Adsorption of phosphate from aqueous solution onto alunite,” Chemosphere 51(4), 321-327. DOI: 10.1016/S0045-6535(02)00847-0.
Özlem Kocabaş-Ataklı, Z., and Yürüm, Y. (2013). “Synthesis and characterization of anatase nanoadsorbent and application in removal of lead, copper and arsenic from water,” Chemical Engineering Journal 225, 625-635. DOI:10.1016/j.cej.2013.03.106.
Qamouche, K., Chetaine, A., Elyahyaoui, A., Moussaif, A., Touzani, R., Benkdad, A., et al. (2020). “Radiological characterization of phosphate rocks, phosphogypsum, phosphoric acid and phosphate fertilizers in Morocco: An assessment of the radiological hazard impact on the environment,” Materials Today: Proceedings 27, 3234-3242. DOI: 10.1016/j.matpr.2020.04.703.
Qiao, Y., Wu, J., Xu, Y., Fang, Z., Zheng, L., Cheng, W., Tsang, E. P., Fang, J, and Zhao, D. (2017). “Remediation of cadmium in soil by biochar-supported iron phosphate nanoparticles,” Ecological Engineering 106, 515-522. DOI: 10.1016/j.ecoleng.2017.06.023.
Rajapaksha, A. U., Chen, S. S., Tsang, D. C. W., Zhang, M., Vithanage, M., Mandal, S., et al. (2016). “Engineered/designer biochar for contaminant removal/immobilization from soil and water: Potential and implication of biochar modification,” Chemosphere 148, 276-291. DOI:10.1016/j.chemosphere.2016.01.043.
Rupa, M. J., Pal, A., and Saha, B. B. (2020). “Activated carbon-graphene nanoplatelets based green cooling system: Adsorption kinetics, heat of adsorption, and thermodynamic performance,” Energy 193, 116774. DOI: 10.1016/j.energy.2019.116774.
Sano, A., Kanomata, M., Inoue, H., Sugiura, N., Xu, K.-Q., and Inamori, Y. (2012). “Extraction of raw sewage sludge containing iron phosphate for phosphorus recovery,” Chemosphere 89(10), 1243-1247. DOI: 10.1016/j.chemosphere.2012.07.043.
Sheth, Y., Dharaskar, S., Khalid, M., and Sonawane, S. (2021). “An environment friendly approach for heavy metal removal from industrial wastewater using chitosan based biosorbent: A review,” Sustainable Energy Technologies and Assessments 43, 100951. DOI: 10.1016/j.seta.2020.100951.
Shi, Z.-l., Liu, F.-m., and Yao, S.-h. (2011). “Adsorptive removal of phosphate from aqueous solutions using activated carbon loaded with Fe(III) oxide,” New Carbon Materials 26(4), 299-306. DOI: 10.1016/s1872-5805(11)60083-8.
Sima, T. V., Letshwenyo, M. W., and Lebogang, L. (2018). “Efficiency of waste clinker ash and iron oxide tailings for phosphorus removal from tertiary wastewater: Batch studies,” Environmental Technology & Innovation 11, 49-63. DOI: 10.1016/j.eti.2018.04.008.
Tang, Q., Shi, C., Shi, W., Huang, X., Ye, Y., Jiang, W., Kang, J., Liu, D., Ren, Y., and Li, D. (2019). “Preferable phosphate removal by nano-La(III) hydroxides modified mesoporous rice husk biochars: Role of the host pore structure and point of zero charge,” Science of the Total Environment 662, 511-520. DOI: 10.1016/j.scitotenv.2019.01.159.
Vikrant, K., Kim, K.-H., Ok, Y. S., Tsang, D. C. W., Tsang, Y. F., Giri, B. S., and Singh, R. (2018). “Engineered/designer biochar for the removal of phosphate in water and wastewater,” Science of the Total Environment 616-617, 1242-1260. DOI: 10.1016/j.scitotenv.2017.10.193.
Wang, L., Wang, J., He, C., Lyu, W., Zhang, W., Yan, W., et al. (2019). “Development of rare earth element doped magnetic biochars with enhanced phosphate adsorption performance,” Colloids and Surfaces A: Physicochemical and Engineering Aspects 561, 236-243. DOI: 10.1016/j.colsurfa.2018.10.082.
Wang, N., Si, Y., Yu, J., Fong, H., and Ding, B. (2017). “Nano-fiber/net structured PVA membrane: Effects of formic acid as solvent and crosslinking agent on solution properties and membrane morphological structures,” Materials & Design 120, 135-143. DOI: 10.1016/j.matdes.2017.02.007.
Wei, C., Huang, Y., Liao, Q., Xia, A., Zhu, X., and Zhu, X. (2019). “Adsorption thermodynamic characteristics of Chlorella vulgaris with organic polymer adsorbent cationic starch: Effect of temperature on adsorption capacity and rate.” Bioresource Technology 293, 122056. DOI: 10.1016/j.biortech.2019.122056.
Wong, Y. C., Szeto, Y. S., Cheung, W. H., and Mckay, G. (2004). “Pseudo-first-order kinetic studies of the sorption of acid dyes onto chitosan,” Journal of Applied Polymer Science 92(3), 1633-1645.
Yang, F., Zhang, S., Sun, Y., Tsang, D. C. W., Cheng, K., and Ok, Y. S. (2019). “Assembling biochar with various layered double hydroxides for enhancement of phosphorus recovery,” Journal of Hazardous Materials 365, 665-673. DOI: 10.1016/j.jhazmat.2018.11.047.
Ye, J., Cong, X., Zhang, P., Hoffmann, E., Zeng, G., Wu, Y., et al. (2015). “Phosphate adsorption onto granular-acid-activated-neutralized red mud: Parameter optimization, kinetics, isotherms, and mechanism analysis,” Water, Air, & Soil Pollution 226(9), 306. DOI:10.1007/s11270-015-2577-1.
Yoon, S.-Y., Lee, C.-G., Park, J.-A., Kim, J.-H., Kim, S.-B., Lee, S.-H., and Choi, J.-W. (2014). “Kinetic, equilibrium and thermodynamic studies for phosphate adsorption to magnetic iron oxide nanoparticles,” Chemical Engineering Journal 236, 341-347. DOI:10.1016/j.cej.2013.09.053.
Zhang, Z., Yan, L., Yu, H., Yan, T., and Li, X. (2019). “Adsorption of phosphate from aqueous solution by vegetable biochar/layered double oxides: Fast removal and mechanistic studies,” Bioresource Technology 284, 65-71. DOI: 10.1016/j.biortech.2019.03.113.
Zhu, Y., Liang, M., Lu, R., Zhang, H., Zhu, Z., You, S., Liu, J., and Liu, H. (2011). “Phosphorus removal from aqueous solution by the fe(iii)-impregnated sorbent prepared from sugarcane bagasse,” Fresenius Environmental Bulletin 20(5A), 1288-1296.
Zhu, Z., Huang, C. P., Zhu, Y., Wei, W., and Qin, H. (2018). “A hierarchical porous adsorbent of nano-α-Fe2O3/Fe3O4 on bamboo biochar (HPA-Fe/C-B) for the removal of phosphate from water,” Journal of Water Process Engineering 25, 96-104. DOI: 10.1016/j.jwpe.2018.05.010.
Article submitted: June 3, 2020; Peer review completed: August 23, 2020; Revised version received and accepted: December 29, 2020; Published: January 5, 2021.
DOI: 10.15376/biores.16.1.1335-1357
APPENDIX
Supplementary Information
Preparation of Unmodified Bagasse Biochar (BBC)
Any remaining sugar was rinsed from the bagasse thoroughly. Then, bagasse was dried using an electric constant-temperature blast-drying oven at 80°C. The dried bagasse was placed into a porcelain crucible, which was placed in the muffle furnace for calcination, grinding, and screening at 450°C. Then BBC was prepared.
Stability of BMBC
The concentrations of iron in the adsorption equilibrium of BMBC for the adsorption of phosphorus which contains water (the concentration of phosphorus is 2.0 mg L-1) were determined under different initial pH values (Table S1). The initial pH ranged from 2.0 to 12.0 (balanced pH of 2.3 to 11.4), At an initial pH of 2.0 and 3.0 (balanced pH of 2.3 and 3.0), the iron concentrations in the solution were 5.26 and 1.61 mg L-1, which was lower than 0.2 mg L-1 in the pH change from 4.0 to 10.0, which shows that the BMBC was stable under the pH range from 4.0 to 10.0 and does not cause secondary pollution and could be used in industry.
Table S1. Effect of pH on BMBC Dissolution

Other Adsorption Kinetics Equations and Figures


Fig. S1. Fitting curves of pseudo-first-order kinetic equations of the BIBC adsorption of phosphorus

Fig. S2. Fitting curves of Bangham kinetic equations of the BIBC adsorption of phosphorus

Fig. S3. Fitting curves of Elovich kinetic equations of the BIBC adsorption of phosphorus
Other Adsorption Isotherm Figure

Fig. S4. Isotherm plots for Freundlich equations of the BIBC adsorption of phosphorus
Energy Dispersive Spectrometric Analysis

Fig. S5 Energy dispersive spectrometric before adsorption (a) and after adsorption (b)
Equations S1 to S9
