
Abstract
p–p stacking of the aromatic groups in SL. Results show that the charge-free aromatic groups of SL tend to form oriented p–p stacking with the spectroscopic characteristics of J–aggregates. The formation of J–aggregates in SL are recognized by a significant spectral red shift in fluorescent excitation spectra. The other effects that may cause spectral shift, such as the SL species, solvent effect, and the impurities, are investigated to confirm that the formation of J-aggregates is the only viable explanation for the significant spectral redshift of SL. causes molecular shrinkage of SL polyelectrolytes, but has no influence on J–aggregates of the aromatic groups as detected by lack of spectral shift, indicating that the aromatic groups are charge-free. This suggests that not all the aromatic groups but only the charge-free aromatic groups can form p–p stacking. This work demonstrates the presence of J–aggregation in aqueous SL solutions for the first time, which gives an insight in understanding the preferred orientation of the aromatic groups in lignin-based biopolymers.
Download PDF
Full Article
Pi–pi stacking of the aromatic groups in Lignosulfonates
Yonghong Deng, Xinjia Feng, Dongjie Yang, Chonghua Yi, and Xueqing Qiu*
Sodium lignosulfonate (SL) fractions with narrow molecular weight distribution and known salt content were used to investigate ![]() stacking of the aromatic groups in SL. Results show that the charge-free aromatic groups of SL tend to form oriented
stacking of the aromatic groups in SL. Results show that the charge-free aromatic groups of SL tend to form oriented ![]() stacking with the spectroscopic characteristics of J–aggregates. The formation of J–aggregates in SL are recognized by a significant spectral red shift in fluorescent excitation spectra. The other effects that may cause spectral shift, such as the SL species, solvent effect, and the impurities, are investigated to confirm that the formation of J-aggregates is the only viable explanation for the significant spectral redshift of SL. Salt causes molecular shrinkage of SL polyelectrolytes, but has no influence on J–aggregates of the aromatic groups as detected by lack of spectral shift, indicating that the aromatic groups are charge-free. This suggests that not all the aromatic groups but only the charge-free aromatic groups can form
stacking with the spectroscopic characteristics of J–aggregates. The formation of J–aggregates in SL are recognized by a significant spectral red shift in fluorescent excitation spectra. The other effects that may cause spectral shift, such as the SL species, solvent effect, and the impurities, are investigated to confirm that the formation of J-aggregates is the only viable explanation for the significant spectral redshift of SL. Salt causes molecular shrinkage of SL polyelectrolytes, but has no influence on J–aggregates of the aromatic groups as detected by lack of spectral shift, indicating that the aromatic groups are charge-free. This suggests that not all the aromatic groups but only the charge-free aromatic groups can form ![]() stacking. This work demonstrates the presence of J–aggregation in aqueous SL solutions for the first time, which gives an insight in understanding the preferred orientation of the aromatic groups in lignin-based biopolymers.
stacking. This work demonstrates the presence of J–aggregation in aqueous SL solutions for the first time, which gives an insight in understanding the preferred orientation of the aromatic groups in lignin-based biopolymers.
Keywords: Lignosulfonate; – Stacking; J-aggregation
Contact information: State Key Lab of Pulp&Paper Engineering, School of Chemistry and Chemical Engineering, South China University of Technology, 381 Wushan Road, Guangzhou, 510640, China; *Corresponding author:Xueqingqiu66@163.com.
INTRODUCTION
Industrial lignin has recently attracted worldwide attention because it can be used as a sustainable alternative to nonrenewable materials (Lora and Glasser 2002). Sodium lignosulfonate (SL) is a byproduct in the waste liquor from acid sulfite pulp mills, and the modified SL has wide application as a polyanion surfactant (Zhou et al. 2007). How to utilize SL with high efficiency is still of great challenge; a better understanding of SL basic structures and properties is required to improve its value–added application.
Anisotropic structures are widely found in lignin derivatives. Jurasek investigated the morphology of computer–modeled lignin structures and found a preferred orientation of the phenyl–propane units of lignin along the cellulose microfibrils (Jurasek 1996). Akerholm and Salmen also demonstrated that there was a preferred orientation of the aromatic groups of lignin along the fiber axis in spruce tracheids (Akerholm and Salmen 2003).
The preferred orientation of the aromatic groups may be related to the – interaction. The ![]() interaction of the aromatic groups in lignin may result in two well-directed
interaction of the aromatic groups in lignin may result in two well-directed ![]() aggregation modes: H– and J–aggregation (James 1977). For lignin-based biopolymers, the
aggregation modes: H– and J–aggregation (James 1977). For lignin-based biopolymers, the ![]() aggregation between the aromatic groups has been widely reported (Sarkanen et al. 1984; Guerra et al. 2007; Deng et al. 2011), but the type of
aggregation between the aromatic groups has been widely reported (Sarkanen et al. 1984; Guerra et al. 2007; Deng et al. 2011), but the type of ![]() aggregation of SL in aqueous solutions is still unclear.
aggregation of SL in aqueous solutions is still unclear.
In the current work, we studied stacking of the aromatic groups of SL in aqueous solution, and the type of aggregation was recognized by a spectral shift in fluorescence excitation spectra. To confirm that the formation of aggregates, the other effects that may cause spectral shift, such as the SL species, solvent effect, and the impurities were also investigated. The related result not only gives a significant insight in understanding the basic structure of lignin biopolymers, but also provides academic instruction in the recovery of lignin from spent liquor for value–added applications.
EXPERIMENTAL
Materials
The raw sodium lignosulfonate (SL), recovered from pulping red liquor, was supplied by Shixian Papermaking Co. Ltd (China). The raw SL dissolved in deionized water was first filtered to remove the insoluble solid matter. The filtered SL was then ultrafiltered through an ultrafiltration apparatus (Wuxi Membrane Science and Technology Co., China) with a 1000 Dalton (Da) cutoff membrane. SL fractions with low polydispersity index were obtained through the method of gel column chromatographic separation as described elsewhere (Ouyang et al. 2010). The SL fractions were further treated by column chromatography with ultrapure water as eluting solvent, which was followed by dialysis against ultrapure water to remove salt. For comparison, a commercial SL was purchased from Sigma-Aldrich (SLSA), which has an averaged Mw of 52000 with a polydispersity index of 7.4.
Water used in this work was ultrapure water obtained from a Millipore water purification system, and the water resistivity was larger than 18 MΩ·cm. The other reagents were purchased commercially as analytical grade products and used directly without further purification unless otherwise indicated.
Characterization
The molecular weights and their distributions of SL were determined by gel permeation chromatography (GPC) with Ultrahydragel 120 and Ultrahydragel 250 columns. The 0.10 mol/L NaNO3 aqueous solution with pH 8 was used as the eluent at a flow rate of 0.5 mL/min. Poly(styrene sulfonate) (PSS) with low polydispersity index was employed as the standard substance to calibrate the GPC instrument (Contreras et al. 2008).
The contents of the carboxyl, phenolic, and sulfonic groups of SL were measured according to the methods described by Lin and Dence (1992). The UV–vis absorption measurements were performed with a UV–Vis spectrophotometer (UV–2450, Shimadzu Corp., Japan). The fluorescence measurements were performed on a Fluorosens System (Gilden Photonics Ltd., England) equipped with a 150 W Xenon arc lamp at 298 K.
RESULTS AND DISCUSSION
The sodium lignosulfonate was carefully purified by filtering, ultrafiltration, gel chromatographic separation, and dialysis. SL fractions with low polydispersity index were obtained by use of gel column chromatographic separation (Ouyang et al. 2010). Figure 1 shows the molecular weight distribution of SL0 (before separation) and its three fractions (SL1, SL2, SL3, after separation). Obviously, each SL fraction had a narrow molecular weight distribution after gel column chromatographic separation. Raw SL usually contains various salts that affect the properties of SL significantly, so each SL fraction was further treated by column chromatography with ultrapure water as an eluant, and then treated by dialysis against ultrapure water to remove salts. The final SL samples after dialysis were considered as “salt–free” samples.

Fig. 1. Weight-average Mw distributions (by GPC) of SL0 and its three fractions
Pi–pi stacking of Aromatic Groups
Since aromatic groups are the basic units of SL, there exists a strong – interaction between these aromatic groups. The ![]() interaction may result in two types of
interaction may result in two types of ![]() aggregation based on the arrangement of the aromatic groups: H– and J–aggregation (James 1977). According to McRae and Kasha (1964), H– and J–aggregation depend on the tilt angle between the molecular axis connecting the center of chromophores in the aggregate and a transition dipole moment of each chromophore (Fig. 2). When <54.7, the aromatic groups form J–aggregates having a bathochromic shift (J–band) to the monomer absorption band (M–band); when >54.7, the aromatic groups form H-aggregates showing a hypsochromic shift (H–band) to the M–band. The arrangement of the aromatic groups in lignin can be speculated according to their spectral response to solution conditions.
aggregation based on the arrangement of the aromatic groups: H– and J–aggregation (James 1977). According to McRae and Kasha (1964), H– and J–aggregation depend on the tilt angle between the molecular axis connecting the center of chromophores in the aggregate and a transition dipole moment of each chromophore (Fig. 2). When <54.7, the aromatic groups form J–aggregates having a bathochromic shift (J–band) to the monomer absorption band (M–band); when >54.7, the aromatic groups form H-aggregates showing a hypsochromic shift (H–band) to the M–band. The arrangement of the aromatic groups in lignin can be speculated according to their spectral response to solution conditions.
Because of the basic structure of phenyl–propanoid units (C9 units), SL strongly absorbs UV-vis light and emits fluorescence (Lin and Dence 1992; Albinsson et al. 1999). When the concentration of SL was low (< 0.1 g/L), both UV-vis absorption and fluorescent excitation spectra showed no change in spectral shape with concentration (Fig. 3), which gives no sign indicating ![]() stacking of the aromatic groups. There was a difference between the fluorescent excitation and UV–vis absorption spectra of SL. The maximum absorption peak at 280 nm found in the UV–vis spectra was not the maximum peak in the excitation spectra of SL. This difference between the excitation and absorption spectra suggests that the maximum emission at 530 nm is not mainly derived from the excitation of the characteristic band at 280 nm, but from the tail band in the range of 290 to 520 nm. The fluorescence properties of lignin materials and the origin of fluorescence have been widely reported (Albinsson et al. 1999). Because a simple substi-tuted benzene ring cannot give rise to this kind of fluorescence band, it must have its origin in the C9 units connecting with large conjugated systems formed in the pulping process or
stacking of the aromatic groups. There was a difference between the fluorescent excitation and UV–vis absorption spectra of SL. The maximum absorption peak at 280 nm found in the UV–vis spectra was not the maximum peak in the excitation spectra of SL. This difference between the excitation and absorption spectra suggests that the maximum emission at 530 nm is not mainly derived from the excitation of the characteristic band at 280 nm, but from the tail band in the range of 290 to 520 nm. The fluorescence properties of lignin materials and the origin of fluorescence have been widely reported (Albinsson et al. 1999). Because a simple substi-tuted benzene ring cannot give rise to this kind of fluorescence band, it must have its origin in the C9 units connecting with large conjugated systems formed in the pulping process or ![]() stacking of the aromatic groups.
stacking of the aromatic groups.
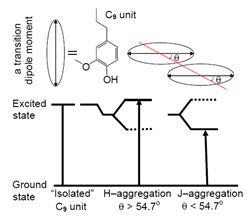
Fig. 2. Schematic representation of the arrangement for H and J aggregation and their different energy levels. is defined as the tilt angle between the axis connecting the center of chromophores in the aggregate and a transition dipole moment of each chromophore. Here, the chromophore is C9 unit of SL connecting with large conjugated systems formed in the pulping process.

Fig. 3. (a) Fluorescent excitation spectra of SL2 in water with low concentrations, monitored at 530 nm. (b) UV–vis absorption spectra of SL in water with low concentrations.
When concentration of SL was larger than 0.1 g/L, UV-vis absorption spectra of SL could not be measured because of the UV-vis spectrometer’s measurement limit, but the fluorescent excitation spectra could be measured for detecting the spectral response to ![]() stacking of the aromatic groups. Figure 4 shows the emission spectra and the excitation spectra of SL2 in water with different concentrations ( 0.1 g/L). Obviously, the fluorescent intensity increased with increasing concentrations, and the corresponding excitation spectra exhibited a significant spectral change in shape. Initially, SL gave a wide excitation band ranging from 250 to 520 nm. When the concentration increases, the intensity of the blue-shifted peaks in the excitation spectra shrank significantly, but that of the red-shifted peaks was strengthened. Based on the theory of J–band (Egorov 2009), this spectral shift provides an insight in the occurrence of
stacking of the aromatic groups. Figure 4 shows the emission spectra and the excitation spectra of SL2 in water with different concentrations ( 0.1 g/L). Obviously, the fluorescent intensity increased with increasing concentrations, and the corresponding excitation spectra exhibited a significant spectral change in shape. Initially, SL gave a wide excitation band ranging from 250 to 520 nm. When the concentration increases, the intensity of the blue-shifted peaks in the excitation spectra shrank significantly, but that of the red-shifted peaks was strengthened. Based on the theory of J–band (Egorov 2009), this spectral shift provides an insight in the occurrence of ![]() stacking of the aromatic groups with the spectral feature of J–aggregates. SL is assumed to have the characteristic absorption peak at 280 nm for M–band. The tail band ranging from 290 to 520 nm is partly attributed to polydisperse J-type aggregates of the aromatic groups generated from
stacking of the aromatic groups with the spectral feature of J–aggregates. SL is assumed to have the characteristic absorption peak at 280 nm for M–band. The tail band ranging from 290 to 520 nm is partly attributed to polydisperse J-type aggregates of the aromatic groups generated from ![]() stacking. With concentration increase, more and more aromatic groups form
stacking. With concentration increase, more and more aromatic groups form ![]() stacking with the spectral feature of J–aggregates, resulting in a decrease in intensity of the M–band and in increase in intensity of the J–band.
stacking with the spectral feature of J–aggregates, resulting in a decrease in intensity of the M–band and in increase in intensity of the J–band.

Fig. 4. (a) Fluorescent emission spectra of SL2 in water with high concentrations, λexc = 450 nm; and (b) Excitation spectra of SL2 in water, monitored at 530 nm
Why did SL show no spectral shift when the concentration was in the low range, whereas it did when the concentration was in the high range? It is proposed that SL may form J–aggregates with different degrees of aggregation in low and high concentration ranges. As the – attraction is a short range interaction, J–aggregation can occur only when the aromatic groups approach each other at a distance small enough to experience a coupling effect and energy splitting (McRae and Kasha 1964). In aqueous solutions, the hydrophobic aromatic groups in SL tend to come together in order to minimize the entropic loss, and the hydrophilic functional groups extend into water to keep SL molecules stable in water. Although SL is swollen in the low concentration range (< 0.1 g/L), some aromatic groups may approach each other due to the effect of diffusion and then form a stable J–aggregate with a low aggregated number because of strong ![]() attraction. Under such conditions there exists an equilibrium between “isolated” aromatic groups and polydisperse J–aggregates, and the ratio of the “isolated” aromatic groups to the J–aggregates has no change with increasing concentrations; therefore, there is no change in spectral shape of SL when concentration increases. It is reasonable that J-aggregates with a higher aggregated number may occur in a high concentration range (0.1 g/L). When the concentration of SL further increases, more and more “isolated” aromatic groups form J-aggregates, and more and more J-aggregates with a lower degree of aggregation form other stable J-aggregates with a higher degree of aggregation. Therefore, there is a shrinking in intensity of the excitation band with shorter wavelength, and a strengthening in intensity of the excitation band with longer wavelength.
attraction. Under such conditions there exists an equilibrium between “isolated” aromatic groups and polydisperse J–aggregates, and the ratio of the “isolated” aromatic groups to the J–aggregates has no change with increasing concentrations; therefore, there is no change in spectral shape of SL when concentration increases. It is reasonable that J-aggregates with a higher aggregated number may occur in a high concentration range (0.1 g/L). When the concentration of SL further increases, more and more “isolated” aromatic groups form J-aggregates, and more and more J-aggregates with a lower degree of aggregation form other stable J-aggregates with a higher degree of aggregation. Therefore, there is a shrinking in intensity of the excitation band with shorter wavelength, and a strengthening in intensity of the excitation band with longer wavelength.
It is worthwhile to emphasize that J–aggregation of the aromatic groups is different from the molecular aggregation of SL. Firstly, molecular aggregation does not proceed with energy transfer, but J–aggregation is always accompanied by energy splitting. Secondly, J–aggregation is only driven by ![]() interaction, but molecular aggregation can be driven by various van der Waals attractions other than
interaction, but molecular aggregation can be driven by various van der Waals attractions other than ![]() interaction. Thirdly, J–aggregation can only be identified by a spectral redshift in fluorescent and UV–Vis absorption spectra because of energy splitting, but molecular aggregation can be identified by many methods including light scattering measurement. As a result, Jaggregation of the chromophores does not necessarily result in molecular aggregation, and vice versa. In the literature, the molecular aggregation of lignin driven by hydrogen bonding as suggested by Lindstrom is not accompanied by aggregation of the aromatic rings (Lindstrom 1979). But the molecular aggregation driven by the
interaction. Thirdly, J–aggregation can only be identified by a spectral redshift in fluorescent and UV–Vis absorption spectra because of energy splitting, but molecular aggregation can be identified by many methods including light scattering measurement. As a result, Jaggregation of the chromophores does not necessarily result in molecular aggregation, and vice versa. In the literature, the molecular aggregation of lignin driven by hydrogen bonding as suggested by Lindstrom is not accompanied by aggregation of the aromatic rings (Lindstrom 1979). But the molecular aggregation driven by the ![]() interaction as proposed by Sarkanen et al. is a kind of aggregation accompanied by molecular aggregation (Sarkanen 1984).
interaction as proposed by Sarkanen et al. is a kind of aggregation accompanied by molecular aggregation (Sarkanen 1984).
Other Origins of Spectral Shifts vs. J-aggregation
To confirm that the formation of J-aggregates is the only justifiable explanation for the significant spectral redshift of SL with increasing concentration, we investigated other effects that may cause spectral shift, such as the SL species, solvent effect, and the impurities, including the coloured complexes between the transition metal ions and SL.
For comparison, SL solutions obtained from Shixian (SL0, SL1, SL2, SL3), and Sigma-Aldrich (SLSA) were all measured by fluorescence spectroscopy. All the excitation spectra of SLSA,SL0 and SL fractions exhibited a significant spectral redshift with increasing concentrations. The excitation spectra of SL fractions (SL1, SL2, SL3) with the same concentration did not have an obvious change with increasing molecular weight (Fig. 5). When the concentration was changed from 0.04 to 0.2 g/L, SL fractions showed the same spectral redshift because of J-aggregation. Evidently, when compared with the significant effect of J-aggregation on spectral redshift, the effect of SL species on the spectral shift was negligible.
Usually the solvent effect has a great influence on spectral shift of organic molecules (James 1977), but it is negligible when compared with J-aggrgation. Three solvents are selected for SL, namely, DMF, THF/H2O=1:1 (v/v), and H2O. Obviously, all the SL samples dissolved in the three solvents showed a significant spectral shift with concentration. However, the excitation spectra of SL with the same concentration in the three solvents showed only slight differences (Fig. 6). Clearly, the spectral change caused by solvent effect was much weaker than that caused by J-aggregation.
The large redshift of SL with increasing concentration is not likely caused by impurities. Firstly, the three SL fractions (SL1, SL2, SL3) had been carefully purified by gel chromatographic separation, so the content of impurities should be very low. Second-ly, if there had been impurities in SL affecting the fluorescence spectra, the different SL fractions should have had different content of impurities after GPC separation. It is not logical that all three SL fractions (SL1, SL2, SL3) would have the same impurity-related spectral redshift when the concentration was changed from 0.04 to 0.2 g/L (Fig. 5).

Fig. 5. Fluorescent exicitation spectra of SL fractions with different concentration in water, λexc = 450 nm: (a) 0.04 g/L; (b) 0.20 g/L.

Fig. 6. Fluorescent spectra of SL with different concentrations in various solvents: (a) DMF, emission spectra, ex=450 nm; (b) DMF, excitation spectra, em=530 nm; (c) THF/H2O=1:1 (v/v); excitation spectra, em=520 nm; (d) H2O, excitation spectra, em=530 nm
Finally, the most likely impurities that cause spectral shifts are transition metal ions formed in the pulping process. It is reported that the presence of transition metal ions in lignin has an important influence on absorption spectra because of the formation of coloured complexes between the transition metal ions and lignin (Zhang and Xi. 2003; Peart and Ni. 2001). Among the transition metal ions, such as Fe(III), Fe(II), Cu(II), Mn(II), and Al(III), the Fe(III) has the strongest effect on the absorption spectra (Zhang and Xi. 2003). We have measured the fluorescence spectra of SL with addition of these transition metal ions, and found that Fe(II), Cu(II), Mn(II) and Al(III) have no influence on the fluorescence spectral shift. Fe(III) does cause an obvious spectral change in the fluorescence spectra (Fig. 7), but it reduces the fluorescence intensity significantly, which is different from J-aggregation that increases fluorescent intensity. Moreover, it causes spectral blueshift in the emission spectra because of the formation of SL/Fe(III) coloured complexes, but J-aggregation causes no spectral blueshift in the emission spectra (Fig. 4a). Undoubtedly, the large spectral redshift of SL with increasing concentration is not caused by impurities.
By carefully comparing the effect of the SL species, solvent effect, and the impurities on spectral shift, we can conclude that the large spectral redshift of SL is only caused by J-aggregation of the aromatic groups in SL.

Fig. 7. Fluorescence spectra of SL2 in water with different FeCl3 concentrations: (a) Emission spectra, λexc = 450 nm; (b) Excitation spectra, λem = 530 nm
Effect of Salt on J-aggregation
Figure 8a shows normalized excitation spectra of 0.2 g/L SL in NaCl aqueous solutions with various ionic strengths. It is apparent that there was no spectral shift with a rise in ionic strength. When the concentration of SL was changed from 0.2 g/L to 0.8 g/L, the degree of J-aggregation did increase, but the spectra still showed no shift with increasing ionic strength (Fig. 8b). We consider that the aromatic groups in J–aggregates are charge–free, so the addition of salt did not cause any change of J–aggregation, as demonstrated by lack of spectral shift.
According to exciton coupling model (McRae and Kasha 1964; Egorov 2009), when two “isolated” aromatic group of SL form a J-type dimer, the excited level of the “isolated” chromophore splits into two levels upon dimerization: a lower and a higher energy level (Fig. 2). The energy splitting is given by
 (1)
(1)
where K is a coulombic interaction constant, u is the transition dipole moments of the chromophores, R is the distance between the centers of masses of the chromophores, and is the tilt angle between the molecular axis and a transition dipole moment.
According to Eq. 1, any change in distance (R) and tilt angle (![]() ) of aromatic groups will result in a change in the energy splitting . If the aromatic groups in J–aggregates are not charge–free, then addition of salt will reduce the electrostatic repulsion and cause a change in the arrangement of the aromatic groups. However, the value of E showed no change and the excitation spectra exhibited no shift at various ionic strengths (Fig. 8). Therefore, it can be deduced that the aromatic groups in J–aggregates are charge–free, and the addition of salt does not cause any change in the arrangement of aromatic groups in J–aggregates.
) of aromatic groups will result in a change in the energy splitting . If the aromatic groups in J–aggregates are not charge–free, then addition of salt will reduce the electrostatic repulsion and cause a change in the arrangement of the aromatic groups. However, the value of E showed no change and the excitation spectra exhibited no shift at various ionic strengths (Fig. 8). Therefore, it can be deduced that the aromatic groups in J–aggregates are charge–free, and the addition of salt does not cause any change in the arrangement of aromatic groups in J–aggregates.
Aromatic groups are the basic groups of SL, and some of the aromatic groups are connected with charged groups during the pulping process. It is well known that salt cause a significant molecular shrinkage of SL polyelectrolytes. However, salt has no influence on the J–aggregates, suggesting that not all the aromatic groups but only the charge-free aromatic groups can form J-aggregates.

Fig. 8. Normalized excitation spectra of SL with addition of NaCl solutions at different salt concentrations, monitored at 530 nm. (a) 0.8 g/L SL solutions; (b) 0.2 g/L SL solutions
Arrangement of Aromatic Groups in J-aggregates.
Figure 9 gives a schematic representation of J–aggregation of the aromatic groups in SL. Because SL is a complex biopolymer, it is not likely that all the aromatic groups in SL can be aligned in well–ordered “head–to–tail” arrangement (![]() = 0). For J–aggregation, the is negative, and the tilt angle is less than 54.7. Therefore, the “tilted card–pack” assembly with tilt angleless than 54.7 is the most probable arrangement for the aromatic groups in J–aggregates. This assembly can guarantee both the angle necessary for the J–aggregation and the small distance between the aromatic groups (McRae and Kasha 1964; Egorov 2009). We deduced that the anisotropic structure found in lignin derivatives (Akerholm and Salmen 2003) may derive from this J–aggregation of the aromatic groups.
= 0). For J–aggregation, the is negative, and the tilt angle is less than 54.7. Therefore, the “tilted card–pack” assembly with tilt angleless than 54.7 is the most probable arrangement for the aromatic groups in J–aggregates. This assembly can guarantee both the angle necessary for the J–aggregation and the small distance between the aromatic groups (McRae and Kasha 1964; Egorov 2009). We deduced that the anisotropic structure found in lignin derivatives (Akerholm and Salmen 2003) may derive from this J–aggregation of the aromatic groups.

Fig. 9. Schematic representation for J–aggregation of the aromatic groups in SL
SL molecules contain both charge-free aromatic groups and charged aromatic groups. In aqueous solutions, the charge-free aromatic groups in SL tend to come together in order to minimize the entropic loss, and the charged aromatic groups extend into water to keep SL molecules stable in solution. J–aggregation occurs when the charge-free aromatic groups approach each other at a distance small enough to experience a coupling effect, exhibiting a spectral redshift. The aromatic groups in J–aggregates arrange themselves with a preferred orientation, and their covalent connecting to the other aromatic backbones may force the SL macromolecule to adopt an anisotropic molecular structure.
CONCLUSIONS
- The aromatic groups of SL tend to form oriented
 stacking with the spectroscopic characteristics of J–aggregates. J–aggregation occurs when the aromatic groups approach each other at a distance small enough to experience a coupling effect, exhibiting a spectral redshift. The amount of stacking increases with increasing SL concentrations.
 - With addition of salt, molecular shrinkage is significant for the charged groups of SL, but the aromatic groups in stacking do not shrink as detected by lack of spectral shift, indicating that the aromatic groups involved with stacking are charge-free. It suggests that not all the aromatic groups can form stacking, but only the charge-free aromatic groups can form stacking.
ACKNOWLEDGMENTS
The authors thank the financial support of the China Excellent Young Scientist Fund (20925622), the National Natural Science Foundation of China (20976064, 21006036), and the National Basic Research Program of China (973 Program) (2010CB732205).
REFERENCES CITED
Akerholm, M., and Salmen, L. (2003). “The oriented structure of lignin and its viscoelastic properties studied by static and dynamic FT–IR spectroscopy,” Holzforschung. 57(5), 459-465.
Albinsson, B., Li, S. M., Lundquist, K., and Stomberg, R. (1999). “The origin of lignin fluorescence,” Journal of Molecular Structure 508(1-3), 19-27.
Contreras, S., Gaspar, A. R., Guerra, A., Lucia, L. A., and Argyropoulos, D. S. (2008). “Propensity of lignin to associate: Light scattering photometry study with native lignins,” Biomacromolecules 9(12), 3362-3369.
Deng, Y. H., Feng, X. J., Zhou, M. S., Qian, Y., and Qiu. X. Q. (2011). “Investigation of aggregation and assembly of alkali lignin using iodine as a probe,” Biomacromolecules 12(4), 1116-1125.
Egorov, V.V. (2009). “Theory of the J–band: From the Frenkel exciton to charge transfer,” Phys. Procedia. 2(2), 223-326.
Garver, T. M., and Callaghan, P. T. (1991). “Hydrodynamics of kraft lignins,” Macromolecules 24(2), 420-430.
Goring, D. A. I., Vuong, R., Gancet, C., and Chanzy, H. (1979). “The flatness of lignosulfonate macromolecules as demonstrated by electron microscopy,” J. Appl. Polym. Sci. 24(4), 931-936.
Guerra, A., Gaspar, A. R., Contreras, S., Lucia, L. A., Crestini, C., and Argyropoulos, D. S. (2007). “On the propensity of lignin to associate: A size exclusion chromatography study with lignin derivatives isolated from different plant species,” Phytochemistry 68(20), 2570-2583.
James, T. H. (1977). The Theory of the Photographic Process, Macmillan, New York.
Jurasek, L. (1996). “Morphology of computer–modeled lignin structure: Fractal dimensions, orientation and porosity,” J. Pulp Pap. Sci. 22(10), 376-380.
Lin, S. Y., and Dence, C. W. (1992). Methods in Lignin Chemistry, Springer–Verlag, Berlin.
Lindstrom, T. (1979). “The colloidal behaviour of kraft lignin,” Colloid Polym. Sci. 257(7), 277-285.
Lora, J. H., and Glasser, W. J. (2002). “Recent industrial applications of lignin: A sustainable alternative to nonrenewable materials,” J. Polym. Environ. 10(1-2), 39-48.
McRae, E. G., and Kasha, M. (1964). In: L. Augenstein, R. Mason, and B. Rosenberg (eds.), Physical Processes in Radiation Biology, Academic Press, New York.
Ouyang, X. P., Zhang, P., Tan, C. M., Deng, Y. H., Yang, D. J., and Qiu, X. Q. (2010). “Isolation of lignosulfonate with low polydispersity index,” Chin. Chem. Lett. 21(12), 1479-1481.
Peart, C., and Ni, Y. (2001). “UV-vis spectra of lignin model compounds in the presence of metal ions and chelants,” Journal of Wood Chemistry and Technology 21(2), 113-125.
Sarkanen, S., Teller, D. C., Stevens, C. R., and McCarthy, J. L. (1984). “Associative interactions between kraft lignin components,” Macromolecules 17(12), 2588-2597.
Zhang, J. P., and Xi, S. C. (2003). “Research on decoloration of waterlogged bamboo slips,” Sciences of Conservation and Archaeology 15(4), 37-42.
Zhou, M. S., Qiu, X. Q., Yang, D. J., Lou, H. M., and Ouyang, X. P. (2007). “High-performance dispersant of coal–water slurry synthesized from wheat straw alkali lignin,” Fuel Process Technol. 88(4), 375-382.
Article submitted: September 8, 2011; Peer review completed: October 23, 2011; Revised version received: November 1, 2011; Accepted: January 20, 2012; Published: January 23, 2012.