
Abstract
To increase the added value of corn stalk and improve the performance of corn stalk biochar, magnesium chloride (MgCl2) was used to modify biochar, and the effects of temperature on the structure and properties of modified biochar were considered. With the increase of temperature, the yield of biochar decreased. There was a marked increase in the number of mesopores and micropores, but the mesopore pore diameter changed to a smaller pore diameter, and the specific surface area remarkably increased. As the temperature increased, the content of C increased, while the range of H and O decreased. In addition, the number of oxygen-containing functional groups and methyl groups decreased, indicating that the structure of biochar became more aromatized. An obvious Mg(OH)2 crystal peak appeared in the X-ray diffraction pattern, which meant that Mg ions were loaded on the surface of biochar. Moreover, the highest removal rate of methylene blue dye by biochar was 83.6%. The authors conclude that temperature and magnesium chloride modification can improve and enhance the performance of corn stalk biochar. These findings will help deepen people’s understanding of biochar modification and serve as a reference for future related research.
Download PDF
Full Article
Preparation and Characterization of Modified Corn Stalk Biochar
Haifeng Zuo,a Xianxian Qin,b Zhigao Liu,a,* and Yunlin Fu b
To increase the added value of corn stalk and improve the performance of corn stalk biochar, magnesium chloride (MgCl2) was used to modify biochar, and the effects of temperature on the structure and properties of modified biochar were considered. With the increase of temperature, the yield of biochar decreased. There was a marked increase in the number of mesopores and micropores, but the mesopore pore diameter changed to a smaller pore diameter, and the specific surface area remarkably increased. As the temperature increased, the content of C increased, while the range of H and O decreased. In addition, the number of oxygen-containing functional groups and methyl groups decreased, indicating that the structure of biochar became more aromatized. An obvious Mg(OH)2 crystal peak appeared in the X-ray diffraction pattern, which meant that Mg ions were loaded on the surface of biochar. Moreover, the highest removal rate of methylene blue dye by biochar was 83.6%. The authors conclude that temperature and magnesium chloride modification can improve and enhance the performance of corn stalk biochar. These findings will help deepen people’s understanding of biochar modification and serve as a reference for future related research.
Keywords: Magnesium modified biochar; Corn stalk; Pyrolysis; Structural properties
Contact information: a: College of Resources Environment and Material, Guangxi University, Nanning, 530004 China; b: College of Forestry, Guangxi University, Nanning, 530004 China;
* Corresponding author: lzgk18@gxu.edu.cn
INTRODUCTION
China has a wide variety of crop stalk and a sizeable annual output, accounting for nearly one-third of the global production. However, hundreds of millions of tons of agricultural stalk waste material are produced every year (Sun et al. 2005; Li et al. 2017b), resulting in a serious amount of waste. The yield of corn stalk is enormous, accounting for more than half of the total stalk (Cao et al. 2018). Corn stalk contains a large amount of cellulose, hemicellulose, pectin, lignin, and other nutrients, which can be used for renewable energy, livestock feed, compost, wood bonding board, etc., so it has a high reusability value (Gong 2021). Currently, the primary utilization of corn stalks is to return them to fields and burn them (Tang and Yuan 2020), which causes resource waste and severe air pollution problems. Therefore, increased attention has been paid to the comprehensive utilization of corn stalk. In addition, the preparation of biochar from corn stalks has become a research hotspot to increase its value.
Biochar has been produced by pyrolysis of biomass under certain hypoxia conditions, which lead to products that are almost insoluble in water and highly aromatic. The liquid substances produced are tar, and the gaseous substances are CO, CO2, H2, etc. (Brewer et al. 2014; Antal and Gronli 2020). The particular structure and chemical properties of biochar enable it to be used in many fields. Biochar has a multi-porous structure, in which the microporous structure is well developed, with a large specific surface area and an overall highly aromatized structure, and the surface contains a large number of functional groups, such as carbonyl, carboxyl, hydroxyl, methyl, methylene, etc., resulting in a strong adsorption capacity (Ding 2014). Therefore, they were widely used in soil treatment (Steinbeiss et al. 2009), wastewater treatment (Huggins et al. 2016), and research in air purification (Qambrani et al. 2017). At the same time, biochar can also increase soil aeration and water retention and improve soil fertility (An et al. 2020b). In addition, it can also promote plant growth and improve crop yield (Lu et al. 2014; Asai et al. 2020).
Due to the limitations of preparation methods and its own factors, the biochar described above may have some unfavorable properties, such as uneven pore structure distribution and less polar functional groups on the surface (Kavitha et al. 2018). In addition, the application of biochar to soil is easily affected by temperature and the physical and chemical properties of the earth itself (Lehmann et al. 2011). Therefore, to obtain the superior performance of biochar for a certain application, it may be necessary to modify it. Modification of metal oxides can considerably improve the performance of biochar, among which magnesium chloride modified biochar (MCBCs) has the highest phosphorus adsorption capacity and the maximum value can reach 133 mg/g as reported in the literature (Yao et al. 2011a). The specific surface area of biochar can be remarkably increased by modification. A study by Yoshiyuti and Yutake (2003) showed that the specific surface area of unmodified carbon from sugarcane and rice husk was less than 100 m²/g, while after activation it was more than 200 m2/g. In recent years, there have also been many scholars devoted to the modification of corn stalk. For example, the aromatization degree of corn stalk biochar modified with manganese was improved, but the specific surface area was found to be lower than that of unmodified biochar at 400 to 600 ℃ (Tan et al. 2020), indicating that the modifier had a noticeable impact on the modification effect. Corn stalk was modified with magnesium chloride (MgCl2), magnesium acetate (Mg (CH3COO)2), and magnesium nitrate (Mg (NO3)2), and the ash content, hydrophilicity, micropore, and specific surface area of biochar increased (Yang et al. 2018). The yield of corn stalk biochar modified with magnesium chloride decreases with temperature; the specific surface area increases, and the addition of magnesium ions had no effect on the surface functional groups of biochar (Fang et al. 2014). Modification of corn stalk biochar with ZnCl2 resulted in closely arranged surface morphology, prominent microporous structure, increased mesopores, enhanced carbonyl absorption peaks, and enhanced Zn-OH diffraction peaks in X-ray diffraction (XRD) (An et al. 2020a). Because La2O3 has similar properties to MgO, the addition of lanthanum (La) to biochar increased the adsorption of NH4+, NO3-, and PO43- by 1.4 times, 3.0 times, and 1.9 times, respectively (Wang et al. 2015). In addition, after the wheat stalk was modified with a reducing agent, the removal rate of methylene blue dye by modified biochar was about 60% when the dosage was 20 mg, which was much higher than that of unmodified biochar (He 2017). Biochar containing N or P nutrients was used as a slow-release fertilizer to improve soil fertility, and it can sequester carbon for a long time (Yao et al. 2011b; Zhang et al. 2014; Jun et al. 2016).
In summary, recent research on corn stalk-modified biochar generally has concentrated on the use of different modifiers and raw materials, mainly in the fields of adsorption and soil. Whether it was adsorption or application to the ground, the final analysis has been focused on the structure and properties of modified biochar. However, in recent studies, few documents discuss the influence of magnesium ions on the design and properties of corn stalk biochar and the impact of different modification methods on the pore structure of biochar. Although there is a published report of its modification, the effect after modification was not good, such as a specific surface area that was lower than before conversion (Tan et al. 2020), Therefore, further evaluation is needed. Based on this, in this paper corn stalk was used as raw material and the modifier was MgCl2. The modified biochar was prepared by a two-step method with a pyrolysis temperature range of 300 to 600 °C. The properties of modified biochar at different temperatures were characterized and analyzed. Finally, methylene blue dye was selected for adsorption experiments.
EXPERIMENTAL
Materials
The raw material for biochar (corn stalk) comes from Mashan, Nanning Province, China. All chemicals used in the study were purchased from Tianjin Chemical Works, Tianjin, China. They were all of reagent grade and used without further purification. Corn stalk was dried under natural conditions, then crushed using a crusher (700Y; Wuyi Haina Electrical Appliances Co., Ltd., Jinhua, China) and screened with 2-mm mesh. The screened biomass was carbonized in a muffle furnace (MFLGKD406-12; Shanghai Mafu Furnace Technology Instrument Co., Ltd., Shanghai, China) at 300 °C for 1 h at a heating rate of 8 °C / min, and then slowly pyrolyzed in nitrogen gas to produce corn stalk biochar (referred to as CBC300). Subsequently, it was immersed in 1 mol/L MgCl2 solution and filtered after magnetic stirring at room temperature for 3 h. The filtered stalk raw material was put into an oven, dried at 80 °C for 6 h, and cooled naturally. Finally, pyrolyzed respectively at 300, 400, 500, and 600 °C in nitrogen gas (limited oxygen) for 1 h and heating rates of 8 °C/min (denoted as MCBC300, MCBC400, MCBC500, and MCBC600, respectively).
Methods
Characterization of biochar
First, the biochar was sprayed with gold (MSP-1S; Vacuum Device Inc., Tokyo, Japan). The surface morphology of was studied with a scanning electron microscope (S-3400N; Hitachi Ltd., Tokyo, Japan). The specific surface area, porosity, and pore volume of the prepared biochars were determined by N2 adsorption–desorption isotherms at −196 °C and measured with an automatic multi-station specific surface area and porosity analyzer (Gemini VII 2390; MacMerric Instrument Co., Ltd., Shanghai, China). First, the samples were degassed at 300 °C for 3 h. The surface area of prepared biochars were estimated by the Brunauer-Emmett-Teller method (BET) (Brunauer et al. 1938). The total pore volume was estimated as the liquid volume of N2 at high relative pressures (P/P0 = 0.995). Microporous specific surface area and microporous volume were calculated by the t-plot method. Finally, the Barrett-Joyner-Halenda (BJH) method was used to calculate the mesopore surface area and mesopore volume.
The yield of biochar was calculated based on the mass balance of Eq. 1,
where M1 and M2 are the masses (g) of modified biochar and biochar dried after impregnation with magnesium chloride solution, respectively.
The sample was crushed (100-mesh) and mixed thoroughly with KBr at a ratio of 5:100. After that, Fourier transform infrared spectroscopy (FTIR, Frontier, Thermo Fisher Scientific, Waltham, MA, USA) was used to determine the chemical groups of biochar between 4000 and 400 cm−1. Next, the crystal structure measurements were conducted with an X-ray diffraction machine (Rigaku, Tokyo, Japan) at 40 kV and 30 mA. The scanning speed was 2°/min, and the scanning angle was 5° to 65° (2θ). Finally, the elemental composition of biochar was determined by an elemental analyzer (Vario EL cube, Vario, Frankfurt, Germany).
Adsorption Methylene Blue Test
Experimental methods
In this study, 0.2 g each of biochar and four warm MCBC and 100 mL of methylene blue solution portions with an initial concentration of 45 mg/L were added to five conical flasks with a volume of 250 mL and sealed with a preservative film and placed in a constant temperature shaker at a temperature of 25 °C and a speed of 180 r/min for 24 h. After the reaction stopped, the samples were removed and left for 1 h and filtered with 0.22 μm filter membrane.
The absorbance of the filtrate was determined by an ultraviolet, visible spectrophotometer (Ultrospec 2100 por; Havo Biotechnology Co., Ltd, Shanghai, China). The removal rates of methylene blue (MB) by biochar and MCBCs at different temperatures were calculated. The calculation formula is shown in Eq. 2,
where R (%) is the removal rate of methylene blue after the adsorption experiment, C1 (mg/L) is the initial concentration of methylene blue solution, and C2 (mg/L) is the concentration of methylene blue solution after adsorption. A calibration curve for the absorbance as a function of the concentration of MB is provided in Fig. 1.

Fig. 1. The standard curve of MB
A certain amount of methylene blue stock solution (45 mg/L) was transferred to prepare a series of standard solutions with mass concentrations of 0, 1.2, 3, 6, 9, and 12 mg/L, and the absorbance was measured. The standard curve was drawn as y = 0.2181x + 0.2935, R2 = 0.9994, where y is the absorbance and X is the mass concentration of methylene blue (mg/L). The software Origin 2018C was used (OriginLab Company, Northampton, MA, USA).
RESULTS AND DISCUSSION
Yield, pH, and Ash Content of Biochar
The yield, pH, and ash content of biochar at different temperatures are shown in Table 1. It can be seen that the creation of biochar produced by the two-step method shows a downward trend as the temperature rises. The pH of modified biochar was approximately 8.65 at 600 °C, indicating that modified biochar was weakly alkaline. The influence of MgCl2 on the ash content of biochar was not as great as that of temperature. With the increase of pH and ash, the yield decreased from 91.4% to 59.15%, indicating that as the carbonization temperature increased, the degree of carbonization increased, resulting in high ash content and low biochar residues, which ultimately led to a decrease in yield.
In addition, there were related literature reports that some mineral elements contained in biochar ash, such as K, Ga, Mg, etc., exist in the form of carbonate or oxide, which was an essential reason for the alkalinity of biochar (Yuan et al. 2011). As the pyrolysis temperature increases, their contribution to the alkalinity of biochar also increases. That is, a higher ash content resulted in a higher pH value.
Table 1. The Yield, pH, and Ash Content of CBC-300 and MCBCs

Nitrogen Adsorption–Desorption Curve
It can be seen from Fig. 2 that the nitrogen adsorption-desorption curves at different temperatures were different. The adsorption capacity of modified biochar was higher than that of unmodified biochar at 300 ℃, indicating that temperature had a remarkable effect. Adsorption-desorption changes of CBC-300 and MCBC-300 were not obvious, which may be due to lower temperature and incomplete pore development, resulting in a decrease of absorption capacity (Liu et al. 2020). When the temperature reached 500 and 600 ℃, the adsorption curve of nitrogen increased linearly at a low relative pressure (P/P0 < 0.05), which may be due to the filling of micropores (Qin et al. 2020). In addition, at 500 and 600 ℃, the relative pressure (P/P0 < 0.08) was single-layer adsorption, and the relative pressure (0.08 < P / P0 < 0.4) was multi-layer adsorption. The inflection point (P/P0 ≈ 0.08) in the figure corresponds to the saturated adsorption capacity of a single layer of molecules. As the relative pressure continued to increase, when it reached a particular value (P/P0 = 0.4), the adsorbate underwent capillary agglomeration in the mesopores of biochar, and the adsorption capacity increased. When the relative pressure reached 1.0, the capillary condensation of all mesopores ended and a plateau appeared in the adsorption isotherm, which can be clearly observed as a hysteresis. Therefore, according to IUPAC classification, it belongs to class IV adsorption isotherm, indicating that MCBCs have smaller mesopores, which was also proved by BET analysis, as shown below. The modified biochar had the highest N2 adsorption capacity at 600 °C, with the maximum adsorption capacity reaching 78.9 cm3/g.

Fig. 2. Nitrogen adsorption/desorption curves of biochar prepared at different pyrolysis temperatures; STP: standard temperature and pressure
Pore Structure
The specific surface area and pore structure parameters of CBC-300 and MCBCs are shown in Table 2. The specific surface area, pore-volume, and average pore size of corn stalk biochar was remarkably affected by pyrolysis temperature and MgCl2 modification. The maximum specific surface area of biochar modified by magnesium was 240 m2/g, the pore volume range was 0.0086 to 0.1552 cm3/g, and the average pore size was about 9.1 nm.
Compared with CBC-300, the specific surface area, pore volume, and average pore size of biochar modified by magnesium increased significantly, indicating that the pore structure of biochar modified by magnesium could be improved considerably. With the increase of pyrolysis temperature, the specific surface area, and pore volume of modified biochar increased gradually, while the average pore size increased first and then decreased. The lower pore volume of the CBC-300 was mainly due to the condensation of hydrophobic volatiles formed by biomass degradation in the pores of biochar (Rawal et al. 2016). Due to the high pyrolysis temperature, the pore structure of modified biochar gradually develops and the number of micropores increases, resulting in the rise of the specific surface area (Yang et al. 2018). After magnesium modification, the average pore size of corn stalk biochar increased at 300 to 400 ℃ but decreased at 500 to 600 ℃. This may be because, on the one hand, the pore structure of biochar was severely disrupted when the carbonation temperature rises to 600 °C, with most of the vascular bundles being broken and the cells being disintegrated, thus reducing the average pore size (Liang et al. 2015). On the other hand, it may be due to the fact that the pores of biochar were occupied by Mg2+, which reduces the pore-forming ability (Fang et al. 2014). After the modification, the specific surface area, pore number, and pore size of biochar were increased, which was favorable for the adsorption of methylene blue. Moreover, the specific surface area of MRBC-500 and MRBC-400 were superior to that of other type biochar modified by MgCl2 or NaOH (Li et al. 2017a; Oginni et al. 2020).
Table 2. Pore Structure Parameters of MCBCs and CBC

Pore Size Distribution
The pore structure distribution of MCBCs prepared at different pyrolysis temperatures is shown in Fig. 3.

Fig. 3. Pore size distribution of biochar prepared at different pyrolysis temperatures
The pore size of modified biochar changed little from 300 to 400 ℃ and was mainly distributed in 10 to 30 nm. The pore size was distributed primarily in 1.5 to 10 nm with the increase of pyrolysis temperature (500 to 600 ℃). The pore size distribution moves to the direction of smaller pore size, indicating that the number of micropores in biochar increases and the number of mesopores has been decreased (Liu 2018). The possible reason was that the temperature increased, leading to the collapse of the mesopores in the pore structure and the further formation of micropores.
Elemental Analysis
The elemental analysis of CBC-300 and MCBCs are shown in Table 3. It can be seen from the table that when the temperature increased from 300 to 600 °C, the content of the C element in the MCBCs gradually increased, while the range of H and O decreased, which was mainly caused by the rupture of the chemical bonds between oxygen and hydrogen in the stalk biochar at high temperatures (Liu 2018). Secondly, the decomposition or reorganization of -OH, -CH3, -CH2, and -C=O groups in the corn stalk also reduces the H content. The content of different elements in biochar changed to a certain extent, which was consistent with the results of many studies (Sinha et al. 2013; Tsai et al. 2015). However, compared to CBC300, magnesium chloride did not have a positive effect on the modification of the biochar prepared at 300 °C. This may be due to the low degree of pyrolysis and carbonation of the feedstock at 300 °C. As the temperature increased, the C content increased with the degree of carbonization, while the violent thermal degradation reaction produced volatiles or gases resulting in a reduction of O and H.
Table 3. Elemental Compositions of MCBCs and CBC

The ratio of an atomic number of each element can roughly reflect organic ingredients (Rawal et al. 2016), For example, H/C, O/C, and N/C reflect the degree of aromatization, hydrophilicity, and stability of biochar, respectively. It can be seen from Table 3 that there was little difference between the three ratios before and after modification. Still, as the temperature increased, H/C gradually decreased, which can be attributed mainly to the emission of organic volatiles in the carbonization reaction and a series of dehydrogenation, indicating that the modified biochar slowly transformed into C with high aromaticity and relatively stable, which was a process of “soft carbon” to “hard carbon” (Tang and Zhang 2014). In addition, with the increase of temperature, the O/C ratio decreased, which indicated that the biochar after carbonization had obvious hydrophobicity. The gradual decrease of N/C demonstrates that a higher carbonization temperature resulted in a more stable structure of the biochar produced, which was more conducive to long-term storage.
FTIR Analysis
Figure 4 shows the infrared absorption spectra of CBC-300 and MCBCs. The characteristic absorption peaks of the samples were the same, indicating that their surface group types were roughly the same, and the FTIR spectra of the biochar before and after modification did not obviously change. The main absorption peaks of its infrared spectrum were: 3410, 2925, 2842, 1604, 1620, 1510, 1435, 1109, 873, 810, and 753 cm-1. The absorption peak at 3410 cm-1 was mainly the stretching vibration peak of the alcoholic hydroxyl group (-OH) and the N-H stretching vibration peak of the intermolecular hydrogen bond association. It can be seen that the peak value decreased with the increase of temperature. The reason may be that the increase of temperature caused the association or shedding of hydroxyl groups, which led to the decrease of -OH. The absorption peaks at 2925 and 2842 cm-1 were the stretching vibration peaks of alkanes -CH3 and -CH2. The absorption peak intensity of the modified biochar tended to weaken with increasing temperature, indicating that the aliphatic hydrocarbons -CH3 and -CH2 were sensitive to temperature and fell off or cracked, and also suggesting that the degree of aromatization of biochar gradually increases (Jian et al. 2016). The peak at 1680 to 1430 cm-1 was the vibration of the benzene ring skeleton, and there were characteristic peaks at different temperatures before and after the modification. In addition, the new absorption peak of the MCBC-600 spectrum at 1620 cm-1 was an aromatic C=C vibration peak, which may be because the modification of magnesium further promotes the aromatization process. In the fingerprint area, the absorption peak at 1109 cm-1 was attributed to the C-O stretching vibration of phenols and oxyhydrogen groups. The peak at 873 cm-1 may be attributed to the absorption vibration peak produced by the weaker aromatization peak. On the MCBC-500 spectrum, new absorption peaks appeared at 810 and 753 cm-1. These peaks were the out-of-plane bending vibrations of aromatic hydrocarbons C-H, which indicated that the biochar was modified gradually to the degree of aromatization as the temperature rose. After magnesium modification, the hydroxyl, methyl, and methylene groups were reduced, and new peaks were generated, which further promoted the degree of conversion of biochar to aromatization.

Fig. 4. FTIR spectra of MCBCs and CBC
Crystal Structure
Figure 5 shows the XRD spectra of MCBCs and CBC prepared at different temperatures. It can be seen that CBC300, MCBC300, and MCBC400 were all amorphous peaks, showing a broad and gentle peak shape. For CBC300 biochar, there were prominent cellulose 001 crystal plane diffraction peaks at 12° to 18° (Keiluweit et al. 2010). The diffraction angle of 002 crystal plane increased, which means that the degree of graphitization in cellulose-based carbon structure increased with the increase of carbonization temperature (Zhu et al. 2014).

Fig. 5. XRD patterns of CBC300 and MCBCs; PDF is a powder diffraction file, which is mainly used to compare the diffraction results of samples and qualitatively analyze what phases exist in our samples
Comparing the XRD patterns of CBC300 and MCBC300, it was found that the peak pattern of 101 crystal plane of cellulose in MCBC300 was more obvious and the peak intensity increased. This may be due to the crosslinking between magnesium and cellulose after magnesium modification, which makes the fiber structure more solid and the diffraction peak intensity more obvious. Comparing the spectra of MCBC300 and MCBC400, the diffraction peaks of MCBC-400 cellulose 101 crystal plane and 002 crystal plane were more obvious. It can be speculated that temperature further promoted the combination of magnesium and cellulose and enhanced the peak shape. As the carbonization temperature further increased, fine and sharp crystal peaks appeared in the spectra of MCBC500 and MCBC600. The X-ray diffraction standard card shows that this crystal peak was Mg(OH)2, which confirms the previous statement. Therefore, the peak intensity of the spectrum at 600 °C was higher than that at 500 °C, and the peak shape was more pronounced. After magnesium modification, this stability enhancement was more pronounced, indicating magnesium’s addition promoted this process.
Surface Morphology
The SEM image of CBC-300 and MCBCs are shown in Fig. 6 below. It can be seen from Fig. 6 that the temperature had a more remarkable influence on the surface morphology of the corn stalk biochar before and after modification. Comparing Fig. 6a and 6b, there was a small amount of pore structure in the biochar before the transformation at 300 °C. Still, the surface structure of the material was uneven, and the surface morphology of the biochar modified by magnesium was smoother and denser. This may be because part of the cellulose and hemicellulose on the biomass surface was consumed during the modification process (Gan 2016). After the modification treatment, with the further increase of the pyrolysis temperature, pore structures of different sizes were produced on the surface of the biochar due to the precipitation of some volatile substances. The pore structure was further developed with specific adsorption capacity (Du 2018).
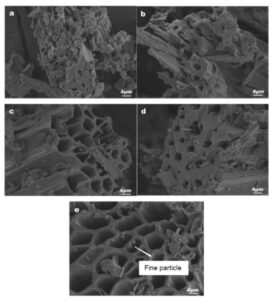
Fig. 6. SEM results of pyrolysis charcoal before and after magnesium-modified corn stalk and at different temperatures: (a) CBC-300; (b) MCBC-300; (c) MCBC-400; (d) MCBC-500; and (e) MCBC-600
The modified corn stalk biochar still showed straight tubular pore structure, indicating that magnesium modification did not destroy the original structure of biochar. The internal structure of MCBCs was more distinct and there were a lot of pores and channels. In addition, the addition of magnesium not only strengthens the adsorption sites on the surface of the biochar but also facilitates the introduction of new functional groups. In Fig. 6e, there were fine particles on the surface of the biochar, which may have been magnesium oxide.
Adsorption Experiment of Methylene Blue on Biochar and Modified Biochar
Firstly, the absorbance of biochar before and after modification at different temperatures was measured by a UV spectrophotometer. Then, the mass concentration of methylene blue at adsorption equilibrium was calculated by combining with the methylene blue standard curve in Fig. 1. Finally, the removal rate of MB was calculated according to Eq. 2, as shown in Table 4.
It can be seen from the data in Table 4 that the removal of methylene blue by biochar modified by magnesium chloride was increased. With the increase of temperature, the removal percentage first increased and then decreased. The possible reason was that with the temperature rise, the pore structure of biochar was further increased, the specific surface area, pore size, and micropores increased, which was conducive to the adsorption of methylene blue. This was consistent with the previous pore structure analysis. When the temperature continued to rise to 600 ℃, the mesopore collapsed, the pore structure was destroyed (Liang et al. 2015), and the adsorption of methylene blue decreased. The highest removal rate of methylene blue was 83.6% at 500 ℃.
Table 4. Removal Rate of Methylene Blue Dye Adsorbed by Biochar

CONCLUSIONS
- The research results show that the pyrolysis temperature has a remarkable influence on the physical and chemical properties of MCBCs. The yield decreased with the increase of temperature, but the creation of biochar after conversion with MgCl2 increased remarkably, and the highest yield was 91.4% at 300 °C. In addition, the pH of biochar was mainly around 8 with the increase of temperature. The maximum ash content was 17.34 at 600 °C.
- The peaks at 3410, 1604, and 1109 cm−1 decreased with the increase of temperature, indicating that the polar functional groups decrease at high temperature, and the biochar tends to aromatize. With the increase of temperature, the C content of modified biochar increased, the proportion of H and O decreased, and the H/C ratio decreased, which led to the increase of hydrophobicity of biochar. X-ray diffraction analysis showed that when the temperature was less than 400 °C, there were a large number of graphite-like crystallites in the biochar. When the temperature was greater than 400 °C, the crystal peak of Mg (OH)2 appeared, indicating that magnesium was successfully loaded on the surface of the biochar.
- The surface structure of biochar before modification was uneven, and there were a small number of pores, which became smooth after modification at 300 °C. In addition, with the increase of temperature, the specific surface area, micropore structure, and total pore volume increased, and the average pore diameter increased first and then decreased. Methylene blue adsorption experimentation showed that the adsorption process of corn stalk biochar was monolayer adsorption. When the dosage was 0.2 g, the removal rate of methylene blue was up to 83.6% at 500 ℃.
ACKNOWLEDGMENTS
This work received funding from the Youth Program of Guangxi Natural Science Foundation, Guangxi, China (No. 2019GXNSFBA185017).
REFERENCES CITED
Antal, M. J., and Gronli, M. (2020). “The art, science, and technology of charcoal production,” Industrial & Engineering Chemistry Research 42(8), 1619-1640. DOI: 10.1016/S0140-6701(04)91266-0
An, Q., Choluali, K., Jin, L., Li, Z., Jiao, Y., and Luo, Q. (2020a). “Study on adsorption property of Cr (VI) by zinc chloride modified corn stalk biochar,” Journal of Chongqing University 43(10), 104-113. DOI: 10.11835/j.issn.1000-582X.2019.264
An, X. F., Yu, J. L., Yu, J. Z., Tahmasebi, A., Wu, Z. S., Liu, X. C., and Yu, B. (2020b). “Incorporation of biochar into semi-interpenetrating polymer networks through graft co-polymerization for the synthesis of new slow-release fertilizers,” Journal of Cleaner Production 272(8), article ID 122731. DOI: 10.1016/j.jclepro.2020.122731
Asai, H., Samson, B. K., Stephan, H. M., Songyikhangsuthor, K., Homma, K., Kiyono, Y., Inoue, Y., Shiraiwa, T., and Horie, T. (2020). “Biochar amendment techniques for upland rice production in Northern Laos: 1. Soil physical properties, leaf SPAD and grain yield,” Field Crops Research 111(1-2), 81-84. DOI: 10.1016/j.fcr.2008.10.008
Brewer, C. E., Chuang, V. J., Masiello, C. A., Gonnermann, H., Gao, X., Dugan, B., Driver, L. E., Panzacchi, P., Zygourakis, K., and Davies, C. A. (2014). “New approaches to measuring biochar density and porosity,” Biomass and Bioenergy 66, 176-185. DOI: 10.1016/j.biombioe.2014.03.059
Brunauer, S., Emmett, P. H., and Teller, E. (1938). “Adsorption of gases in multimolecular layers,” Journal of the American Chemical Society 60(2), 309-319. DOI: 10.1021/ja01269a023
Cao, Z., Huang, Y., and Hao, J. (2018) “Multi-suitability comprehensive evaluation of crop stalk resource utilization in China,” Research of Environmental Sciences 31(1), 179-186. DOI: 10.13198/j: issn.1001-6929.2017.03.58
Ding, H. Y. (2014). Environmental Adsorption Behavior of Biochar and its Application in Soil Cadmium Pollution Control, Master’s Thesis, Xiamen University, Xiamen, China.
Du, X. J. (2018). Study on Biomass Pyrolysis Characteristics Utilizing Tube Furnace Reactor, Master’s Thesis, Beijing University of Chemical Technology, Beijing, China.
Fang, C., Zhang, T., Li, P., Jiang, R., and Wang, Y. (2014). “Application of magnesium modified corn biochar for phosphorus removal and recovery from swine wastewater,” International Journal of Environmental Research and Public Health 11(9), 9217-9237. DOI: 10.3390/ijerph110909217
Gan, C. (2016). The Characterizations of the Modified Biochar and its Adsorption Capacity for Chromium (VI), Master’s Thesis, Hunan University, Hunan, China.
Gong, P. C. (2021). “Status and development analysis of mechanized recovery and deep processing technology of corn stalk,” Use and Maintenance of Agricultural Machinery 2, 21-22. DOI: 10.14031/j.cnki.njwx.2021.02.008
He, Y. X. (2017). Study on Adsorption of Different Electrical Organic Pollutants by Reducing Agent Modified Biochar, Master’s Thesis, North China University of Water Resources and Hydropower, Zhengzhou, China.
Huggins, T. M., Haeger A., Biffinger, J. C., and Ren, Z. J. (2016). “Granular biochar compared with activated carbon for wastewater treatment and resource recovery,” Water Research 94, 225-232. DOI: 10.1016/j.watres.2016.02.059
Jian, M., Gao, K., and Yu, H. (2016). “Effects of different pyrolysis temperatures on the preparation and characteristics of biochar from rice stalk,” Journal of Environmental Science 36(5), 1757-1765. DOI: 10.13671/j.hjkxxb.2015.0657
Jun, K., Kim, K., Jeong, T., and Ahn, A. (2016). “Influence of pyrolysis temperature on characteristics and phosphate adsorption capability of biochar derived from waste-marine macroalgae (Undaria pinnatifida roots),” Bioresource Technology 200, 1024-1028. DOI: 10.1016/j.biortech.2015.10.016
Kavitha, B., Reddy, P. V. L., Kim, B., Lee, S. S., Pandey, S. K., and Kim, K. (2018). “Benefits and limitations of biochar amendment in agricultural soils: A review,” Environmental Management 227, 146-154. DOI: 10.1016/j.jenvman.2018.08.082
Keiluweit, M., Nico, P. S., Johnson, M. G., and Kleber, M. (2010). “Dynamic molecular structure of plant biomass-derived black carbon (biochar),” Environmental Science & Technology 44(4), 1247-1253. DOI: 10.1021/es9031419
Lehmann, J., Rillig, M. C., Thies, J., Masiello, C. A., Hockaday, W. C., and Crowley, D. (2011). “Biochar effects on soil biota – A review,” Soil Biology and Biochemistry 43(9), 1812-1836. DOI: 10.1016/j.soilbio.2011.04.022
Liang, H., Suo, Q., Hou, J., and Liu, C. (2015). “Structural and chemical characteristics of corn stalk and Artemisia sphaerocephala biochar under different carbonization temperatures,” Soil 47(5), 886-891. DOI: 10.13758/j.cnki. tr.2015.05.012
Li, B., Yang, L., Wang, C., Zhang, Q., Liu, Q., Li, Y., and Xiao, R. (2017a). “Adsorption of Cd (II) from aqueous solutions by rape stalk biochar derived from different modification processes,” Chemosphere 175, 332-340. DOI: 10.1016/j.chemosphere.2017.02.061
Li, H., Cao, Y., Wang, X., Ge, X., Li, B., and Jin, C. (2017b). “Evaluation on the production of food crop stalk in China from 2006 to 2014,” Bioenergy Research 10(1), Article ID 949-957. DOI: 10.1007/s12155-017-9845-4
Liu, C. X. (2018). Study on Preparation Technology and Characteristics of Crop Residue Biochar Based on Energy and Fertilizer Utilization, Master’s Thesis, Huazhong Agricultural University, Wuhan, China.
Liu, N., Song, X., Wang, C., Li, K., Ning, P., Sun, X., Wang, F., and Ma, Y. (2020). “Surface characterization research of corn-stalk biochar catalysts for the simultaneous removal of HCN, COS, and CS2,” New Journal of Chemistry 44(32), 13565-13575. DOI: 10.1039/D0NJ01648A
Lu, K., Yang, X., Shen, J., Robinson, B., Huang, H., Liu, D., Bolan, N., Pei, J., and Wang, H. (2014). “Effect of bamboo and rice stalk biochars on the bioavailability of Cd, Cu, Pb and Zn to Sedum plumbizincicola,” Agriculture Ecosystems & Environment 191, 124-132. DOI: 10.1016/j.agee.2014.04.010
Oginni, O., Yakaboylu, G. A., Singh, K., Sabolsky, E. M., Unal-Tosun, G., Jaisi, D., Khanal, S., and Shah, A. (2020). “Phosphorus adsorption behaviors of MgO modified biochars derived from waste woody biomass resources,” Journal of Environmental Chemical Engineering 8(2), article ID 103723. DOI: 10.1016/j.jece.2020.103723
Qambrani, N. A., Rahmana, M., Won, S., Shima, S., and Ra, C. (2017). “Biochar properties and eco-friendly applications for climate change mitigation, waste management, and wastewater treatment: A review,” Renewable and Sustainable Energy Reviews 79, 255-273. DOI: 10.1016/j.rser.2017.05.057
Qin, X., Luo, J., Liu, Z., and Fu, Y. (2020). “Preparation and characterization of MgO-modified rice stalk biochars,” Molecules 25(23), Article ID 5730. DOI: 10.3390/MOLECULES25235730
Rawal, A., Joseph, S. D., Hook, J. M., Chia, C. H., Munroe, P. R., Donne S. W., Lin, Y., Phelan, D., Mitchell, D. R. G., Pace, B., et al. (2016). “Mineral-biochar composites: Molecular structure and porosity,” Environmental Science & Technology 50(14), 7706-7714. DOI: 10.1021/acs.est.6b00685
Sinha, R., Kumar, S., and Singh, R. K. (2013). “Production of biofuel and biochar by thermal pyrolysis of linseed seed,” Biomass Conversion and Biorefinery 3(4), 327-335. DOI: 10.1007/s13399-013-0076-4
Steinbeiss, S., Gleixner, G., and Antonietti, M. (2009). “Effect of biochar amendment on soil carbon balance and soil microbial activity,” Soil Biology and Biochemistry 41(6), 1301-1310. DOI: 10.1016/j.soilbio.2009.03.016
Sun, Y. M., Li, G. X., Zhang, F. D., Shi, C. L., and Sun, Z. J. (2005). “Status quo and development strategy of agricultural residues resources in China,” Transactions of the Chinese Society of Agricultural Engineering 21(8), 169-173. DOI: 10.3321/j.issn:1002-6819.2005.08.037
Tan, X., Wei, W., Xu, C., Meng, Y., Bai, W., Yang, W., and Lin, A. (2020). “Manganese-modified biochar for highly efficient sorption of cadmium,” Environmental Science and Pollution Research 27(9), 9126-9134. DOI: 10.1007/s11356-019-07059-w
Tang, Y. D., and Yuan, H. Y. (2020). “Status and problems of comprehensive utilization of corn stalk in China,” Agriculture and Technology 40(13), 43-44. DOI: 10.19754/j.nyyjs.20200715017
Tang, X., and Zhang, M. (2014). “Review on the remediation of contaminated soil by biochar amendment,” Journal of Environmental Science 33(1), 17-26. DOI: 10.3969/j.issn.1673-9655.2014.01.004
Tsai, W., Huang, C., Chen, H., and Cheng, H. (2015). “Pyrolytic conversion of horse manure into biochar and its thermochemical and physical properties,” Waste and Biomass Valorization 6(6), 975-981. DOI: 10.1007/s12649-015-9376-1
Wang, Z., Guo, H., Shen, F., Yang, G., Zhang, Y., Zeng, Y., Wang, L., Xiao, H., and Deng, S. (2015). “Biochar produced from oak sawdust by lanthanum (La)-involved pyrolysis for adsorption of ammonium (NH4+), nitrate (NO3-), and phosphate (PO43-),” Chemosphere 119, 646-653. DOI: 10.1016/j.chemosphere.2014.07.084
Yang, X., Zhang, S., Hou, Q., Wang, Y., Ju, M., and Liu, L. (2018). “The preparation of biochar and adsorption behavior of Mg-modified biochar to pollutants,” Journal of Environmental Science 38(10), 4032-4043. DOI: 10.13671/j.hjkxxb.2018.0252
Yao, Y., Gao, B., Inyang, M., Zimmerman, A. R., Cao, X., Pullammanappallil, P., and Yang, L. (2011a). “Biochar derived from anaerobically digested sugar beet tailings: Characterization and phosphate removal potential,” Bioresource Technology 102(10), 6273-6278. DOI: 10.1016/j.biortech.2011.03.006
Yao, Y., Gao, B., Inyang, M., Zimmerman, A. R., Cao, X., Pullammanappallil, P., and Yang, L. (2011b). “Removal of phosphate from aqueous solution by biochar derived from anaerobically digested sugar beet tailings,” Journal of Hazardous Materials 190(1-3), 501-507. DOI: 10.1016/j.jhazmat.2011.03.083
Yoshiyuti, S., and Yutake, K. (2003). “Pyrolysis of plant, animal and human waste: Physical and chemical characterization of the pyrolytic products,” Bioresource Technology 90(3), 241-247. DOI: 10.1016/S0960-8524(03)00147-0
Yuan, J., Xu, R., and Hong, Z. (2011). “The forms of alkalis in the biochar produced from crop residues at different temperatures,” Bioresource Technology 102(3), 3488-3497. DOI: 10.1016/j.biortech.2010.11.018
Zhang, Y., Li, Z., and Mahmood, I. B. (2014). “Recovery of NH4+ by corn cob produced biochars and its potential application as soil conditioner,” Frontiers of Environmental Science & Engineering 8(6), 825-834. DOI: 10.1007/s11783-014-0682-9
Zhu, Q., Zhou, H., Li, W., Chang, Z., and Sun, C. (2014). “Structural evolution of cellulose during carbonization and activation,” Journal of University of Science and Technology Beijing 36(11), 1545-1551. DOI: 10.13374/j.issn1001-053x.2014.11.018
Article submitted: June 30, 2021; Peer review completed: Sept. 11, 2021; Revised version received and accepted: September 18, 2021; Published: September 23, 2021.
DOI: 10.15376/biores.16.4.7428-7443