
Abstract
Chitin-based activated carbon (CAC) was prepared by a two-step process of carbonization and potassium carbonate chemical activation. The CAC was characterized using scanning electron microscopy (SEM), N2 adsorption/ desorption, Fourier transform infrared (FT-IR) spectroscopy, and X-ray photoelectron spectroscopy (XPS). The adsorption performance of CAC for Orange II (O II) was evaluated in terms of contact time, adsorption temperature, initial concentration, adsorption kinetics, adsorption isotherms, and thermodynamics. The CAC had a surface area of 1320 m2 g-1 and a total pore volume of 1.10 cm3 g-1. The maximum monolayer adsorption capacity was 1010 mg g-1 at 318.2 K for O II, respectively. Equilibrium isotherms showed that the Langmuir model had a higher coefficient of determination than the Freundlich model. The thermodynamic results indicated that the adsorption process of O II onto CAC 800 was spontaneous and endothermic. Given the results of this work, CAC can be used as an efficient adsorbent for the removal of dyes from wastewater.
Download PDF
Full Article
Preparation, Characterization of Chitin-Based Activated Carbon for Orange II Removal
Yanan Wang, Qingsong Ji, and Haichao Li *
Chitin-based activated carbon (CAC) was prepared by a two-step process of carbonization and potassium carbonate chemical activation. The CAC was characterized using scanning electron microscopy (SEM), N2 adsorption/ desorption, Fourier transform infrared (FT-IR) spectroscopy, and X-ray photoelectron spectroscopy (XPS). The adsorption performance of CAC for Orange II (O II) was evaluated in terms of contact time, adsorption temperature, initial concentration, adsorption kinetics, adsorption isotherms, and thermodynamics. The CAC had a surface area of 1320 m2 g-1 and a total pore volume of 1.10 cm3 g-1. The maximum monolayer adsorption capacity was 1010 mg g-1 at 318.2 K for O II, respectively. Equilibrium isotherms showed that the Langmuir model had a higher coefficient of determination than the Freundlich model. The thermodynamic results indicated that the adsorption process of O II onto CAC 800 was spontaneous and endothermic. Given the results of this work, CAC can be used as an efficient adsorbent for the removal of dyes from wastewater.
DOI: 10.15376/biores.18.3.5041-5056
Keywords: Two-step; Porous activated carbon; Orange II; Adsorption mechanism
Contact information: Key Laboratory of Applied Physical Chemistry of Qinghai Province, Qinghai Nationalities University, Xining 810007, PR China; Institute of Chemical Industry of Forest Products, Chinese Academy of Forestry; National Engineering Laboratory for Biomass Chemical Utilization; Key Laboratory of Chemical Engineering of Forest Products, National Forestry and Grassland Administration; Key Laboratory of Biomass Energy and Material, Nanjing 210042, Jiangsu, China;
* Corresponding author: lihaichao@vip.163.com
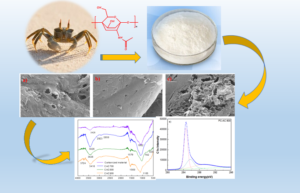
GRAPHICAL ABSTRACT
INTRODUCTION
Synthetic dyes are commonly applied in paper, textiles, and food (Ghaedi et al. 2012). However, synthetic dyes are sources of water pollution due to their toxicity, intense color, and carcinogenic nature (Qiao et al. 2021). They adversely affect biological diversity, public health, and ecosystem function. Orange II (O II) is a toxic and hazardous industrial synthetic dye (Shuval 2003; Sarma et al. 2016), which is widely used as a corrosion inhibitor and laboratory reagent. In addition, it is widely used in hair dye, wool, silk, leather, nylon, and other textiles (Soltani et al. 2021). Several techniques have been developed for removing these toxic substances from industrial effluents, including oxidative degradation, electrochemical destruction, ozonation, and biodegradation. Compared with these technologies, adsorption has the advantages of relatively simple design, convenience, safe handling, high efficiency, and cost-effectiveness, so it is widely employed for the removal of dye (Katheresan et al. 2018).
Adsorbents such as activated carbon, clays, composites, and other polymeric adsorbents have been tested for dye removal (Gupta et al. 2000 Karaer et al. 2016; Kazeem et al. 2018; Alorabi et al. 2021). Recent research has shown that adsorbents can remove dyes and harmful ions, that nanoscale adsorbents are effective antibacterial agents, and that microspheres made from adsorbents can inhibit cancer and have great medical use (Nandanwar et al. 2023; Shekhawat et al. 2023; Kim et al. 2023; Saruchi et al. 2023; Hyon et al. 2023). Activated carbon is a specially treated carbon with a well-developed porous structure, a high surface area, abundant active functional groups, and high adsorption activity (Sharghi et al. 2008). Activated carbon is usually prepared from organic materials such as coal, coconut shells, and wood, but there are limitations to the applications of the products made from these source materials (Pereira et al. 2003).
In many studies, the raw materials used to prepare activated carbon containing nitrogen are organic reagents; in this study, chitin, which is abundant in nature, was used (Liu et al. 2017). Chitin has been used for dye removal because of its relative abundance, low cost, and tunable properties, such as surface area, pore size, and pore volume, as well as its ease of handling and environmental safety (Dassanayake et al. 2021). Since chitin contains nitrogen, the activated carbon is likely to have nitrogen-containing groups, and the N-containing porous carbon can be used as an electrode material to produce products with excellent CDI desalination (Liu et al. 2023). Porous N-doped carbon is coated on the surface of CoP nanoparticles to produce a composite co-catalyst with excellent electrical conductivity and a high surface area capable of separating and transferring photoexcited charges, adsorbing CO2 molecules, and inhibiting hydrogen precipitation reactions (Niu et al. 2021). Chitin-based activated carbon has been prepared by two-step carbonization and chemical activation, using KOH as an activating agent. The two-step method is used because it produces a larger specific surface area of activated carbon than the one-step method. Using KOH as the activator, the sample shows a high surface area, but it corrodes the equipment. K2CO3 as an activating agent has a good activation effect and reduces equipment corrosion. K2CO3 activation improves the nitrogen retention rate of the material. The amino and hydroxyl groups on the adsorbent provide more active sites for dye binding during adsorption (Ngah et al. 2011).
In this research, a chitin-based activated carbon was synthesized via a two-step process of carbonization and K2CO3 chemical activation. The activated carbon was used as an adsorbent to remove O II dyes from wastewater. The impact of important adsorption factors, including contact time, adsorption temperature, and initial dye concentration, on the adsorption procedure was investigated. To find possible adsorption mechanisms involved in the removal process, kinetic studies and adsorption isotherms were conducted, and the corresponding adsorption thermodynamic parameters were studied. The performance of CAC 800 was compared with other adsorbents.
EXPERIMENTAL
Materials
Chitin ((C8H13NO5)n, molecular weight 203.19, practical grade) powder, potassium carbonate (K2CO3) with purity 98% (AR), and hydrochloric acid (HCl) with purity 99% (AR),0.1mol/L, were purchased from Shanghai Aladdin Biochemical Technology Co., LTD, China. Orange II (O II, biological stain, = 484 nm) was supplied by Shanghai Macklin Biochemical Co., Ltd. All reagents were used as-received without further purification.
Equipment used in the work included a muffle furnace, SX2-4-10GP, Jinan Jingrui Analytical Instrument Co., Ltd, and an electric blast drying oven (convection oven), DHG-9245A, Shanghai Yiheng Technology Instrument Co., Ltd.
Preparation of CAC
A series of chitin-based activated carbon materials were prepared via carbonization and chemical activation with the activator K2CO3, using chitin as the raw material. Chitin powder was placed in a crucible, which was sealed and placed in a muffle furnace for carbonization at 600°C for 1 h with a heating rate of 10 ℃ min-1. After cooling to room temperature, the carbonized material sample was soaked with K2CO3 solution, at an impregnation ratio of 2:1. The mixed samples were dehydrated in a convection drying oven at 110 °C for 12 h. The dried sample was activated at 700, 800, or 900 °C (heating rate, 10 ℃ min-1) for 1 h. The activated product was cooled to room temperature, washed with 0.1 M HCl and then deionized water until it reached neutral pH, and dried at 110℃ for 24 h. According to the activation temperature, these samples were named CAC 700, CAC 800, and CAC 900.
Characterization of CAC
The surface morphology of carbonized material and CAC was identified using scanning electron microscopy (SEM, Zeiss, Germany). The specific surface area and porosity of the samples were measured by N2 adsorption-desorption isotherms at 77 K using BELSORP-max (MicrotracBEL Corp.). The surface functional groups of the samples were analyzed by the Fourier transform infrared (FT-IR) spectroscopy (PerkinElmer, Spectrum Two). Surface chemistry was studied by X-ray photoelectron spectroscopy (XPS, Spring Valley, NY, USA).
Adsorption Experiments
Adsorption experiments were carried out in a gas bath thermostatic oscillator at 150 rpm using shaking flasks at settings of 298.15, 308.15, and 318.15 K. First, 50 mg of CAC 800 was mixed with 100 mL of O II solution with an initial concentration of 400 to 1000 mg L-1. The dye solution concentration was measured with a UV spectrophotometer (UV, Beijing Purkinje General Instrument Co., Ltd., T6) at a wavelength λmax of 484 nm for O II. The adsorption capacity at time t(qt) and the equilibrium adsorption capacity () were calculated as follows,
 (1)
(1)
 (2)
(2)
Where C0, Ct, and Ce are the initial concentration, the concentration at time t, and the equilibrium concentration of dye solution (mg L-1), respectively, is the volume of the dye solution (L), and m is the mass of CAC 800 (g).
RESULTS AND DISCUSSION
Characteristics of the Porous Activated Carbon
The morphology of the CAC samples was investigated by scanning electron microscopy, and the SEM images are shown in Fig. 1. All CAC samples exhibited a porous structure. The pores result from the release of gases such as CO, CO2, and NH3 during the activation process. With the increase in activation temperature, the number of pores increased. When the activation temperature was 900 ℃, the surface of the CAC 900 was rough; the activation temperature was too high, resulting in the collapse of the internal pores. Therefore, the activation temperature plays an essential role in the structure and morphology of porosity of the samples. In the present study, the particle size of activated carbon ranged from 10 to 50 µm. The volume ratios of CAC 700, CAC 800, and CAC 900 micropores to mesopores were 2.78, 1.10, and 0.773, respectively.

Fig. 1. SEM I mages of (a) CAC 700, (b) CAC 800, and CAC 900
The N2 adsorption-desorption isotherms of the samples were characterized, as shown in Fig. 2. According to the IUPAC classification, the samples showed a type IV isotherm with an increase in the adsorbed volume in the entire relative pressure range, which is a characteristic of mesoporous solids (Oginni et al. 2019). The isotherm of the CAC samples showed a hysteresis loop at the relative pressure in the range of 0.3 to 1.0, which might be due to capillary condensation in the mesoporous region (Lladó et al. 2016). Although the isotherms had a similar shape, the N2 adsorption amounts clearly differed. Once potassium carbonate was added, CAC showed higher N2 adsorption than the carbonized material (119 cm3 g-1).

Fig. 2. N2 adsorption-desorption isotherms of the CAC with varied temperatures
Table 1 summarizes the values of the surface area and pore volume of the carbonized material and CAC. The surface area of carbonized material was 300.3 m2 g-1, the total pore volume was 0.183 cm3 g-1, and the mean pore size was 2.43 nm. The CAC 800 had the highest surface area (1320 m2 g-1) and total pore volume (1.10 cm3 g-1), followed by the CAC 700 and CAC 900. The results demonstrate that the surface area and the total pore volume were governed by the activation temperature. When the activation temperature is too high, the internal pore structure collapses, contributing to the low specific surface area (Niu et al. 2017). The specific surface area of CAC 800 was higher than that of most previously reported chitin-based materials, as shown in Table 2. The higher specific surface area and developed pore structure endow the material with more adsorption active sites, thus having a strong adsorption ability, so CAC 800 is more suitable for dye removal.
Table 1. Structural Parameters of the Carbonized Material and CAC

Table 2. Comparison of the BET Surface Area of AC with Various Activator


Fig. 3. FT-IR spectrum of carbonized material, CAC 700, CAC 800, and CAC 900
The surface functional group composition and structural information of the samples can be obtained by infrared spectroscopy. Figure 3 shows the infrared spectra of the samples before and after activation. The multiple absorbance peak at 3420 cm-1 is attributed to the stretching vibrations of O-H and N-H, which indicates the presence of oxygen and nitrogen heteroatoms derived from the decomposition of chitin (Khanday et al 2019). The absorbance peaks around 2850 to 2920 cm-1 can be assigned to the stretching vibrations of C-H in methyl or methylene (Rashid et al. 2016). The absorbance peak at 1600 cm-1 is related to the C=O stretching vibration in ketones, aldehydes, lactones, or carboxylic acids and the N-H deformation of amine groups (Simsir et al. 2017; Ma et al. 2019). The weak absorbance peak near 1350 cm-1 may be the stretching vibration of C-N (Jawad et al. 2020). The absorbance peaks at 1000 to 1300 cm-1 indicate the C-O/C-O-C stretching of acids, alcohols, ethers, and esters (Puziy et al. 2006).
X-ray photoelectron spectroscopy (XPS) was performed to investigate the elemental composition and percentage of C- and N-incorporation in the samples. The full survey XPS spectra of the carbonized material and the CAC are shown in Fig. 4. The C1s and N1s XPS spectra are shown at high resolution in Fig. 4. Based on the full survey XPS spectra, all the samples were found to mainly consist of C, N, and O elements. All samples showed similar three peaks, indicating that the N and O elements after different temperatures of activation were still retained in the samples, which can form a rich functional group on the surface of the carbon material, thereby improving the chemical properties of the surface of the material and enhancing adsorption capacity.

Fig. 4. Survey XPS spectra for carbonized material and chitin-based carbon material by K2CO3 activation


Fig. 5. XPS C1s and N1s spectra of the carbonized material (a, b), CAC 700 (c, d), CAC 800 (e, f) and CAC 900 (g, h)
The high-resolution C1s spectra of the carbonized material can be fitted by four peaks presenting the four types of carbon atoms linked to carbon, nitrogen, and oxygen; C-C/C=C (284.6 eV), C=N (285.7 eV) (Elmouwahidi et al. 2020), C-O /C=O/N=C-O(288.8 eV) (Lorenc-Grabowska et al. 2013), and π-π* (291.8 eV), respectively. The N1s spectra of the carbonized material can be deconvoluted into three peaks with binding energies of 397.5, 399.5, and 402.5 eV, which can be attributed to the pyridinic N (N-6), pyrrolic N (N-5), and oxidized N (N-X), respectively (Xu et al. 2020). The C1s spectra of the CAC 700 can be resolved into four individual peaks centered at 284.6, 285.7, 287.3, and 290.1 eV, which refer to C-C/C=C (284.6 eV), C=N (285.7 eV), C-O (287.3 eV), and O-C=O (290.1 eV), respectively (Hwang et al. 2021). Three peaks corresponding to pyridinic N, pyrrolic N, and graphitic N (N-Q) can be extracted from the CAC 700 N1s spectra (Lin et al. 2015). As shown in Fig. 5, the activation temperature had an effect on the C and N elements. As the activation temperature increased, the C atom was presented in three forms: C-C/C=C, C-N, and O-C=O, and the N atom existed in the forms N-6 and N-Q (Roberts, et al. 2013).
Dye Adsorption Properties of CAC 800
Effect of temperature and contact time
To study the adsorption behavior of O II on CAC 800, the effects of adsorption temperature and contact time were determined. The effects of temperature and contact time on CAC 800 adsorbing O II from solution are shown in Fig. 6.

Fig. 6. Effect of adsorption temperature and contact time for the O II (b) adsorption. initial concentration: O II 400 mg L-1
The process was rapid in the initial period. When it reached equilibrium, it slowed gradually. This is due to a larger available adsorption active site during the initial stage of the adsorption process. After a certain time, the active adsorption sites near the outside are occupied by dye molecules more quickly, and the adsorption sites deeper in the micropores are gradually filled, leading to a decrease in the number of active sites, thus reaching equilibrium. The amount of two dyes adsorbed at equilibrium increased with increasing temperature in the direction: (298.15 K) < (308.15 K) < (318.15 K). The amount of O II adsorbed by CAC 800 at equilibrium increased from 644.405 to 746.799 mg g-1 as the adsorption temperature increased from 298.2 to 318.2 K. These results indicate that the adsorption of O II onto CAC 800 is endothermic.
Effect of Initial Concentration
The initial concentration is one of the most important parameters in adsorption; the effect of the initial concentration on the removal of O II by CAC 800 was studied. Figure 7 shows the effect of changing the initial concentration variable from 400 to 1000 mg L-1 on the adsorption capacity with O II. CAC 800 has a certain and limited number of adsorption active sites, which were more readily available. At higher initial concentrations, the dye adsorbed by the CAC 800 increased, the adsorption site became saturated, and the amount of adsorption was balanced gradually. At the same time, the O II initial concentration increased from 400 to 1000 mg L-1, and the amount of O II on CAC 800 increased from 747 to 1010 mg g-1 at 318.2 K.
The results are related to the fact that the higher initial dye concentration not only overcomes the mass transfer resistance between the solid and solution phases, but it also increases the collision frequency between the surface of the adsorbent and the dye molecule (Tsai et al. 2006). Following maximum adsorption, all adsorption sites are occupied by dye molecules, and there are no active sites attainable for binding.

Fig. 7. Effect of initial concentration for the and O II(b) adsorption
Adsorption Isotherms
The linear Langmuir and Freundlich isotherms for the adsorption of CV and O II onto CAC 800 at different adsorption temperatures were fitted to the experimental data. The Langmuir isotherm model is based on monolayer adsorption of adsorbate molecules at the adsorption active sites of a homogenous surface with the same energy. There are assumed to be no (or only ideal) interactions between adsorbent molecules on adjacent sites. When the interaction is ideal, the energy of the side-to-side interaction is equal for all sites, regardless of surface coverage. The Freundlich model is suitable for adsorption of adsorbate molecules onto a heterogeneous adsorbent surface. The linear Langmuir and Freundlich isothermal equations are given as Eqs. 5 (Langmuir 1918) and 6 (Freundlich 1906), respectively,
 (5)
(5)
 (6)
(6)
where is the dye concentration and the equilibrium point, (mg L-1), is the adsorption capacity at equilibrium (mg g-1), is the Langmuir isotherm constant (L mg-1), is the maximum monolayer adsorption capacity (mg g-1), is the Freundlich isotherm constant (mg g-1/L-1 g), and is the heterogeneous factor.
Figure 8 shows the linear method and the Langmuir and Freundlich isotherms for the adsorption of O II on CAC 800, respectively. The isotherm parameters of CAC 800 for adsorption of O II onto CAC 800 are given in Table 3. The Langmuir isotherm showed a better coefficient of determination (R2) value than the Freundlich isotherm for O II. Comparing the maximum value of the adsorption of the two dyes by CAC 800, the theoretical value by the Langmuir model was closer to the experimental value. These results also indicated that the Langmuir model is more suitable for fitting experimental values than the Freundlich model. The adsorption capacity was found to increase with increasing temperature.

Fig. 8. Isotherm models for adsorption of O II on CAC 800: (a) Langmuir isotherm model; (b) Freundlich isotherm model. (initial concentration: O II 400 mg L-1)
Table 3. Isotherm Parameters Obtained from Linear for O II onto PA-AC 800

Table 4. Comparison of the Adsorption Capacities of ACs from Various Precursors for O II Adsorption

From the parameters of the Langmuir isotherm model, the adsorption capacity for O II onto CAC 800 was qmax 994, 999 and 1010 mg g-1 at 298.2, 308.2, and 318.2 K, respectively. Based on the fact that maximum adsorption capacity was found to increase by increasing adsorption temperature, it can be judged that the adsorption is an endothermic process for O II onto CAC 800. Table 4 shows that Kong successfully prepared two products by co-calcining limestone with activated carbon in different ratios (1:2 and 1:1). The maximum adsorption values of these two products for O II were 311 and 389 mg g-1, respectively. Ma reported that the products prepared from banana peel using KOH and activated carbon in a 2:1 ratio at two temperatures (500 °C and 750 °C) had maximum adsorption values of 25 mg g-1 and 333 mg g-1 for O II, respectively. The maximum sorption capacity of CAC 800 for OII in this work was 1010 mg g-1, which was higher than the above work. Good adsorption performance is attributed to CAC 800, which has high surface area, a developed pore structure, and more nitrogen-containing functional groups (Oginni et al. 2019). Therefore, the CAC 800 can be used as an effective adsorbent in the removal of dye wastewater.
Thermodynamic Parameters
To estimate the adsorption process mechanism, the change in Gibbs free energy (), enthalpy (), and entropy () were determined by Eqs. 7, 8, and 9 (Reghioua et al. 2021), respectively,
 (7)
(7)
 (8)
(8)
 (9)
(9)
where R is the gas constant (8.314 J mol-1 K-1), T is the adsorption temperature (K), and Kd is the distribution coefficient.
Table 5. Thermodynamic Parameters for the Adsorption of O II onto CAC 800 at Different Adsorption Temperature

The adsorption thermodynamic parameters of O II onto CAC 800 are presented in Table 5. Gibbs free energy in the range of -20 to 0, -20 to -80, and -80 to -400 KJ mol-1 indicated physisorption, physisorption, and chemisorption, respectively (Rashid et al. 2016). The values of ∆G0 O II adsorption at the adsorption temperatures of 298.2, 308.2, and 318.15 K were -5.329, -6.592, and -8.963 KJ·mol-1, respectively. These results implied that the adsorption process of O II by the PA-AC 800 was a spontaneous reaction. The value of ∆H0>0 indicated that the adsorption process of O II by CAC 800 surface is endothermic in nature. Furthermore, a positive value of ∆S0 suggested an increase in the degree of freedom at the solid/liquid interface during the adsorption process with some structural changes in the adsorbate and adsorbent, and it reflects the good affinity of CAC 800 to dye.
CONCLUSIONS
- In the present work, chitin-based porous activated carbon (CAC) was successfully synthesized using chitin. CAC was powdered carbon with particle sizes ranging from 10 to 50 μm.
- The CAC made from chitin at all three temperatures had a high surface area and a well-developed pore structure, with CAC 800 being the best.
- Morphological analysis by scanning electron microscopy (SEM) showed that all three samples exhibited a porous structure, with a more favorable morphology at 800 °C. BET examination showed that the surface area (1320 m2 g-1) and total pore volume (1.097 cm3 g-1) of CAC 800 were the largest, and combined with the adsorption performance of CAC 800 on dyes, this indicated excellent dye adsorption properties with the potential for the adsorption of wastewater.
- Infrared analysis showed the presence of many nitrogen-containing functional groups (N-5, N-6, and N-Q) and other functional groups (C-C/C=C, C-N, and O-C=O) on the surface of the product.
- Thermodynamic characterization of the products and experimental parameters indicate that the adsorption process on O II is endothermic and spontaneous.
ACKNOWLEDGMENTS
This work was financially supported by the Key R&D and Transformation Program of Qinghai (2022-QY-210).
REFERENCES CITED
Alorabi, A. Q., Hassan, M. S., Alam, M. M., Zabin, S. A., Alsenani, N. I., and Baghdadi, N. E. (2021). “Natural clay as a low-cost adsorbent for crystal violet dye removal and antimicrobial activity,” Nanomaterials 11, article 2789. DOI: 10.3390/nano11112789
Dassanayake, R. S., Acharya, S., and Abidi, N. (2021). “Recent advances in biopolymer-based dye removal technologies,” Molecules 26, 46-97. DOI: 10.3390/molecules26154697
Duan, B., Gao, X., Yao, X., Fang, Y., Huang, L., Zhou, J., and Zhang, L. (2016). “Unique elastic N-doped carbon nanofibrous microspheres with hierarchical porosity derived from renewable chitin for high rate supercapacitors,” Nano Energy 27, 482-491. DOI: 10.1016/j.nanoen.2016.07.034
Elmouwahidi, A., Bailón-García, E., Pérez-Cadenas, A. F., and Carrasco-Marín, F. (2020). “Valorization of agricultural wood wastes as electrodes for electrochemical capacitors by chemical activation with H3PO4 and KOH,” Wood Sci. Technol. 54, 401-420. DOI: 10.1007/s00226-020-01163-8
Freundlich, H. M. F. (1906). “Over the adsorption in solution,” J. Phys. Chem. 57, 385-470. DOI: 10.1515/zpch-1907-5723
Ghaedi, M., Heidarpour, S., Kokhdan, N. S., Sahraie, R., Daneshfar, A., and Brazesh, B. (2012). “Comparison of silver and palladium nanoparticles loaded on activated carbon for efficient removal of methylene blue: Kinetic and isotherm study of removal process,” Powder Technology 22(8), 18-25. DOI: 10.1016/j.powtec.2012.04.030
Gupta, V., Mohan, D., Shamra, S., and Shamra, M. (2000). “Removal of basic dyes (rhodamine b and methylene blue) from aqueous solutions using bagasse fly ash,” Sep. Sci. Technol. 35, 2097-2113. DOI: 10.1081/ss-100102091
Ho, Y. S., and Mckay, G., 1999. “Pseudo-second order model for sorption processes,” Process Biochem. 34(5), 451-465. DOI: 10.1016/s0032-9592(98)00112-5
Hwang, H., Lee, J., Ahmed, M. A., and Choi, J. W. (2021). “Evaluation of pyrochar and hydrochar derived activated carbons for biosorbent and supercapacitor materials,” J. Environ. Manage. 298, article 113436. DOI: 10.1016/j.jenvman.2021.113436
Hyon, J. Y., Lee, J. H., Yun, H. S., Han, E. H., and Chung, Y. H. (2023). “Comparative proteomics study of mitochondrial electron transport system modulation in SH-SY5Y cells following MPP+ versus 6-OHDA-induced neurodegeneration,” J. Anal. Sci. Technol. 7(1), 19. DOI: 10.1186/s40543-022-00365-y
Jawad, H. A., Abdulhameed, A. S., Malek, N. N. A., and Alothman, Z. A. (2020). “Statistical optimization and modeling for color removal and COD reduction of reactive blue 19 dye by mesoporous chitosan-epichlorohydrin/kaolin clay composite,” Int. J. Biol. Macromol. 164, 4218-4230. DOI: 10.1016/j.ijbiomac.2020.08.201
Katheresan, V., Kansedo, J., and Lau, S. Y. (2018). “Efficiency of various recent wastewater dye removal methods: A review,” Journal of Environmental Chemical Engineering 6, 4676-4697. DOI: 10.1016/j.jece.2018.06.060
Kazeem, T. S., Lateef, S. A., Ganiyu, S. A., Qamaruddin, M., Tanimu, A., Sulaiman, K. O., Jillani, S. M. S., and Alhooshani, K. (2018). “Aluminium-modified activated carbon as efficient adsorbent for cleaning of cationic dye in wastewater,” J. Cleaner Prod. 205, 303-312. DOI: 10.1016/j.jclepro.2018.09.114
Khanday, W. A., Ahmed, M. J., Okoye, P. U., Hummadi, E. H., and Hameed, B. H. (2019). “Single-step pyrolysis of phosphoric acid-activated chitin for efficient adsorption of cephalexin antibiotic,” Bioresource Technology 280, 255-259. DOI: 10.1016/j.biortech.2019.02.003
Kim, S., Son, N., Park, S.-M., Lee, C.-T., Pandey, S., and Kang, M. (2023). “Facile, fabrication of oxygen-defective ZnO nanoplates for enhanced photocatalytic degradation of methylene blue and in vitro antibacterial activity,” Catalysts 13, article 567. DOI:10.3390/catal13030567.
Kong, L. J., Su, M. H., Peng, Y., Hou, L. A., Liu, J., Li, H. P., Diao, Z. H., Shih, K. M., Xiong, Y., and Chen, D. Y. (2017). “Producing sawdust derived activated carbon by co-calcinations with limestone for enhanced acid orange II adsorption,” J. Cleaner Prod. 168, 22-29. DOI: 10.1016/j.jclepro.2017.09.005
Langmuir, I. (1918). “The adsorption of gases on plane surfaces of glass, mica and platinum,” Journal of American Chemical Society A 40, 1361-1403. DOI: 10.1021/ja02242a004
Lin, T. Q., Chen, I. W., Liu, F. X., Yang, C. Y., Bi, H., Xu, F. F., and Huang, F. Q. (2015). “Nitrogen-doped mesoporous carbon of extraordinary capacitance for electrochemical energy storage,” Science 350, 1508-1513. DOI: 10.1126/science.aab3798
Liu, C., Zhang, H. Y., Xiao, R., and Wu, S. B. (2017). “Value-added organonitrogen chemicals evolution from the porolysis of chitin and chitosan,” Carbohydr. Polym. 156, 118-124. DOI: 10.1016/j.carbpol.2016.09.024
Liu, R., Yao, S., Shen, Y., Tian, Y., and Zhang, Q. (2023). “Preparation of N-doped layered porous carbon and its capacitive deionization performance,” Materials 16, article 1435. DOI: 10.3390/ma16041435
Lladó, J., Solé-Sardans, M., Lao-Luque, C., Fuente, E., and Ruiz, B. (2016). “Removal of pharmaceutical industry pollutants by coal-based activated carbons,” Process Safety and Environmental Protection 104, 294-303. DOI: 10.1016/j.psep.2016.09.009
Lorenc-Grabowska, E., Gryglewicz, G., and Diez, M. A. (2013). “Kinetics and equilibrium study of phenol adsorption on nitrogen-enriched activated carbons,” Fuel 11, 235-243. DOI: 10.1016/j.fuel.2012.11.056
Ma, J. F., Huang, D. Q., Zou, J., Li, L. Y., Kong, Y., and Komarneni, S. (2014). “Adsorption of methylene blue and orange II pollutants on activated carbon prepared from banana peel,” J. Porous Mater. 22, 301-311. DOI: 10.1007/s10934-014-9896-2
Ma, M., Chen, Y. L., Zhao, X., Tan, F. Z., Wang, Y. H., Cao, Y. F., and Cai, W. J. (2020). “Effective removal of cation dyes from aqueous solution using robust cellulose sponge,” Journal of Saudi Chemical Society 24, 915-924. DOI: 10.1016/j.jscs.2020.09.008
Ma, P. Y., Wang, S. Y., Wang, T., Wu, J. Z., Xing, X. J., and Zhang, X. W. (2019). “Effect of bifunctional acid on the porosity improvement of biomass-derived activated carbon for methylene blue adsorption,” Environ. Sci. Pollut. Res. 26, 30119-30129. DOI: 10.1007/s11356-019-06177-9
Nandanwar, P., Jugade, R., Gomase, V., Shekhawat, A., Bambal, A., Saravanan, D., and Pandey, S. (2023). “Chitosan-biopolymer-entrapped activated charcoal for adsorption of reactive orange dye from aqueous phase and CO2 from gaseous phase,” J. Compos. Sci. 7, 103. DOI: 10.3390/jcs7030103
Ngah, W. S. W., Teong, L. C., and Hanafiah, M. A. K. M. (2011). “Adsorption of dyes and heavy metal ions by chitosan composites: A review,” Carbohydr. Polym. 83, 1446-1456. DOI: 10.1016/j.carbpol.2010.11.004
Niu, P., Pan, Z., Wang, S., and Wang, C. (2021). “Cobalt phosphide cocatalysts coated with porous N-doped carbon layers for photocatalytic CO2 reduction,” ChemCatChem 13, 1-8. DOI: 10.1002/cctc.202100748
Niu, Q. Y., Gao, K. Z., Tang, Q. H., Wang, L. Z., Han, L. F., Fang, H., Zhang, Y., Wang, S. W., and Wang, L. X. (2017). “Large-size graphene-like porous carbon nanosheets with controllable N-doped surface derived from sugarcane bagasse pith/chitosan for high performance supercapacitors,” Carbon 123, 290-298. DOI: 10.1016/j.carbon.2017.07.078
Oginni, O., Singh, K., Oporto, G., Dawson-Andoh, B., McDonald, L., and Sabolsky, E. (2019). “Effect of one-step and two-step H3PO4 activation on activated carbon characteristics,” Bioresource Technology Reports 8, article 100307. DOI: 10.1016/j.biteb.2019.100307
Pereira, M. F. R., Soares, S. F., Órfão, J. J. M., and Figueiredo, J. L. (2003). “Adsorption of dyes on activated carbons: influence of surface chemical groups,” Carbon 41, 811-821. DOI: 10.1016/s0008-6223(02)00406-2
Puziy, A. M., Poddubnaya, O. I., and Ziatdinov, A. M. (2006). “On the chemical structure of phosphorus compounds in phosphoric acid-activated carbon,” Appl. Surf. Sci. 252, 8036-8038. DOI: 10.1016/j.apsusc.2005.10.044
Qiao, L. Z., Wang, S. S., Wang, T., Yu, S. S., Guo, S. H., and Du, K. F. (2021). “High-strength and low-swelling chitosan/cellulose microspheres as a high-efficiency adsorbent for dye removal,” Cellulose 28, 9323-9333. DOI: 10.1007/s10570-021-04111-2
Raj, C. J., Rajesh, M., Manikandan, R., Yu, K. H., Anusha, J. R., Ahn, J. H., Kim, D., Park, S. Y., and Kim, B. C. (2018). “High electrochemical capacitor performance of oxygen and nitrogen enriched activated carbon derived from the pyrolysis and activation of liquid gladius chitin,” J. Power Sources 386, 66-76. DOI: 10.1016/j.jpowsour.2018.03.038
Rashid, A. R., Jawad, A. H., Ishak, M. A. M., and Kasim, N. N. (2016). “KOH-activated carbon developed from biomass waste: Adsorption equilibrium, kinetic and thermodynamic studies for methylene blue uptake,” Desalin. Water Treat. 57(56), 27226-27236. DOI: 10.1080/19443994.2016.1167630
Reghioua, A., Barkat, D., Jawad, A. H., Abdulhameed, A. S., Al-Kahtani, A. A., and Alothman, Z. A. (2021). “Parametric optimization by Box–Behnken design for synthesis of magnetic chitosan-benzil/ZnO/Fe3O4 nanocomposite and textile dye removal,” Journal of Environmental Chemical Engineering 9, 105-166. DOI: 10.1016/j.jece.2021.105166
Roberts, A.D., Lee, J.M., Wong, S.Y., Li, X. and Zhang, H.F.,(2013), “Nitrogen-rich activated carbon monoliths via ice-templating with high CO2 and H2 adsorption capacities,” J. Mater. Chem. A, 2013, 00, 1-3, DOI: 10.1039/C6TA09078H.
Sarma, G. K., Gupta, S. S., and Bhattacharyya, K. G. (2016). “Adsorption of crystal violet on raw and acid-treated montmorillonite, K10, in aqueous suspension,” J. Environ. Manage. 171, 1-10. DOI: 10.1016/j.jenvman.2016.01.038
Saruchi, Kumar, V., Bhatt, D., Pandey, S., and Ghfar, A. A. (2023). “Synthesis and characterization of silver nanoparticle embedded cellulose–gelatin based hybrid hydrogel and its utilization in dye degradation,” RSC Adv. 13, 8409-8419. DOI: 10.1039/d2ra03885d
Sharghi, H., Aberi, M., and Doroodmand, M. M. (2008). “Cobalt (III)-salen complex supported on activated carbon as an efficient heterogeneous catalyst for synthesis of 2-arylbenzimidazole derivatives,” Advance Synthesis Catalyst 350, 2380-2390. DOI: 10.1002/adsc.200800317
Shekhawat, A., Jugade, R., Gomase, V., Kahu, S., Dhandayutham, S., and Pandey, S. (2023). “Adsorptive removal of As(III) by cellulose-Sn(IV) biocomposite,” J. Compos. Sci. 7, article 19. DOI:10.3390/jcs7010019
Shuval, H. (2003). “Estimating the global burden of thalassogenic diseases: Human infectious diseases caused by wastewater pollution of the marine environment,” J. Water Health 1, 53-64. DOI: 10.2166/wh.2003.0007
Simsir, H., Eltugral, N., and Karagoz, S. (2017). “Hydrothermal carbonization for the preparation of hydrochars from glucose, cellulose, chitin, chitosan and wood chips via low-temperature and their characterization,” Bioresource Technology 246, 82-87. DOI: 10.1016/j.biortech.2017.07.018
Soltani, R., Pelalak, R., Pishnamazi, M., Marjani, A., Albadarin, A. B., Sarkar, S. M., and Shirazian, S. (2021). “Synthesis of multi‑organo‑functionalized fibrous silica KCC‑1 for highly efficient adsorption of acid fuchsine and acid orange II from aqueous solution,” Sci. Rep. 11, article 2716. DOI: 10.1038/s41598-021-81080-3
Tsai, W. T., Lai, C. W., and Su, Y. T. (2006). “Adsorption of bisphenol-A from aqueous solution onto minerals and carbon adsorbents,” J. Hazard. Mater. 134, 169-175. DOI: 10.1016/j.jhazmat.2005.10.055
Xu, D., Su, Y. H., Zhang, S. P., and Xiong, Y. Q. (2020). “Highly porous N-doped carbons production from biomass for high-performance supercapacitors without chemical nitrogen-containing dopants,” Energy Sources Part A 42, 1797-1807. DOI: 10.1080/15567036.2019.1604890
Article submitted: April 7, 2023; Peer review completed: May 13, 2023; Revised version received and accepted: May 25, 2023; Published: June 2, 2023.
DOI: 10.15376/biores.18.3.5041-5056