
Abstract
Water-soluble carbon quantum dots were hydrothermally produced using corn straw as the starting material and nitric acid solution as solvent, then they were introduced as fluorescent probes for the detection of Cu2+. High-resolution transmission electron microscopy and X-ray diffraction showed that the carbon quantum dots were spherical amorphous particles with a diameter of 5 nm. The surface functional groups of carbon quantum dots were observed via Fourier transform infrared spectrometry and X-ray photoelectron spectroscopy. A new approach for Cu2+ detection was designed using carbon quantum dots based on fluorescence quenching. Linear relationships between the fluorescence variation and the Cu2+ level (1 mg·L-1 to 20 mg·L-1 and 20 mg·L-1 to 500 mg·L-1) were obtained, with coefficients of determination of 0.9960 and 0.9923, respectively. The Cu2+ detection limit was 4.26 mg·L-1. The probable quenching principle between Cu2+ and the carbon quantum dots was attributed to charge transfer.
Download PDF
Full Article
Preparation of Carbon Quantum Dots from Corn Straw and their Application in Cu2+ Detection
Jiliang Yang,a Zijiao Guo,b and Xiantian Yue a,*
Water-soluble carbon quantum dots were hydrothermally produced using corn straw as the starting material and nitric acid solution as solvent, then they were introduced as fluorescent probes for the detection of Cu2+. High-resolution transmission electron microscopy and X-ray diffraction showed that the carbon quantum dots were spherical amorphous particles with a diameter of 5 nm. The surface functional groups of carbon quantum dots were observed via Fourier transform infrared spectrometry and X-ray photoelectron spectroscopy. A new approach for Cu2+ detection was designed using carbon quantum dots based on fluorescence quenching. Linear relationships between the fluorescence variation and the Cu2+ level (1 mg·L-1 to 20 mg·L-1 and 20 mg·L-1 to 500 mg·L-1) were obtained, with coefficients of determination of 0.9960 and 0.9923, respectively. The Cu2+ detection limit was 4.26 mg·L-1. The probable quenching principle between Cu2+ and the carbon quantum dots was attributed to charge transfer.
DOI: 10.15376/biores.17.1.604-615
Keywords: Carbon dots; Corn straw; Copper ions; Detection
Contact information: a: College of Chemistry and Material Engineering, Chaohu University, Hefei 238024 China; b: School of Textiles and Fashion, Shanghai University of Engineering Science, Shanghai 201620 China; *Corresponding author: yuefeiyxt@aliyun.com
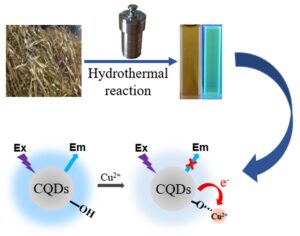
GRAPHICAL ABSTRACT
INTRODUCTION
Carbon quantum dots (CQDs) are one of the most attractive fluorescent nanomaterials, given they have the following advantages: low toxicity, high water-solubility, favorable biocompatibility, excellent electronic properties, high photostability, and easy surface functionalization (Xu et al. 2015; Yu et al. 2015; Su et al. 2018; Xie et al. 2019). For this reason, CQDs are successfully applied in many fields, including fluorescent ink (Li et al. 2018), solar cells (Briscoe et al. 2015), cell imaging (Huang et al. 2019), sensors (Yang et al. 2019), photocatalysis (Cao et al. 2011), and drug delivery (Feng et al. 2016). The synthesis method of carbon quantum dots can be roughly divided into top-down methods (e.g., arc discharge and laser burning) and bottom-up methods (e.g., hydrothermal, microwave digestion and ultrasonic oscillation). Many efforts have been made to synthesize CQDs using a variety of chemical precursors with different methods, including plasma discharge (Ke et al. 2018), laser ablation (Sidorov et al. 2018), microwave heating (Medeiros et al. 2019), chemical oxidation (Qiao et al. 2010), arc-discharge (Zhu et al. 2013), and electrochemical synthesis (Muthusankar et al. 2018). However, most of the above methods are unlikely to be extended because of toxic raw materials, complex operation processes, high costs, or severe synthetic conditions. In terms of environmental protection, the synthesis of CQDs from low-cost and nontoxic raw materials via an environmentally friendly route is a major issue.
In recent decades, biomass has been considered an important renewable resource and has been used to successfully prepare various materials. Several studies have employed biomass resources as starting materials to fabricate CQDs, e.g., highland barley (Xie et al. 2019), milk (Su et al. 2018), potatoes (Xu et al. 2015), oatmeal (Yu et al. 2015), hong cai tai (Li et al. 2018), flowers (Huang et al. 2019), plant leaves (Zhu et al. 2013), soybeans (Hu et al. 2019), and Dunaliella salina (Singh et al. 2019). However, most of these CQDs were synthesized from edible and usable materials, causing a waste of resources. Searching for new carbon sources for the easy utilization, extensive application, and green production of CQDs is urgently needed.
Agricultural straws, e.g., wheat straw and corn straw, which are major crop residues, consist of 28% to 36% cellulose, 23% to 28% hemicellulose, and 12% to 16% lignin (Jin et al. 2017). So far, nearly 27.1% of agricultural straw is used as roughage in livestock feed rations, approximately 14.1% is buried in soil for use as fertilizer, and approximately 32.3% is used as fuels, which causes air pollution and contributes to the greenhouse effect (Yuan et al. 2015). Hence, a new value-added strategy for the effective recycling of theses agricultural wastes is highly desirable.
Corn straw is one of the most common agricultural wastes in China. A high-value use of corn straw can relieve energy insecurity and reduce ecological pollution. Herein, corn straw was chosen as the model agricultural waste for CQD synthesis, providing a diverse use of corn straw as well as achieving a facile one-pot preparation of biomass-based CQDs. Moreover, when carbon quantum dots are in contact with metal ions, the phenomenon of fluorescence quenching occurs due to energy transfer, charge transfer and surface adsorption. Based on fluorescence quenching, the CQDs were applied for the highly selective and sensitive detection of Cu2+. Compared with other detection methods, the fluorescence detection method has the advantages of simple operation, no expensive equipment, and low price.
EXPERIMENTAL
Materials
Corn straw was collected from wheat fields in Anhui, China. The chemical reagents were made by Xilong Chemical Reagent Co., Ltd. (Guangdong, China). All reagents were analytically pure and used as received.
Preparation of the Carbon Quantum Dots (CQDs)
Corn straw was crushed to a size of approximately 60 mesh for the hydrothermal preparation of CQDs. Typically, 1.0 g of corn straw was added to 30 mL of a 0.2 mol·L-1 HNO3 solution and heated in a water bath at a temperature of 50 °C for 4 h. Then, the mixture was moved into a 50 mL Teflon-lined autoclave and heated at a temperature of 180 °C for 13 h. The product was harvested via centrifugation at 8000 rpm for 10 min to remove the unreacted raw materials and large carbon products before finally being freeze-dried under vacuum.
Characterization
First, the 100 mg·L-1 CQDs solution was loaded on a 300-mesh copper grid and dried at room temperature, then the CQDs were observed by a JEM-2100F transmission electron microscope (TEM) (JEOL, Tokyo, Japan). The functional groups of the CQDs were investigated using a FTIR-650 Fourier transform infrared spectrometer (FTIR) (Gangdong Science & Technology Development Co., China). The Kratos Axis Ultra HAS-Vision X-ray photoelectron spectroscope (XPS) was run under a monochromatized Al Kα radiation. Additional instruments included an F96Pro fluorescence emission spectrophotometer (Lengguang Science & Technology Development Co., China), an ESCALAB250 electron spectrometer (Thermo Electron, Waltham, MA), a D/Max-2000 X-ray diffractometer (XRD) (Rigaku Co., Tokyo, Japan), and an ultraviolet-visible spectrophotometer (UV1750, Shimadzu, Kyoto, Japan).
Fluorescence Quantum Yield (QY) Measurement
The fluorescence quantum yield (QY) of the CQDs was estimated with quinine sulfate as the reference (a QY of 0.54). The quinine sulfate and CQDs were diluted with 0.1 mol·L-1 H2SO4 (a refractive index (η) of 1.33) and ultrapure water (a η of 1.33), respectively, to different levels. The relative fluorescence QY of the CQDs was computed according to Eq. 1,
 (1)
(1)
where the subscript R is the reference, and K is the slope of the linear curve of the fluorescence integrated area against the absorbance (Gedda et al. 2016; Li et al. 2018).
Detection of Cu2+
In a typical Cu2+ detection experiment, 2 mL of a 500 mg·L-1 CQD solution was first added to a cuvette, and then 2 mL of a Cu2+ aqueous solution at a given concentration was injected. The resulting mixed solution was diluted to 10 mL with a phosphate buffer solution (PBS), with a pH of 6.7, and evenly mixed. The mixture was allowed to sit at ambient temperature 120 min to balance, and finally the FL intensity was measured under fluorescence excitation at 365 nm. The reaction time, volume of CQDs, type of buffer solution, pH effect, sensitivity, and selectivity were measured in triplicate for all experiments.
RESULTS AND DISCUSSION
Characterization of the Carbon Quantum Dots (CQDs)
The UV-vis spectrum and fluorescence spectroscopy are shown in Fig. 1. The CQDs solution is a dark yellow under normal light and a blue-green under a 365 nm UV lamp (as shown in the Fig. 1 inset). The UV-vis spectrum of CQDs shows a sharp absorption peak at approximately 300 nm, which is ascribed to the π→π* electron migration from the sp2 hybridized clusters (Gedda et al. 2016; Yuan et al. 2018; Qi et al. 2019; Ren et al. 2019). The emission peaks of the CQDs are excitation-dependent with the excitation wavelength increasing from 310 to 390 nm, and the strongest emission occurs under excitation at 350 nm, with a peak at 440 nm. As the excitation wavelength increased from 350 to 390 nm, the maximum emission peak right-shifted from 433 to 460 nm together with the decreased emission intensity. This unique phenomenon can be attributed to the optical selection of different defect states on the surface of the CQDs (Su et al. 2018). The quantum yield of the CQDs was measured to be 4.64%.

Fig. 1. Absorption and fluorescence spectrum of the CQDs solution. The inset images are the corresponding fluorescence images under visible light and UV light (365 nm).
The morphology of the CQDs was observed via high-resolution transmission electron microscopy (HRTEM). As shown in Fig. 2, most of the particles were spherically shaped and monodispersed, without apparent aggregation, and their sizes were approximately 5 nm. Figure 2 reveals the crystallinity of the CQDs with a lattice fringe of 0.208 nm, suggesting that the CQDs are composed of sp2 graphitic carbons, sp3 carbon defects, and surface functional groups, e.g., -OH, C=O, and -NH (Zhu et al. 2013). The XRD pattern of the CQDs (Fig. 3) displays a strong peak at ca. 24 °, which reveals the amorphous carbon structure of the CQDs (Gedda et al. 2016).

Fig. 2. HRTEM image of the CQDs

Fig. 3. XRD spectra of the CQDs
The FTIR and XPS spectra were also explored to observe the surface functional groups of the CQDs. The FTIR spectrum (Fig. 4) shows bands at 3180 and 3405 cm-1 caused by the O-H and N-H stretching vibrations of the amine groups (Yu et al. 2015). The characteristic peaks at 1610 and 1710 cm-1 represent C=C and C=O, respectively (Yan et al. 2016). The peak at 1384 cm-1 is assigned to C-N (Hu et al. 2019; Liu et al. 2019). The peaks at approximately 1175 cm-1 and 1090 cm-1 are ascribed to C-O-C and C-O stretching, respectively (Zhu et al. 2013; Yu et al. 2015; Qi et al. 2019). The peak at 834 cm-1 is due to the aromatic C-H stretching vibration (Jing et al. 2019; Ren et al. 2019). Furthermore, the peak at approximately 640 cm-1 is assigned to the CH2 stretching (Yang et al. 2018). These results were further verified via XPS.

Fig. 4. FTIR spectra of CQDs
The peaks at 296.43 eV, 410.43 eV, and 545.43 eV correspond to the C1s, N1s and O1s electrons, respectively (Fig. 5a). The elemental composition of the CQDs is C 52.85%, N 4.49%, and O 42.66%. The peaks in the high-resolution C1s spectrum (Fig. 5b) at 284.6 eV, 286.7 eV, and 288.7 eV are attributed to C-C, C-O, and C=O/C=N, respectively. The high-resolution N1s spectrum (Fig. 5c) demonstrates three peaks at 399.8, 400.5, and 401.8 eV, which confirm the presence of C-N-C, N-H, and C3-N, respectively. On the O1s spectrum (Fig. 5d), the two binding energy peaks at approximately 531.9 eV and 532.2 eV represent C-OH/C=O and C-O-C, respectively.


Fig. 5. XPS full spectrum of the CQDs (a) and the high-resolution C1s (b), N1s (c), and O1s (d) spectra of the CQDs
Optimization of the Detection Conditions
Reaction time
The ideal time scale complexation between the CQDs and Cu2+ was explored. First, 2 mL of a 500 mg·L-1 CQD solution and 2 mL of a 50 mg·L-1 Cu2+ aqueous solution were mixed and diluted to 10 mL with distilled water. After that, the time-dependent Cu2+-CQDs fluorescence intensity curve was recorded (Fig. 6a). The results indicated that the fluorescence intensity of the CQDs weakened with time, and stabilized after 120 min. The ideal reaction time was set to 120 min for further experiments.
Volume of the carbon quantum dots (CQDs) solution
The CQDs content has a major role in deciding the fluorescence intensity and quenching in a system. Thus, a series of experiments with different CQDs solution volumes were carried out to determine the appropriate volume. The fluorescence quenching efficiency can be calculated according to Eq. 2,
 (2)
(2)
where F0 and F correspond to the fluorescence intensities of the CQDs before and after adding Cu2+, respectively, and KSV is the Stern-Volmer quenching constant (Yang et al. 2019). The fluorescence intensity was enhanced as the volume of the CQDs solution increased. The quenching rate (F0–F)/F0 maximized at a volume of 2 mL (as shown in Fig. 6b), which was selected as the appropriate CQDs solution volume.
The effect of the buffer solution and pH on the fluorescence sensing system
The buffer solution and the pH are two essential factors that can affect the sensing system. Thus, a series of experiments with different buffer solutions and pHs were investigated to identify the appropriate buffer solution and pH (Fig. 6c and 6d). At a pH of approximately 7.4 for all solvents, the fluorescence quenching rate (F0–F)/F0) was maximized when the solvent was PBS, which was chosen for the detection system (Fig. 6c). The effect of the pH was also tested at a range of 5.9 to 8.0 in PBS (Fig. 6d). It was found that the (F0–F)/F0 was maximized at a pH of 6.7, which was set as the appropriate pH.

Fig. 6. (a) The effect of reaction time on the fluorescence intensity of the system; (b) the effect of different CQDs solution volumes on the fluorescence intensity and quenching rate; (c) the effect of the buffer solution on the fluorescence sensing system; and (d) the effect of the pH on fluorescence sensing system
Detection of Cu2+
Under optimal settings, the Cu2+ solutions at given concentrations (each 2 mL) were added to 2 mL of the 500 mg·L-1 CQDs solution, and then the above mixture solutions were all diluted to 10 mL with PBS (at a pH of 6.7). After the reactions proceeded at ambient temperature for 120 min, the fluorescence intensities were recorded under excitation at 365 nm. The fluorescence intensity of the CQDs decreased as the Cu2+ concentration increased (Fig. 7). Approximately linear relationships can be found at Cu2+ concentration of 1 to 20 mg·L-1 and 20 to 500 mg·L-1, with corresponding calibration curves of F0/F = 0.0078[Cu2+] + 1.0104 (R2 = 0.9960) and F0/F = 0.0002[Cu2+] + 1.1692 (R2= 0.9923), respectively. The detection limit of Cu2+ was calculated to be 4.26 mg·L-1 according to the ratio outlined in Eq. 3,
 (3)
(3)
where δ is the standard deviation of the blank experiments, and K stands for the slope of the calibration curve (Sun et al. 2019).

Fig. 7. (a) Fluorescence spectra of the N-CQDs (2 mL) in the presence of various concentrations of Cd2+ (from top to bottom: 0 mg·L-1, 1 mg·L-1, 5 mg·L-1, 10 mg·L-1, 15 mg·L-1, and 20 mg·L-1) in a PBS buffer solution at a pH of 6.7 under excitation at 365 nm; and (b) the fluorescence spectra of the N-CQDs (2 ml) in the presence of various concentrations of Cd2+ (from top to bottom: 0 mg·L-1, 20 mg·L-1, 50 mg·L-1, 100 mg·L-1, 200 mg·L-1, 300 mg·L-1, and 500 mg·L-1) in a PBS buffer solution at a pH of 6.7 under excitation at 365 nm (note: the inset images are the standard curve of the concentration of Cd2+ versus F0/F)
The selectivity was investigated by adding other metal ions (500 mg·L-1), including Zn2+, Co2+, Fe2+, Ni2+, Mg2+, Pb2+, Ag+, Mn2+, Cd2+, and K+. The fluorescence intensities of the CQDs before and after the addition of metal ions were recorded at 365 nm. The quenching changes with different metal ions are indicated in Fig. 8. Clearly, the fluorescence intensity of CQDs was further quenched in the presence of Cu2+ compared with the other metal ions. This may be because of the faster Cu2+ chelating kinetics and a higher affinity toward the oxygen-containing functional groups, e.g., -COOH, -OH, and -NH, on the surface of CQDs compared with other ions (Hu et al. 2014; Gedda et al. 2016; Xu et al. 2021). Furthermore, paramagneticism makes Cu2+ more easily adsorbed on the surface of CQDs (Murugan et al. 2019). Thus, the fluorescence of CQDs may be quenched by Cu2+ via electron transfer, in which Cu2+ acts as an electron acceptor to block the electron-hole link (Hu et al. 2014; Wang et al. 2019).

Fig. 8. Selectivity of the CQDs fluorescence probe toward 50 mg/L Cu2+ over the coexisting cations under optimal conditions
CONCLUSIONS
- Corn straw was successfully used as a raw material for hydrothermally producing carbon quantum dots (CQDs), which were used as a sensor for copper ions. High-resolution transmission electron microscopy (TEM) and X-ray diffraction (XRD) indicated that most of the CQDs particles were amorphous carbon with a lattice fringe of 0.208 nm. In addition, Fourier transform infrared spectrometry (FTIR) and X-ray photoelectron spectrometry (XPS) showed that the surface of the CQDs was rich in oxygen-containing and nitrogen-containing functional groups.
- The fluorescence of the CQDs can be quenched by Cu2+ because of charge transfer; the CQDs were then used as a sensing probe for Cu2+ detection. The linear relationships between the fluorescence change and the Cu2+ content (1 mg·L-1 to 20 mg·L-1 and 20 mg·L-1 to 500 mg·L-1) were obtained, with coefficients of determination of 0.9960 and 0.9923, respectively. The detection limit of Cu2+ was 4.26 mg·L-1.
- This work presents a simple method for the utilization of corn straw. The final CQDs exhibited excellent water dispersibility and chemical properties, which are promising for wide applications in environmental monitoring.
ACKNOWLEDGMENTS
This research was supported by the school-level Scientific Research Projects of Chaohu University (No. XLZ-201805 and No. XLZ-201806) and the Natural Science Research Project in Colleges and Universities of Anhui Province (No. KJ2019A0678).
REFERENCES CITED
Briscoe, J., Marinovic, A., Sevilla, M., Dunn, S., and Titirici, M. (2015). “Biomass-derived carbon quantum dot sensitizers for solid-state nanostructured solar cells,” Angewandte Chemie 54(15), 4463-4468. DOI: 10.1002/anie.201409290
Cao, L., Sahu, S., Anilkumar, P., Bunker, C. E., Xu, J., Fernando, K. A. F., Wang, P., Guliants, E. A., Tackett II, K. N., and Sun, Y.-P. (2011). “Carbon nanoparticles as visible-light photocatalysts for efficient CO2 conversion and beyond,” Journal of the American Chemical Society 133(13), 4754-4757. DOI: 10.1021/ja200804h
Feng, T., Ai, X., An, G., Yang, P., and Zhao, Y. (2016). “Charge-convertible carbon dots for imaging-guided drug delivery with enhanced in vivo cancer therapeutic efficiency,” ACS Nano 10(4), 4410-4420. DOI: 10.1021/acsnano.6b00043
Gedda, G., Lee, C.-Y., Lin, Y.-C., and Wu, H. (2016). “Green synthesis of carbon dots from prawn shells for highly selective and sensitive detection of copper ions,” Sensors and Actuators B: Chemical 224, 396-403. DOI: 10.1016/j.snb.2015.09.065
Hu, C., Yu, C., Li, M., Wang, X., Yang, J., Zhao, Z., Eychmüller, A., Sun, Y.-P., and Qiu, J. (2014). “Chemically tailoring coal to fluorescent carbon dots with tuned size and their capacity for Cu(II) detection,” Small 10(23), 4926-4933. DOI: 10.1002/smll.201401328
Hu, Y., Chen, Z., Lai, F., and Li, J. (2019). “Biomass-codoped carbon dots: Efficient fluorescent probes for isocarbophos ultrasensitive detection and for living cells dual-color imaging,” Journal of Materials Science 54(11), 8627-8639. DOI: 10.1007/s10853-019-03494-9
Huang, K., He, Q., Sun, R., Fang, L., Song, H., Li, L., Li, Z., Tian, Y., Cui, H., and Zhang, J. (2019). “Preparation and application of carbon dots derived from cherry blossom flowers,” Chemical Physics Letters 731, 1-5. DOI: 10.1016/j.cplett.2019.07.014
Jin, S., Chen, J., Mao, J., Yue, G., Han, Y., and Yu, X. (2017). “A novel superabsorbent from raw corn straw and poly(acrylic acid),” Polymer Composites 38(7), 1353-1362. DOI: 10.1002/pc.23701
Jing, S., Zhao, Y., Sun, R.-C., Zhong, L., and Peng, X. (2019). “Facile and high-yield synthesis of carbon quantum dots from biomass-derived carbons at mild condition,” ACS Sustainable Chemistry & Engineering 7(8), 7833-7843. DOI: 10.1021/acssuschemeng.9b00027
Ke, C.-B., Lu, T.-L., and Chen, J.-L. (2018). “Capacitively coupled plasma discharge of ionic liquid solutions to synthesize carbon dots as fluorescent sensors,” Nanomaterials 8(6), 372-383. DOI: 10.3390/nano8060372
Li, L.-S., Jiao, X. -Y., Zhang, Y., Cheng, C., Huang, K., and Xu, L. (2018). “Green synthesis of fluorescent carbon dots from Hongcaitai for selective detection of hypochlorite and mercuric ions and cell imaging,” Sensors and Actuators B: Chemical 263, 426-435. DOI: 10.1016/j.snb.2018.02.141
Liu, Z., Jin, W., Wang, F., Li, T., Nie, J., Xiao, W., Zhang, Q., and Zhang, Y. (2019). “Ratiometric fluorescent sensing of Pb2+ and Hg2+ with two types of carbon dot nanohybrids synthesized from the same biomass,” Sensors and Actuators B: Chemical 296, 1-8. DOI: 10.1016/j.snb.2019.126698
Medeiros, T. V. d., Manioudakis, J., Noun, F., Macairan, J.-R., Victoria, F., and Naccache, R. (2019). “Microwave-assisted synthesis of carbon dots and their applications,” Journal of Materials Chemistry C 7(24), 7175-7195. DOI: 10.1039/C9TC01640F
Murugan, N., Prakash, M., Jayakumar, M., Sundaramurthy, A., and Sundramoorthy, A. K. (2019). “Green synthesis of fluorescent carbon quantum dots from Eleusine coracana and their application as a fluorescence ‘turn-off’ sensor probe for selective detection of Cu2+,” Applied Surface Science 476, 468-480. DOI: 10.1016/j.apsusc.2019.01.090
Muthusankar, G., Sasikumar, R., Chen, S.-M., Gopu, G., Sengottuvelan, N., and Rwei, S.-P. (2018). “Electrochemical synthesis of nitrogen-doped carbon quantum dots decorated copper oxide for the sensitive and selective detection of non-steroidal anti-inflammatory drug in berries,” Journal of Colloid and Interface Science 523, 191-200. DOI: 10.1016/j.jcis.2018.03.095
Qi, H., Teng, M., Liu, M., Liu, S., Li, J., Yu, H., Teng, C., Huang, Z., Liu, H., Shao, Q., et al. (2019). “Biomass-derived nitrogen-doped carbon quantum dots: highly selective fluorescent probe for detecting Fe3+ ions and tetracyclines,” Journal of Colloid and Interface Science 539, 332-341. DOI: 10.1016/j.jcis.2018.12.047
Qiao, Z.-A., Wang, Y., Gao, Y., Li, H., Dai, T., Liu, Y., and Huo, Q. (2010). “Commercially activated carbon as the source for producing multicolor photoluminescent carbon dots by chemical oxidation,” Chemical Communications 46(46), 8812-8814. DOI: 10.1039/c0cc02724c
Ren, R., Zhang, Z., Zhao, P., Shi, J., Han, K., Yang, Z., Gao, D., and Bi, F. (2019). “Facile and one-step preparation carbon quantum dots from biomass residue and their applications as efficient surfactants,” Journal of Dispersion Science and Technology 40(5), 627-633. DOI: 10.1080/01932691.2018.1475239
Ren, X., Zhang, F., Guo, B., Gao, N., and Zhang, X. (2019). “Synthesis of N-doped micropore carbon quantum dots with high quantum yield and dual-wavelength photoluminescence emission from biomass for cellular imaging,” Nanomaterials 9(4), 1-13. DOI: 10.3390/nano9040495
Sidorov, A. I., Lebedev, V. F., Kobranova, A. A., and Nashchekin, A. V. (2018). “Formation of carbon quantum dots and nanodiamonds in laser ablation of a carbon film,” Quantum Electronics 48(1), 45-48. DOI: 10.1070/QEL00000
Singh, A. K., Singh, V. K., Singh, M., Singh, P., Khadim, S. R., Singh, U., Koch, B., Hasan, S. H., and Ashtana, R. K. (2019). “One pot hydrothermal synthesis of fluorescent NP-carbon dots derived from Dunaliella salina biomass and its application in on-off sensing of Hg (II), Cr (VI) and live cell imaging,” Journal of Photochemistry and Photobiology A: Chemistry 376, 63-72. DOI: 10.1016/j.jphotochem.2019.02.023
Su, R., Wang, D., Liu, M., Yan, J., Wang, J.-X., Zhan, Q., Pu, Y., Foster, N. R., and Chen, J.-F. (2018). “Subgram-scale synthesis of biomass waste-derived fluorescent carbon dots in subcritical water for bioimaging, sensing, and solid-state patterning,” ACS Omega 3(10), 13211-13218. DOI: 10.1021/acsomega.8b01919
Sun, X., Liu, Y., Niu, N., and Chen, L. (2019). “Synthesis of molecularly imprinted fluorescent probe based on biomass-derived carbon quantum dots for detection of mesotrione,” Analytical and Bioanalytical Chemistry 411(21), 5519-5530. DOI: 10.1007/s00216-019-01930-y
Wang, N., Li, X., Yang, X., Tian, Z., Bian, W., and Jia, W. (2019). “Nitrogen-doped carbon dots as a probe for the detection of Cu2+ and its cellular imaging,” Journal of Chemical Research 43(11-12), 507-515. DOI: 10.1177/1747519819875046
Xie, Y., Cheng, D., Liu, X., and Han A. (2019). “Green hydrothermal synthesis of N-doped carbon dots from biomass highland barley for the detection of Hg2+,” Sensors 19(14), 1-10. DOI: 10.3390/s19143169
Xu, J., Zhou, Y., Cheng, G., Dong, M., Liu, S., and Huang, C. (2015). “Carbon dots as a luminescence sensor for ultrasensitive detection of phosphate and their bioimaging properties,” Luminescence 30, 411-415. DOI: 10.1002/bio.2752
Xu, O., Wan, S., Zhang, Y., Li, J., and Zhu, X. (2021). “A unique dual-excitation carbon quantum dots: Facile synthesis and application as a dual-“on-off-on” fluorescent probe,” Sensors and Actuators B: Chemical 340, 129904. DOI: 10.1016/j.snb.2021.129904
Yan, Z., Zhang, Z., and Chen, J. (2016). “Biomass-based carbon dots: synthesis and application in imatinib determination,” Sensors and Actuators B: Chemical 225, 469-473. DOI: 10.1016/j.snb.2015.10.107
Yang, J., Chen, L., Jiang, Q., and Yue, X. (2019). “Optimized preparation of nitrogen-doped carbon dots by response surface methodology and application in Cd2+ detection,” Fullerenes, Nanotubes and Carbon Nanostructures 27(3), 233-239. DOI: 0.1080/1536383X.2018.1551211
Yang, Q., Duan, J., Yang, W., Li, X., Mo, J., Yang, P., and Tang, Q. (2018). “Nitrogen-doped carbon quantum dots from biomass via simple one-pot method and exploration of their application,” Applied Surface Science 434, 1079-1085. DOI: 10.1016/j.apsusc.2017.11.040
Yu, C., Xuan, T., Chen, Y., Zhao, Z., Sun, Z., and Li. H. (2015). “A facile, green synthesis of highly fluorescent carbon nanoparticles from oatmeal for cell imaging,” Journal of Materials Chemistry C 3(37), 9514-9518. DOI: 10.1039/c5tc02057c
Yuan, H., Zhang, X., Li, D., and Chen, Y. (2018). “Strongly fluorescent carbon quantum dots from biomass tar as highly selective and sensitive probe for Fe3+ detection,” Nano 13(4), 1-12. DOI: 10.1142/S1793292018500431
Yuan, M., Zhong, R., Gao, H., Li, W., Yun, X., Liu, J., Zhao, X., Zhao, G., and Zhang, F. (2015). “One-step, green, and economic synthesis of water-soluble photoluminescent carbon dots by hydrothermal treatment of wheat straw, and their bio-applications in labeling, imaging, and sensing,” Applied Surface Science 355, 1136-1144. DOI: 10.1016/j.apsusc.2015.07.095
Zhu, L., Yin, Y., Wang, C.-F., and Chen, S. (2013). “Plant leaf-derived fluorescent carbon dots for sensing, patterning and coding,” Journal of Materials Chemistry C 1(32), 4925-4932. DOI: 10.1039/c3tc30701h
Article submitted: August 2, 2021; Peer review completed: September 18, 2021; Revised version received and accepted: October 12, 2021; Published: December 1, 2021.
DOI: 10.15376/biores.17.1.604-615