
Abstract
One-step pyrolysis is a promising thermal degradation process that has a fast reaction rate and high energy efficiency. In this study, high performance bamboo activated carbon was successfully prepared by one-step pyrolysis with different pyrolysis times (2.5 h, 5 h, and 10 h). Using a high pyrolysis temperature of 1050 °C, the specific surface area was remarkably increased to 2348 m2/g, which was substantially higher than the findings reported previously by other studies. The mesopore ratio was increased to 77.4%, which indicated that the bamboo activated carbon mainly contained microporous carbon and the mesoporosity was considerably developed. The activated carbon was then applied successfully to remove Methylene Blue from aqueous solutions. The adsorption equilibrium data was fit best to the Langmuir model. The maximum adsorption capacity ranged from 495 mg/g to 1667 mg/g.
Download PDF
Full Article
Preparation of High-performance Activated Carbons Using Bamboo through One-step Pyrolysis
Xinxin Ma,a Lee M. Smith,b Liping Cai,b Sheldon Q. Shi,b Hui Li,c,* and Benhua Fei a,*
One-step pyrolysis is a promising thermal degradation process that has a fast reaction rate and high energy efficiency. In this study, high performance bamboo activated carbon was successfully prepared by one-step pyrolysis with different pyrolysis times (2.5 h, 5 h, and 10 h). Using a high pyrolysis temperature of 1050 °C, the specific surface area was remarkably increased to 2348 m2/g, which was substantially higher than the findings reported previously by other studies. The mesopore ratio was increased to 77.4%, which indicated that the bamboo activated carbon mainly contained microporous carbon and the mesoporosity was considerably developed. The activated carbon was then applied successfully to remove Methylene Blue from aqueous solutions. The adsorption equilibrium data was fit best to the Langmuir model. The maximum adsorption capacity ranged from 495 mg/g to 1667 mg/g.
Keywords: Bamboo; One-step pyrolysis; Activated carbon; Specific surface area
Contact information: a: Key Laboratory of Bamboo and Rattan Science and Technology of the State Forestry Administration, Department of Biomaterials, International Center for Bamboo and Rattan, No.8, Futong Eastern Street, Wangjing Area, Chaoyang District. Beijing, China; b: Department of Mechanical and Energy Engineering, University of North Texas, Denton, TX, USA; c: Hubei Academy of Forestry, Wuhan, China; *Corresponding authors: 827231442@qq.com; feibenhua@icbr.ac.cn
INTRODUCTION
Pyrolysis generates various gaseous, liquid, and carbon products. Most of the literature concerning pyrolysis has focused on activated carbon production (Xiao et al. 2007; Tian et al. 2011). Activated carbon is an excellent adsorbent that has a large pore volume and high specific surface area. It has been broadly used for purification, catalysis, separation, and energy storage (Ben-Mansour et al. 2016). However, extensive application of activated carbon is limited because of its high cost. Bamboo is an abundant and inexpensive natural resource, and has acted an alternative source for generating activated carbon. Typically, chemical (acid, strong base, or salt) or physical activation (water steam) under various conditions is used to prepare bamboo carbon. The results of earlier studies have shown that the Brunauer-Emmett-Teller (BET) specific surface area ranges from 488 m2/g to 2175 m2/g (Ip et al. 2008; Wang et al. 2008; Horikawa et al. 2010; Mui et al. 2010).
There are several studies on the applicability of bamboo in numerous adsorption processes. It has successfully removed dye from aqueous solutions, and the adsorption capacity was found to range from 143.2 mg/g to 454.2 mg/g (Kannan and Sundaram 2001; Hameed et al. 2007; Hameed and El-Khaiary 2008). Bamboo can also be used to remove impurities, such as metal ions or chloramphenicol, from liquid solutions (Wang et al. 2008; Fan et al. 2010). However, all of these activation methods, whether physical or chemical, have environmental consequences and drive up the processing cost. Therefore, more efficient methods are highly desirable.
A more efficient method is the one-step pyrolysis process (Xia et al. 2016a,b; Shi and Xia 2017), which is also named the self-activation process, as it uses the gases emitted from the biomass during pyrolysis to serve as an activation agent. The pyrolysis, activation, and carbonization processes are combined into one step. In the self-activation process, the pyrolysis gases, CO2 and H2O, serve as activation agents to activate the carbon. Therefore, the advantages of the one-step pyrolysis process are not only the creation of a high specific surface area, but also cost savings because no activating gas or chemical is used.
Moso bamboo is abundant in China and it is widely used. In this study, moso bamboo (Phyllostachys edulis) was used to produce activated carbon using the one-step pyrolysis process. Furthermore, the characteristics and adsorption properties of the resulting activated carbon were examined.
EXPERIMENTAL
One-step Pyrolysis of the Bamboo Activated Carbon
A box furnace (Fig. 1a) (STY-1600C, Sentro Tech Corp., Texas, USA) with a maximum temperature of 1600 °C was used to convert bamboo into activated carbon. A k-type thermocouple with a data logger (TC101A, MadgeTech, Inc., Texas, USA) was used to detect the internal temperature. A digital pressure gauge (ADT680W-25-CP15-PSI-N, Additel Corp., Texas, USA) in the furnace chamber was used to measure the pressure.
Moso bamboo was used for the preparation of bamboo activated carbon (BAC). Four-year-old bamboo was obtained from Anhui Province, China. The bamboo specimens were sawn from 1.5 m high of bamboo culm, and cut into 3.5cm(l)×2.5cm(b) ×0.6cm(h), which is shown in Fig. 1b. The bamboo specimens were then dried to 7% moisture content. The following procedure was performed (Xia and Shi 2016a,b). After placing the bamboo specimens into the box furnace chamber (Fig. 1a), the inner volume of the chamber was evacuated to a pressure of −97906 Pa ± 34 Pa (-73.4-mm mercury, 96.6% vacuum) and all of the valves were closed to create a sealed system without any mass exchange. Finally, during the pyrolysis stage, the temperature was increased to 1050 °C at a heating rate of 10 ℃/min, maintained, and then cooled to room temperature. The pyrolysis times were 2.5 h, 5 h, and 10 h and the prepared BACs were referred to as BAC2.5, BAC5, and BAC10, respectively.
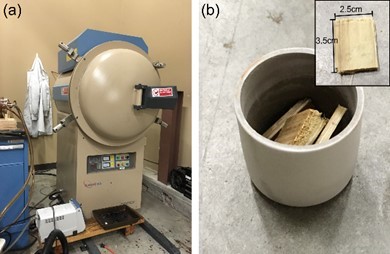
Fig. 1. Box furnace (a) and specimens (b)
Characterization of the Bamboo Activated Carbon
Carbon surface morphologies were examined with scanning electron microscopy (SEM). Surface area and pore volume were measured using the nitrogen adsorption method with a surface analyzer (3Flex 3500, Micromeritics Instrument Corp., Texas, USA) at a temperature of 77 K. The surface area was determined using BET method, pore size distribution using Barrett-Joyner-Halenda (BJH) method, and pore volumes were calculated based on non-local density functional theory (NLDFT). The overall surface area was measured using the BET method. The mesopores (pore sizes of 2 nm to 300 nm) were examined using the BJH model, and the micropores (pore sizes of 0.393 nm to 2.002 nm) were determined using the NLDFT model.
Adsorption Examination
To explore the adsorption performance of the activated carbon for adsorbing dye, Methylene Blue (MB) was selected. This dye is widely used in the dyeing industry and has a high stability. The MB dye was supplied by Tianjin Kemiou Chemical Reagent Company (Tianjin, China). Using a double beam ultraviolet spectrophotometer (UV 2800, SOPTOP, Shanghai, China) at 668 nm, the MB concentrations before and after the adsorption tests were determined. The BAC was added to the dye solutions (100 mL) with different initial concentrations (100 mg/L to 500 mg/L). The solutions were kept in an isothermal shaker (30 °C ± 1 ℃) for 48 h to reach a solid-solution mixture equilibrium. The isotherm experiments were conducted at 30 ℃. The amount of adsorption (q, mg/g) at equilibrium was calculated using Eq. 1 (Ghaedi and Kokhdan 2015),
![]()
where C0 and Ce (mg/L) are the liquid-phase concentrations of the dye at the initial and equilibrium conditions, respectively, V is the volume of the solution (L), and W is the mass of the dry adsorbent used (g).
RESULTS AND DISCUSSION
Pore Properties of the Moso Bamboo Carbon
The N2 adsorption and desorption isotherms of all of the samples are shown in Fig. 2. The isotherms of BAC2.5, BAC5, and BAC10 exhibited a hysteresis loop, which suggested the existence of mesopores in the carbon. This indicated that the BAC contains microporous carbons and the mesoporosity was considerably developed. When the pyrolysis time was increased, the hysteresis loop area also increased. The surface area was largest when the pyrolysis time was 10 h. This indicated a large amount of mesopores in BAC10.
Table 1 summarizes the BET area (SBET), total pore volume (Vtot), micropore volume (Vmicro), and mesopore volume (Vmeso) that were obtained by analyzing all of the isotherm data. The SBET values revealed the porosity of the activated carbon. Table 1 shows that the specific surface area increased with an increase in the pyrolysis time, which reached a maximum value of 2348 m2/g with BAC10. Similar to the SBET, the Vtot also increased, from 0.94 cm3/g to 2.30 cm3/g, with an increased pyrolysis time. It was observed that increasing the pyrolysis time led to an increase in the surface area and total volume of the samples. The fraction of Vmicro to Vtot decreased from 66.0% to 22.6% with an increase in the pyrolysis time, while the fraction of the Vmeso showed a maximum value of 77.4% with BAC10.
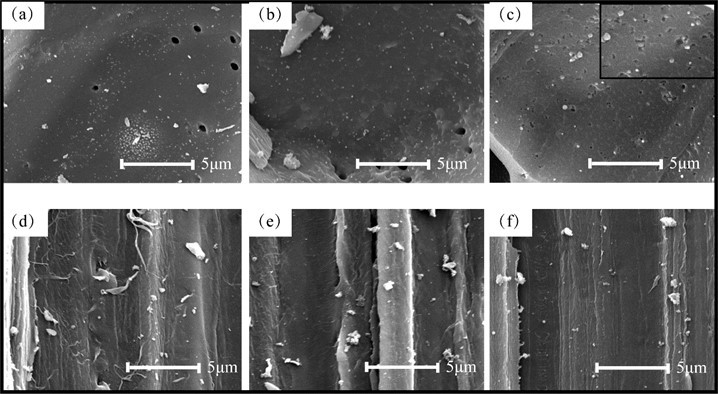
Fig. 2. Adsorption isothermal curves of the BAC at different pyrolysis times
Table 1. Pore Characteristics of the BAC

SBET – BET area; Vmicro – Micropore volume; Vmeso – Mesopore volume; Vtot – Total pore volume
Scanning Electron Microscopy and Pore Size Distribution
Figure 3 shows images of different tissue types in the BACs observed with SEM. The surface of the parenchyma part was smooth for BAC2.5 and BAC5 (Figs. 3a and 3b). There was a rather large difference in the appearance of the surface of BAC10. When the pyrolysis time was increased to 10 h, many pores of various sizes and geometries were present on the surface of the parenchyma (Fig. 3c), which indicated that BAC10 was highly porous. Figures 3d to 3f show the surfaces of the BAC fiber parts for the different pyrolysis times. Many microfibrils were clearly apparent on the surface of BAC2.5, while the amount of microfibrils decreased on BAC5. The fiber surface was smooth when the pyrolysis time was 10 h and the microfibrils were hard to observe, which indicated that the microfibrils were carbonized during the activation process. Therefore, the BAC structure was substantially changed because of the change in the pyrolysis time from 5 h to 10 h, which resulted in a rapid increase in the number of mesopores.
The pore size distribution was analyzed by the NLDFT equilibrium model and is presented in Fig. 4 as the derivative dv/dw (Ma et al. 2015). In this function, v is the pore volume (cm2/g) and w (nm) is the pore width (nm). The majority of the pore sizes ranged from 0.04 nm to 60 nm for the carbon samples. The micropores ranged from 0.04 nm to 1 nm, which resulted in a decrease in the pore sizes with an increase in the pyrolysis time. There was no clear trend for the pore sizes of 1 nm to 2 nm. For the mesopores, the number of pores greater than 2 nm showed a moderate increase with an increase in the pyrolysis time.
Fig. 3. Scanning electron micrographs of different cell types of BAC (a-c) parenchyma parts at three activated times, 2.5h, 5h and10h (d-f) fiber parts at three activated time, 2.5h, 5h and 10h.
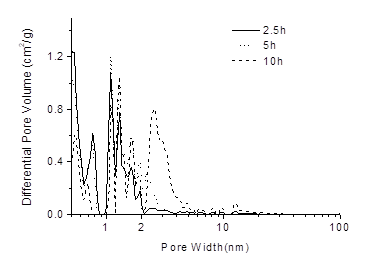
Fig. 4. Pore size distribution of the BAC at different pyrolysis times obtained by the NLDFT method
Adsorption of the Bamboo Activated Carbon
To evaluate the adsorption potential of the BACs, MB dye solutions were used. Adsorption isotherms were determined under equilibrium conditions. The different BAC samples were tested with different initial dye concentrations (100 mg/L to 500 mg/L) at a temperature of 30 ℃. Figure 5 shows the amount of adsorption at equilibrium with different initial dye concentrations and pyrolysis times. For BAC2.5 and BAC5, the contact time required for all of the concentrations to reach equilibrium was approximately 12 h. For BAC10, the contact time required to reach equilibrium was approximately 8 h. These results indicated that the contact time decreased with an increase in the BET surface area.
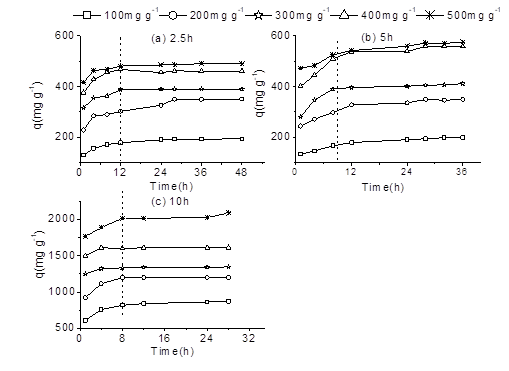
Fig. 5. Adsorption of MB onto the BACs at various initial dye concentrations at 30 °C for (a) BAC2.5, (b) BAC5, and (c) BAC10
The adsorption amount at equilibrium increased with an increase in the initial dye concentration for all of the BAC samples. The equilibrium concentration of BAC2.5 ranged from 193.3 mg/g to 480.9 mg/g, while the equilibrium concentration for BAC5 and BAC10 ranged from 199.1 mg/L to 571.9 mg/L and 869.6 mg/L to 2025.6 mg/L, respectively. It was evident that when the pyrolysis time was 10 h, the equilibrium concentration sharply increased. The increase rate from 5 h to 10 h was much larger than that from 2.5 h to 5 h. This was mainly the result of the mesopore content increasing sharply when the pyrolysis time was 10 h.
Adsorption Isotherms
The adsorption kinetics is one of the most important parameters for evaluating the adsorption efficiency. The data obtained during the equilibrium investigation was fit to traditional adsorption isotherm equations using non-linear fitting methods (Origin 8.5 software, Origin Lab, Massachusetts, USA.), namely the Langmuir and Freundlich isotherms, to examine the equilibrium specifications of the adsorption process. It was assumed that the adsorption process took place on a homogeneous surface that had a finite number of adsorption sites. It was apparent that a monolayer of adsorbate was formed at the saturation point on the adsorbent surface (Weber Jr. 1972).
The Langmuir model is given by Eqs. 2 and 3,
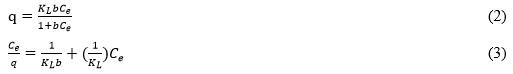
where Ce is the equilibrium concentration of the adsorbate (mg/L), q is the amount of adsorbate adsorbed per unit mass (mg/g), KL is the maximum adsorption capacity (mg/g), and b is the Langmuir constant related to the adsorption rate.
A straight line for Ce/q against Ce was obtained, which indicated that the adsorption followed the Langmuir model.
The Freundlich isotherm model describes non-ideal adsorption on heterogeneous surface energies, and it is expressed as Eqs. 4 and 5 (Weber Jr. 1972),
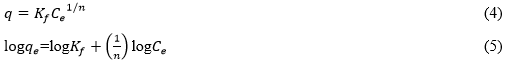
where Ce represents the MB concentration at the equilibrium time (mg/L), n is the adsorption intensity, and Kf is the relative adsorption capacity (mg/g).
It was illustrated that the adsorbate is favorable on the adsorbent when n is greater than 1. Therefore, when the value of n is higher, then the adsorption intensity that can be obtained is more favorable (Ahmad and Alrozi 2011). A straight line for log qe versus log Ce was also obtained, which revealed that the dye adsorption followed the Freundlich isotherm.
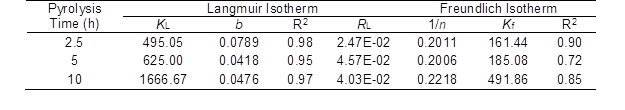
The parameters calculated from the Langmuir and Freundlich isotherms are listed in Table 2. The coefficient of determination (R2) was used to evaluate the best-fitting isotherm. The Langmuir model had higher R2 values than the Freundlich model at each pyrolysis time. This indicated that the BAC surface was made up of more homogenous adsorption patches than heterogeneous adsorption patches (Özcan et al. 2007). Based on the Langmuir model, the maximum adsorption capacity for the three pyrolysis times ranged from 495 mg/g to 1667 mg/g.
Table 2. Langmuir and Freundlich Isotherm Model Parameters for the Adsorption by the BACs
To confirm the favorability of the adsorption process, a basic method by Weber and Chakravorti (1974) was used. This method shows the nature of favorable and unfavorable processes using a separation factor (RL), which is defined as Eq. 6,
![]()
where b is the Langmuir constant and C0 is the highest initial solute concentration (mg/L).
The adsorption is unfavorable when RL is greater than 1, linear when RL is 1, favorable when RL is between 0 and 1, and irreversible when RL is 0. The RL values were calculated and are presented in Table 2. The RL values for the carbon samples with three different pyrolysis times were found to be less than 1. It was confirmed that the BAC was favorable for the adsorption of MB dye.
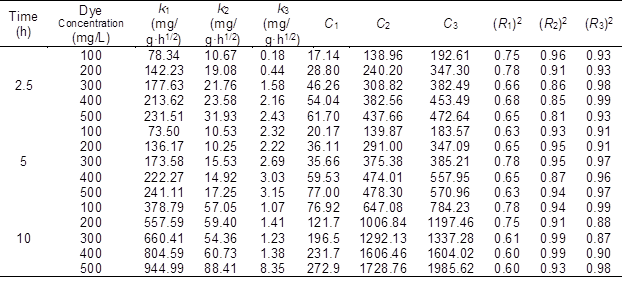
Table 3. Pseudo-first- and Pseudo-second-order Adsorption Kinetic Parameters at Different Initial Dye Concentrations for Different BAC Pyrolysis Times
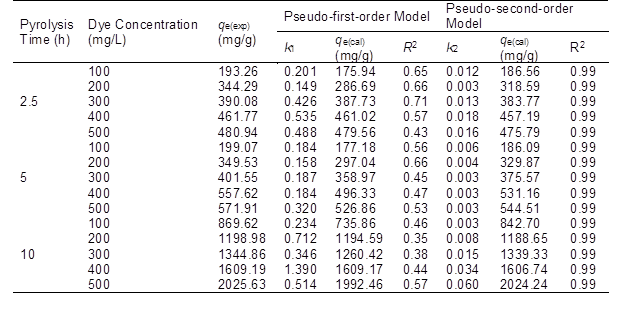
qe(exp) – Experimental amount of dye adsorbed at equilibrium; qe(cal) – Calculated amount of dye adsorbed at equilibrium
Adsorption Kinetics
To evaluate the mechanism of the BAC adsorption process, pseudo-first- and pseudo-second-order kinetic models were used. The rate constant was determined with the pseudo-first-order kinetic equation (Eq. 7) (Langergren and Svenska 1898),
![]()
where qt and qe represent the amounts of dye (mg/g) adsorbed at time t (min) and equilibrium, respectively, and k1 is the pseudo-first-order rate constant (1/h).
The pseudo-second-order equation is expressed as Eq. 8,
![]()
where qt and qe represent the amounts of dye adsorbed at time t (min) and equilibrium, respectively, and k2 is the pseudo-second-order rate constant (g/mg·h).
The two kinetic model parameters for the different BACs at different initial MB concentrations were calculated and are listed in Table 3. The table shows that the coefficients of determination for the pseudo-first-order model were 0.71 or lower, while all of the R2 values of the pseudo-second-order model were 0.99. The experimental values of qe fit better with the calculated values obtained from the pseudo-second-order model than those from the pseudo-first-order kinetic model. Therefore, it was determined that the pseudo-second-order model (Rudzinski and Plazinski 2009) can be used to describe the BAC adsorption of MB.
Adsorption Mechanism
Because the pseudo-first- and pseudo-second-order models cannot describe the adsorption mechanism of intraparticle diffusion, an intraparticle diffusion model based on diffusive mass transfer was used (Maneerung et al. 2016). It was assumed that intraparticle diffusion was the rate-limiting step for the adsorption process (Eq. 9),
![]()
where kID represents the intraparticle diffusion rate constant (mg/g·h1/2), which is obtained from the slope of the straight line of qt versus t1/2, and C represents the boundary layer effect.
It has been illustrated that when the C values are higher, the contribution of the surface sorption that can be obtained in the rate-controlling step is greater.

Fig. 6. Three typical stages of the intraparticle diffusion model for the BAC2.5
Figure 6 shows the intraparticle diffusion plots for MB adsorption by BAC2.5. It was clearly shown that the entire adsorption process had three stages. The first stage was the instantaneous adsorption stage up to 4 h, usually because of the strong electrostatic attraction between the adsorbent external surfaces and dye (Ahmad et al. 2014). The second stage was a gradual adsorption stage that proceeded from 4 h to 24 h and was related to the diffusion of dye molecules through the pores of the adsorbent (Hameed and El-Khaiary 2008). The third stage occurred after 24 h, where the adsorption trend started to slow down because of the extremely low adsorbate concentration in the solution (Wang et al. 2010). If linear lines pass through the origin, then the mechanism is only limited for the adsorption rate. However, this trend did not occur in this study, which indicated that intraparticle diffusion was not the only rate-limiting step. The three stages also occurred in the other two BAC samples (BAC5 and BAC10), although the specific times of the three stages had slight differences. The parameters for all of the BAC samples are shown in Table 4.
The rate constant values for the three stages increased with an increase in the initial dye concentration. This relationship showed a high contribution to intraparticle diffusion in the adsorption process. The constant C also increased with an increase in the initial dye concentration, which suggested an increase in the thickness of the boundary layer. All of these behaviors indicated that the amount of internal mass transfer increased with the initial dye concentration. It was also shown that the k1 and k2 values had a strong positive correlation with the pyrolysis time at the same initial dye concentration, while k3 did not. It was observed that the diffusion rate in the third stage was not much affected by the adsorption capacity.
Table 4. Intraparticle Diffusion Model Parameters for the Adsorption by the BACs
CONCLUSIONS
The bamboo activated carbon (BAC) was prepared using the one-step pyrolysis process with pyrolysis times of 2.5 h, 5 h, and 10 h. The following conclusions can be drawn from this study:
For the microporous carbon, the specific surface areas ranged from 1456 m2/g to 2348 m2/g when the pyrolysis time increased from 2.5 h to 10 h.
A wide pore size distribution range from 0.04 nm to 60 nm was seen for all of the carbon samples and a high ratio of mesopores (77.4%) was seen for BAC10.
The activated carbon successfully removed MB from the aqueous solutions. The adsorption equilibrium data was fit best by the Langmuir model. The maximum adsorption capacity ranged from 495 mg/g to 1667 mg/g.
This BAC, which had the best adsorption capacity, could be used to develop a wastewater treatment field.
ACKNOWLEDGMENTS
This work was supported by the Basic Scientific Research Funds of International Center for Bamboo and Rattan (1632018017) and USDA NIFA Foundation Program (Award No. 2017-67021-26138). On behalf of all of the authors, the corresponding author states that there is no conflict of interest.
REFERENCES CITED
Ahmad, M. A., and Alrozi, R. (2011). “Removal of malachite green dye from aqueous solution using rambutan peel-based activated carbon: Equilibrium, kinetic and thermodynamic studies,” Chem. Eng. J. 171(2), 510-516. DOI: 10.1016/j.cej.2011.04.018
Ahmad, M. A, Herawan, S. G., and Yusof, A. A. (2014). “Equilibrium, kinetics and thermodynamics of Remazol brilliant blue R dye adsorption onto activated carbon prepared form pinang frond,” International Scholarly Research Notices 2014, 1-7. DOI: 10.1155/2014/184265
Ben-Mansour, R., Habib, M. A., Bamidele, O. E., Basha, M., Qasem, N. A. A., Peedikakkal, A., Laoui, T., and Ali, M. (2016). “Carbon capture by physical adsorption: Materials, experimental, investigations and numerical modeling and simulations – A review,” Applied Energy 161, 225-255. DOI: 10.1016/j.apenergy.2015.10.011
Fan, Y., Wang, B., Yuan, S., Wu, X., Chen, J., and Wang, L. (2010). “Adsorptive removal of chloramphenicol from wastewater by NaOH modified bamboo charcoal,” Bioresour. Technol. 101(19), 7661-7664. DOI: 10.1016/j.biortech.2010.04.046
Ghaedi, M., and Kokhdan, S. N. (2015). “Removal of methylene blue from aqueous solution by wood millet carbon optimization using response surface methodology,” Spectrochim. Acta A 136(Part B), 141-148. DOI: 10.1016/j.saa.2014.07.048
Hameed, B. H., Din, A. T. M., and Ahmad, A. L. (2007). “Adsorption of methylene blue onto bamboo-based activated carbon: Kinetics and equilibrium studies,” J. Hazard. Mater. 141(3), 819-825. DOI: 10.1016/j.jhazmat.2006.07.049
Hameed, B. H., and El-Khaiary, M. I. (2008). “Equilibrium, kinetics and mechanism of malachite green adsorption on activated carbon prepared from bamboo by K2CO3 activation and subsequent gasification with CO2,” J. Hazard. Mater. 157(2-3), 344-351. DOI: 10.1016/j.jhazmat.2007.12.105
Horikawa, T., Kitakaze, Y., Sekida, T., Hayashi, J., and Katoh, M. (2010). “Characteristics and humidity control capacity of activated carbon from bamboo,” Bioresour. Technol. 101(11), 3964-3969. DOI: 10.1016/j.biortech.2010.01.032
Ip, A. W. M., Barford, J. P., and McKay, G. (2008). “Production and comparison of high surface area bamboo derived active carbons,” Bioresour. Technol. 99(18), 8909-8916. DOI: 10.1016/j.biortech.2008.04.076
Kannan, N., and Sundaram, M. M. (2001). “Kinetics and mechanism of removal of methylene blue by adsorption on various carbons – A comparative study,” Dyes Pigments 51(1), 25-40. DOI: 10.1016/S0143-7208(01)00056-0
Langergren, S., and Svenska, B. K. (1898). “Zur Theorie der sogenannten Adsorption geloester Stoffe [On the theory of so-called adsorption of dissolved substances],” Veternskapsakad Handlingar 24(4), 1-39.
Maneerung, T., Liew, J., Dai, Y., Kawi, S., Chong, C., and Wang, C.-H. (2016). “Activated carbon derived from carbon residue from biomass gasification and its application for dye adsorption: Kinetics, isotherms and thermodynamic studies,” Bioresour. Technol. 200, 350-359. DOI: 10.1016/j.biortech.2015.10.047
Ma, X., Zhang, F., and Wei, L. (2015). “Effect of wood charcoal contents on the adsorption property, structure, and morphology of mesoporous activated carbon fibers derived from wood liquefaction process,” J. Mater. Sci. 50(4), 1908-1914. DOI: 10.1007/s10853-014-8754-6
Mui, E. L., Cheung, W. H., Valix, M., and Mckay, G. (2010). “Activated carbons from bamboo scaffolding using acid activation,” Sep. Purif. Technol. (74), 213-218. DOI: 10.1016/j.seppur.2010.06.007
Özcan, A., Ömeroğlu, Ç., Erdoğan, Y., and Özcan, A. S. (2007). “Modification of bentonite with a cationic surfactant: An adsorption study of textile dye reactive blue 19,” J. Hazard. Mater. 140(1-2), 173-179. DOI: 10.1016/j.jhazmat.2006.06.138
Rudzinski, W., and Plazinski, W. (2009). “On the applicability of the pseudo-second order equation to represent the kinetics of adsorption at solid/solution interfaces: A theoretical analysis based on the statistical rate theory,” Adsorption 15(2), 181-192. DOI: 10.1007/s10450-009-9167-8
Shi, S. Q., and Xia, C. (2017). “Porositization process of carbon or carbonaceous materials,” U. S. Patent No. 9533281.
Tian, Y., Liu, P., Wang, X., Zhong, G., and Chen, G. (2011). “Offgas analysis and pyrolysis mechanism of activated carbon from bamboo sawdust by chemical activation with KOH,” J. Wuhan Univ. Technol. 26(1), 10-14. DOI: 10.1007/s11595-011-0157-9
Wang, L., Zhang, J., Zhao, R., Li, C., Li, Y., and Zhang, C. (2010). “Adsorption of basic dyes on activated carbon prepared from Polygonum orientale Linn: Equilibrium, kinetic and thermodynamic studies,” Desalination 254(1-3), 68-74. DOI: 10.1016/j.desal.2009.12.012
Wang, S.-Y., Tsai, M.-H., Lo, S.-F., and Tsai, M.-J. (2008). “Effects of manufacturing conditions on the adsorption capacity of heavy metal ions by Makino bamboo charcoal,” Bioresour. Technol. 99(15), 7027-7033. DOI: 10.1016/j.biortech.2008.01.014
Weber Jr., W. J. (1972). Physico-chemical Processes for Water Quality Control, Wiley Inter Science, New York City, NY.
Weber, T. W., and Chakravorti, R. K. (1974). “Pore and solid diffusion models for fixed-bed adsorbers,” AlChE J. 20(2), 228-238. DOI: 10.1002/aic.690200204
Xia, C., Kang, C., Patel, M. D., Cai, L., Gwalani, B., Banerjee, R., Shi, S. Q., and Choi, W. (2016a). “Pine wood extracted activated carbon through self-activation process for high-performance lithium-ion battery,” Chem. Select 1(13), 4000-4007. DOI: 10.1002/slct.201600926
Xia, C., and Shi, S. Q. (2016a). “Self-activation for activated carbon from biomass: Theory and parameters,” Green Chem. 18(7), 2063-2071. DOI: 10.1039/C5GC02152A
Xia, C., and Shi, S. Q. (2016b). “Self-activation process to fabricate activated carbon from kenaf,” Wood Fiber Sci. 48, 62-69.
Xia, C., Zhang, S., Ren, H., Shi, S. Q., Zhang, H., Cai, L., and Li, J. (2016b). “Scalable fabrication of natural-fiber reinforced composites with electromagnetic interference shielding properties by incorporating powdered activated carbon,” Materials 9(1). DOI: 10.3390/ma9010010
Xiao, G., Ni, M.-j., Huang, H., Chi, Y., Rui, X., Zhong, Z.-p., and Cen, K.-f. (2007). “Fluidized-bed pyrolysis of waste bamboo,” J. Zhejiang Univ.-Sci. A 8(9), 1495-1499. DOI: 10.1631/jzus.2007.A1495
Article submitted: June 13, 2018; Peer review completed: August 10, 2018; Revised version received: November 15, 2018; Published: December 3, 2018.
DOI: 10.15376/biores.14.1.688-699