
Abstract
Microwave-assisted pyrolysis was applied using four magnetrons to implement a high intensity at a power density of 0.3 107 W/m3 with 800 g specimen size. The 23 full factorial experimental design manipulated the factors temperature, mixture ratio, and pyrolysis time, seeking to maximize %yield at minimum cost of crude bio-oil. The optimum according to model fit had a temperature of 611 °C with a 70:30 sample mixture ratio of oil palm shell (OPS) to activated carbon (AC), and time 39.6 min for a yield of 15.3% and 8.48 Thai-Baht/cc cost. The coefficients of determination were R2 = 93.99% and 94.00% for the respective models. In the aqueous phase of crude bio-oil, acetic acid was the dominant chemical component at 55.2%, whereas phenol was dominant in the bio-oil phase at 44.2%, from 400 °C pyrolysis temperature. The assessed properties of bio-char were proximate composition, heating value, specific surface, and pore volume, and these were improved compared to the raw OPS. However, these properties must be improved further to match commercial-grade activated carbon.
Download PDF
Full Article
Properties of Bio-oil and Bio-char from High-intensity Microwave-assisted Pyrolysis of Oil Palm Shell Waste
Kanokporn Jansuwan,a Saysunee Jumrat,b,c Teerasak Punvichai,b,d Seppo Karrila,c Tule Sirikitputtisak,c Nitipong Songthongkaew,e and Yutthapong Pianroj b,c,*
Microwave-assisted pyrolysis was applied using four magnetrons to implement a high intensity at a power density of 0.3107 W/m3 with 800 g specimen size. The 23 full factorial experimental design manipulated the factors temperature, mixture ratio, and pyrolysis time, seeking to maximize %yield at minimum cost of crude bio-oil. The optimum according to model fit had a temperature of 611 °C with a 70:30 sample mixture ratio of oil palm shell (OPS) to activated carbon (AC), and time 39.6 min for a yield of 15.3% and 8.48 Thai-Baht/cc cost. The coefficients of determination were R2 = 93.99% and 94.00% for the respective models. In the aqueous phase of crude bio-oil, acetic acid was the dominant chemical component at 55.2%, whereas phenol was dominant in the bio-oil phase at 44.2%, from 400 °C pyrolysis temperature. The assessed properties of bio-char were proximate composition, heating value, specific surface, and pore volume, and these were improved compared to the raw OPS. However, these properties must be improved further to match commercial-grade activated carbon.
DOI: 10.15376/biores.18.1.1420-1435
Keywords: Microwave-assisted pyrolysis (MAP); Oil palm shell (OPS); Crude bio-oil; Bio-char
Contact information: a: Major in Energy Technology, Department of Mechanical Engineering, Faculty of Engineering, Prince of Songkla University Hat-Yai Campus, Songkhla, 90110, Thailand; b: Integrated High-Value Oleochemical Research Center, Prince of Songkla University Surat-Thani Campus, 84000, Thailand; c: Faculty of Science and Industrial Technology, Prince of Songkla University Surat-Thani Campus, 84000, Thailand; d: Faculty of Innovation Agriculture and Fisheries Establishment Project, Prince of Songkla University Surat-Thani Campus, 84000, Thailand; e: Scientific Laboratory and Equipment Center, Prince of Songkla University Surat-Thani Campus, 84000, Thailand;
* Corresponding author: yutthapong.p@psu.ac.th
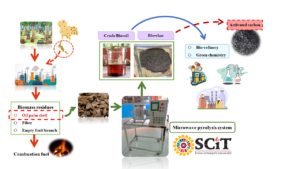
GRAPHICAL ABSTRACT
INTRODUCTION
Zero waste Thailand (ZWT) is a project under the Thai government’s policies for a Bio-Circular-Green (BCG) economy. This project is motivated by several sustainable development goals (SDGs) adopted by the United Nations (UN) to end poverty, protect the planet, and for all people to enjoy peace and prosperity by 2030 (United Nations 2022). Particularly, Goal 12 on Responsible Consumption and Production has an important target pursued by encouraging industries, businesses, and consumers to recycle, reduce, and convert waste from every activity in every sector to value-added forms. Therefore, this project supports all activities that are aligned with the SDGs. Thailand is an agricultural country producing various industrial crops depending on the region. Oil palm is an abundant economic plant in southern peninsular Thailand, and agroindustries using the oil palm as raw material are well established in this region, such as crude palm oil (CPO) mills and palm oil refineries. The CPO industry in year 2017 produced large amounts of various biomass residues such as oil palm shell (OPS; 83,870 ton/year), empty fruit bunches (298,036 tons/year), and fiber of empty fruit bunches (196,195 tons/year) (The Department of Alternative Energy Development and Efficiency 2022). Normally these residues are used as boiler fuels to provide heat and steam to the CPO industrial processes. Therefore, a thermal degradation treatment without oxygen, namely pyrolysis, was chosen for converting biomass residues to value-added forms, supporting the ZWT project, BCG, and finally the SDGs.
Pyrolysis is a thermochemical process that breaks chemical bonds in biomass by endothermic reactions in the absence of oxygen (Janković et al. 2020; Barr et al. 2021; Li et al. 2022). The released volatile gases and vapors will then be condensed to crude bio-oil, as an initial product containing heavy-molecular-weight compounds, to produce fuels and other high-value products such as phenols. These are environmentally friendly and have the potential to replace the phenolic compounds sourced from the petroleum industry, for use as part of phenolic resins, instead of adhesives, disinfectants, and developers (Zhao et al. 2021). Incondensable gas (syn-gas) has light-molecular-weight fuel compounds passing through the condenser such as hydrogen, carbon dioxide, carbon monoxide, methane, ethane, and ethylene (Kostas et al. 2020). The solid residue (bio-char) can be used to produce activated carbon (Li et al. 2016; Parvez et al. 2019b). However, alternative heating techniques might help improve the yield and properties of pyrolysis products, and one of these techniques is microwave-assisted pyrolysis (MAP), which is a most attractive technology with reviews and scientific articles intensely published from 2006 to 2022 (Yin 2012; Beneroso et al. 2017). Because of the dielectric heating mechanism, MAP technology can rapidly convert electromagnetic energy into volumetric heating, with good uniformity and miniaturization capability (Parvez et al. 2019a; Foong et al. 2020; Suriapparao and Vinu 2021). However, the dielectric constant of biomass such as OPS is a poor match for MAP (Salema et al. 2013; Tripathi et al. 2015a,b; Salema et al. 2017). Hence, microwave (MW) absorbers based on carbonaceous materials including char, activated carbon (AC), graphite, coke, and silica carbide (SiC) are added to enable effective microwave pyrolysis of biomass (Chen et al. 2008; Jun et al. 2010; Menéndez et al. 2010; Moen et al. 2010; Salema and Ani 2011). Among these, AC is a very good MW absorber and it is blended with the biomass feedstock to facilitate MW heating, but for biomass particles, it’s still a kind of surface heating, rather than volumetric heating. The polar liquids ethylene glycol and ethanol can be superheated and they are also very good MW absorbers (Yin 2012). Pianroj et al. (2016) demonstrated high-intensity MAP with two magnetrons. Chuayjumnong et al. (2020) modified a household MW oven to study MAP with OPS and AC. They found that a large specific surface area of the AC can increase both yield and quantity of bio-oil. Idris et al. (2021) studied microwave-induced fast pyrolysis of oil palm empty fruit bunches (EFB) with added AC. They found that AC as a MW absorber significantly increased the bio-oil yield to 38.3 wt% at 500 °C and phenol compounds to 43.0%. Li et al. (2022) presented MW pyrolysis coupled with conventional pre-pyrolysis (MCCP) to dispose of stalks, with conversion products syngas and bio-char. The bio-char from MCCP had higher carbon content than that from MAP, with Brunauer-Emmett-Teller (BET) surface area of 142 m2/g.
In this present research, a high-intensity MAP system was developed with four magnetrons to achieve a power density greater than 107 W/m3, considered as specification requirement for microwave pyrolysis (Beneroso et al. 2017). First, finite element method (FEM) software helped design the waveguide and to simulate electric field distribution inside the MW cavity. Second, the MW power was tested using water to calibrate the system. Experiments in a 23 full factorial design were run with sample mixtures of OPS and AC to maximize bio-oil yield and minimize production costs. Then, the properties of crude bio-oil, which separates into two phases (aqueous and oil), were studied for chemical characteristics, and solid residue (bio-char) from the MAP reactor was subjected to BET to compare its surface properties with commercial-grade AC and with previous studies.
EXPERIMENTAL
Materials
The OPS in this study was obtained from an oil palm mill, namely Taksin Palm (2521), Co., Ltd., located in Phun-Phin, Suratthani, Thailand. The OPS was ground and sieved through mesh to 1.18 to 2.00 mm size, and then it was oven-dried at 105 °C to reduce the moisture content to 8.51.0 wt%. Finally, it was packed into Ziplock plastic bags to isolate it from atmospheric moisture, and samples were sent to the Office of Scientific Instruments and Testing, Prince of Songkla University, Hat-Yai Campus, for proximate (Thermogravimetric Analyzer 701, Macro TGA, LECO, St. Joseph, MI, USA) and ultimate (Macro CHNS-O, CHNS628, LECO, St. Joseph, MI, USA) composition analyses of the OPS. The results are shown in Tables 1 and 2. As mentioned above, most biomasses including OPS have poor dielectric properties for MW absorption, so in this study commercial AC based on coconut shells was used as the microwave absorber. It was ground and sieved through 0.85-mm mesh size and kept in Ziplock plastic bags.
Table 1. Proximate Analysis of Oil Palm Shell

Table 2. Ultimate Analysis of Oil Palm Shell

Experimental Set-up
The microwave (MW) cavity with 4 magnetrons was developed based on the FEM calculations using COMSOL MultiphysicsTM software package (Software COMSOL, Inc., v.5.2, Burlington, MA, USA). The complete element mesh had 23,506 domain elements, 2,812 boundary elements, and 328 edge elements, as shown in Fig. 1(a). Volume integration of the electric field was used to normalize the energy (emw.normE) at frequency 2.45 GHz at a value of 302.05 Vm2. For radio-frequency electromagnetic waves, the frequency domain interface is described by Maxwell’s equations, as shown as Eq. 1. This physical model was used to solve for time-harmonic electromagnetic field distribution inside the cavity, as can be seen in Fig. 1(b). The dispersion of permittivity is given by Eq. 1,
 (1)
(1)


Fig. 1. (a) The finite element mesh; (b) The normalized electric field distribution inside the microwave cavity
The high-intensity batch cavity for MW pyrolysis with 4 MW sources (magnetrons, 1,000 W from each magnetron) was developed, as shown in Fig. 2. It was made of stainless steel, to dimensions ![]() . The control panel box in the system had a watt-hour meter for monitoring the electrical energy consumption and the temperature controller SHIMAXTM to control the target temperature in each run. Output was communicated via an RS485 to the USB port of a PC.
. The control panel box in the system had a watt-hour meter for monitoring the electrical energy consumption and the temperature controller SHIMAXTM to control the target temperature in each run. Output was communicated via an RS485 to the USB port of a PC.

Fig. 2. Drawing of the high-intensity batch cavity for MW pyrolysis with 4 MW sources: (a) 3D view, and (b) top view
System Calibration
The system was calibrated for conversion efficiency of electrical power to MW power by a differential temperature measurement, as shown in Eq. 2. Water was used as the calibration target material because it has good dielectric MW absorption due to high relative permittivity. For calibration it was assumed that the water absorbed 100% of the MW irradiation (Jumrat et al. 2021). The power was calculated using Eq. 2,
 (2)
(2)
where ρ is the water density (kg/m3), c is specific heat capacity of water (kJ/kg. °C), V is the water volume (m3), ∆T is the differential temperature (°C) of water after absorbing MW power for seconds, and t is time (s). The quartz reactor was filled with 500 mL of water. It was put inside the MW cavity as shown in Fig. 3 for power calibration runs. The first calibration was for magnetrons mag1 and mag2. The second was for mag3 and mag4. Finally, all the magnetrons were calibrated. The naming of magnetrons is shown in Fig. 2(b).

Fig. 3. Schematic diagram MW power calibration set-up (1. Water, 2. Reactor (quartz), 3. Magnetrons, 4. MW cavity, 5. Thermocouple, 6. Temperature controller)
Design of Experiments
The experimental design had three manipulated factors: pyrolysis temperature (°C) [T], mixture ratio [R] of OPS to AC, and pyrolysis time (min) [t], with two levels for each and two replicates, in a 23 full factorial design as in Table 3. The testing conditions came from Yin (2012), who provides a good review of microwave-assisted pyrolysis. Therefore, 16 runs were executed in randomized order, and all the results are shown in Tables 4 and 5. The statistical confidence level was set at 95%.
Table 3. Factor Levels Used in Full Factorial Design

The total weight of the mixture sample in every run was fixed at 800 g. Before microwave exposure, oxygen was purged by supplying 99.8% pure commercial grade nitrogen (N2) to the quartz reactor at an 8 LPM flowrate for around 10 min. Nitrogen flushing was continued at the same flowrate to preserve an inert atmosphere, and to prevent any possible explosion hazard. A schematic of the experimental setup is given in Fig. 4. The N2 gas was supplied by a glass tube on the top of the cavity into the quartz reactor. The microwaves were generated by 4 magnetrons to heat the reactor to its target temperature, which was controlled by the temperature controller in each run. The volatile materials were evaporated from the sample and the N2 flushed them through the gas outlet port. All gases were condensed by the condensing units (the balloon glassware and the spiral borosilicate glass tube), which were water cooled at around 6 to 8 °C temperature. At the exit of the spiral glass tube, the crude bio-oil was collected as liquid condensate.

Fig. 4. Schematic of the experimental setup. 1. Mixture sample OPS:AC, 2. Quartz reactor, 3. Magnetrons, 4. MW cavity, 5. Thermocouple, 6. Temperature controller, 7. Condensing units
At the end of each run, the total crude bio-oil and the solid bio-char were weighed using a digital balance to record the yields of these products. It should be noted that the pyrolysis product yields were calculated from Eqs. 3 to 5 by assuming no losses in the gas phase (Omoriyekomwan et al. 2016),
 (3)
(3)
 (4)
(4)
 (5)
(5)
where ![]() is the mass of crude bio-oil (g),
is the mass of crude bio-oil (g), ![]() is the mass of bio-char (g), and M0 is the initial mass of raw sample (g). To estimate the cost of crude bio-oil in Thai-Baht (exchange rate 33.42 Thai-Baht to 1 USD on 9th December 2021), the costs of raw materials and electrical energy were divided by the volume of produced crude bio-oil
is the mass of bio-char (g), and M0 is the initial mass of raw sample (g). To estimate the cost of crude bio-oil in Thai-Baht (exchange rate 33.42 Thai-Baht to 1 USD on 9th December 2021), the costs of raw materials and electrical energy were divided by the volume of produced crude bio-oil ![]() as shown here:
as shown here:
 (6)
(6)
Finally, the maximum yield and the minimum cost of crude bio-oil were targeted as the optimal operating point of this process. Therefore, the main products from the collected yield were crude bio-oil and bio-char, which were characterized as follows. The crude bio-oil was analyzed using a Gas chromatograph-mass spectrometer (GC-MS, Agilent, Santa Clara, CA, USA). The bio-char was analyzed for its heating value using a Bomb Calorimeter (IKA, C5000, Staufen, Germany; Macro TGA701, LECO, St. Joseph, MI, USA; Macro CHNS628, LECO, USA). Its specific surface area and porosity were determined with static volumetric N2 adsorption technique by the BET method (ASAP2460, Micromeritics, Norcross, GA, USA), and its surface morphology was assessed using a scanning electron microscope (SEM; Quanta400-FEI Company, Hillsboro, OR, USA).
RESULTS AND DISCUSSION
System Calibration Results
The results of the system calibration using 500 mL of water gave for the pairs of magnetrons 803.1 W for Mag1-2 and 989.3 W for Mag3-4 as MW power.

Fig. 5. The time profiles of temperature from system calibrations using 500 mL of water
However, the calibration of all four magnetrons Mag1234 achieved a MW power of 1,454.9 W, which means that the power density of the system was 0.3 x 10⁷ W/m3. It appears that the achieved power density was about 30% of the required level (>107 W/m3) established by Beneroso et al. (2017). This is supported in Fig. 5 by the time profile of temperature having steep slopes for Mag1234, Mag3-4, and Mag1-2. The temperature controller of the system worked well. It can control the temperature to ± 2 °C around the temperature setpoint at 80 °C.
Experimental Results and Temperature Profiles
The run results following DoE with 23 full factorial design and two replicates are shown in Table 4. The response variables shown are crude bio-oil yield (%) and the cost of crude bio-oil in Thai-Baht.
Table 4. Randomized Experimental 23 Full Factorial Design with Observed Responses

The statistical software package MinitabTM (Minitab, Inc., 16, State College, PA, USA) was used to analyze the experimental results. Analysis of variance (ANOVA) of both responses, yield, and cost (in Thai-Baht) of crude bio-oil, is shown in Table 3. The regression models fit to the experiments are given in Eqs. 7 and 8 for yield and cost of crude bio-oil, respectively. The statistical confidence level was set at 95%, so that p < 0.05 was required for significance of a factor. Therefore, two of the main factors (temperature (T) and ratio (R)) were significant regressors for yield and cost of crude bio-oil. These effects can be seen in Fig. 6. It depicts a steeper average temperature gradient when the set temperature and the mixture ratio (OPS:AC) are increased. A similar result was found in a previous study (Jung et al. 2016), and the p-values of lack-of-fit for the two equations were 0.715 and 0.717, which exceed α-level 0.05, indicating the models as statistically significant. It could be concluded that these two models represent all the authors’ experimental results, and the coefficient of determination (R2) and the adjusted coefficient of determination (R2-adj) were 93.99% and 89.98%, and 94.00% and 90.00%, respectively, for the two response models. The response optimization predicted the maximum %yield and the minimum cost of crude bio-oil at temperature 611 °C sample mixture ratio (OPS:AC) 70:30, and time 39.60 min for yield 15.28% and 8.48 Thai-Baht/cc.

Fig. 6. The time profiles of MW pyrolysis temperature with different mixture ratios (OPS:AC) and different total pyrolysis times
Table 5. Analysis of Variance for Microwave Pyrolysis Using Four Magnetrons.

 (7)
(7)
 (8)
(8)
Therefore, these conditions (T 610.8 °C, OPS:AC 70:30, and t 39.60 min) were tested (five tests) for model adequacy check, and it was found that the averages and standard deviations of crude bio-oil, bio-char, and syn-gas were 22.2% ± 1.0% (24.0, 21.6, 22.2, 21.8, and 22.0), 53.3%±2.1% (50.8, 56.2, 53.6 51.4, and 52.2), and 24.5%±1.8% (25.2, 22.2, 24.2, 26.8, and 25.8), respectively.
Product Quality of Crude Bio-oil (Aqueous Phase and Bio-oil Phase)
After volatile matter from the mixture sample had been vaporized by microwave heating at each pyrolysis temperature, the condensation system collected them into the liquid phase product named crude bio-oil. At room temperature, the crude bio-oil was separated into two phases as shown in Fig. 7. The top layer was the aqueous phase, which had a light brown color and a low viscosity, and the bottom layer was the bio-oil phase with density range 1.15 to 1.20 g/m3, and pH 2.5 to 3.5 (Feng and Meier 2017).

Fig. 7. The two phases of crude bio-oil. The top phase is aqueous and the bottom phase is bio-oil.
Moreover, it can have a dark brown to black color and a highly variable kinematic viscosity of 25 to 1,000 m2/s (Beneroso et al. 2017). Samples of both phases from the crude bio-oil at the fixed mixture ratio OPS:AC at 80:20, but run at the temperatures 400 °C and 700 °C were sent to chemical analysis using a GC-MS. The chemical components found are shown in Fig. 8. Acetic acid was the dominant component in the aqueous phase, at 55.2% and 32.6% at 400 and 700 °C respectively. In contrast, phenol was the dominant component in the bio-oil phase at 44.2% and 40.9% for 400 °C and 700 °C runs, respectively. Increasing the pyrolysis temperature reduces amounts of phenol and phenolic compounds (Idris et al. 2021), but increases the other chemical components because large chemical molecules tend to be broken down into many smaller molecules, as also found in the previous study by Chuayjumnong et al. (2020).

Fig. 8. Chemical compositions of the crude bio-oil as analyzed using GC-MS
Product Quality of Solid (Bio-char)
After MW pyrolysis the solid phase of the mixture sample, which remained in the quartz reactor, was separated to AC and residual OPS by particle size. The feasibility of bio-char from MW pyrolysis for use as AC was assessed for only one run condition: temperature 700 °C, mixture ratio 80:20 (OPS:AC), and pyrolysis time 40 min. The proximate analysis and the heating value were determined using Macro TGA701, Macro CHNS628, LECO, USA and a Bomb calorimeter, C5000 IKA, Germany, respectively. All results are shown in Table 6.
Table 6. Proximate Analysis and Heating Value of Bio-char

Moreover, the specific surface area and porosity were obtained based on static volumetric N2 gas adsorption with degas temperature set at 80 °C from BET analysis. The BET results were compared between OPS, bio-char, and AC, shown in Table 7. It should be noted that the AC sample in this table was commercial grade drinking water active carbon, based on coconut shell as raw material.
Table 7. The BET Results for OPS, Bio-char, and Commercial AC
 Finally, scanning electron microscopy (SEM) was used to study the surface morphology of OPS and bio-char at magnifications of 200x and 1,000x. Images are shown in Fig. 9.

Fig. 9. SEM morphology of OPS at magnifications 200x and 1,000x on (a) and (b), respectively, and bio-char at magnifications 200x and 1,000x on (c) and (d), respectively
In Tables 6 and 7 and Fig. 9, the heating values and the physical surface properties from BET analysis for the bio-char were higher than those for the raw OPS, because the thermochemical treatment by MW pyrolysis supports fast conversion with techno-economic feasibility (Gude 2021). However, the BET properties of bio-char were lower than those of commercial AC. Li et al. (2016) reviewed many previous studies on bio-char from MW pyrolysis of biomass, and they concluded that bio-chars from MW pyrolysis have good pore characteristics and more pores because of the uniform release of volatile matters across the whole particle (Miura et al. 2004).
The char formation during pyrolysis plays an important role during MW irradiation, and it depends on type, size, and density of biomass feedstock. For example, oil palm fiber could produce char much faster due to its low density and small size. Conversely, formation of char in OPS might be slower due to large particle size and hard surface. Moreover, the quick formation of char can enhance absorption of MW energy by newly formed char, thus inducing higher temperature and faster rates of reactions (Robinson et al. 2007; Huang et al. 2008; Salema and Ani 2011). Therefore, to improve the properties of bio-char, the bio-char properties must be emphasized in further study. Li et al. (2022) presented a novel approach to MW pyrolysis coupled with conventional pre-pyrolysis (MCCP) to dispose of stalks by conversion to syngas and bio-char.
CONCLUSIONS
A high-intensity laboratory system for batch MW pyrolysis using 4 magnetrons was developed, with design based on FEM calculations. It was found that the electrical field normalized inside the cavity at frequency 2.45 GHz reached 302.05 Vm2. The system with 4 magnetrons was calibration tested by using water as a load, and its heating power was 1,454.9 W with a power density 0.3 x 10⁷ W/m3.
- A 23 full factorial design with two replicates was performed to support model-based maximization of crude bio-oil yield (%) and minimization of operating costs (Thai baht).
- The near optimal operating point found had MW pyrolysis temperature (T) 611 °C mixture ratio (R, OPS:AC) 70:30, and pyrolysis time (t) 39.6 min for yield 15.3% and operating cost 8.48 Baht/cc.
- In this study, acetic acid was the dominant component in the aqueous phase at 55.2% and 32.6% for runs at 400 °C and 700 °C, respectively. In contrast, phenol was the dominant component in the bio-oil phase at 44.2% and 40.9% for runs at 400 °C and 700 °C, respectively, when analyzed by GC-MS analysis.
- It was found that increasing pyrolysis temperature increased other chemical components by breaking larger molecules into many smaller-sized molecules.
- Regarding the solid residue (bio-char), the heating values and BET surface area values were higher than those of the raw OPS, as benefits from MW pyrolysis as a thermochemical treatment, but these values of the bio-char were lower than those of commercial-grade AC. Further improvements in these properties of biochar need to be pursued in future experiments.
ACKNOWLEDGMENTS
This project was funded by National Research Council of Thailand (NRCT) under project Zero Waste Thailand, No. 131/2563. We thank the Research and Development Office (RDO), Prince of Songkla University, Hat-Yai Campus, and Prince of Songkla University, Surat-Thani Campus for supporting this project under the Integrated High Value of Oleochemical (IH-VO) Research Center. Mrs. Kanokporn Jansuwan thanks the Interdisciplinary Graduate School of Energy System (IGS-Energy), Prince of Songkla University for supporting scholarships.
Author Contributions
The manuscript was written through the contributions of all authors. All Authors have given their approval to the final version of the manuscript.
Conflicts of Interest
The authors declare that there is no conflict of interest regarding the publication of this paper.
REFERENCES CITED
ASTM D7582 (2015). “Standard test methods for proximate analysis of coal and coke by macro thermogravimetric analysis,” American National Standards Institute (ANSI), Washington, DC, USA.
BS EN14918 (2009). “Solid biofuels. Determination of calorific value,” British Standard Institution (BSI), London, UK.
Barr, M. R., Volpe, R., and Kandiyoti, R. (2021). “Identifying synergistic effects between biomass components during pyrolysis and pointers concerning experiment design,” ACS Sustain. Chem. Eng. 9(16), 5603-5612. DOI: 10.1021/acssuschemeng.1c00051
Beneroso, D., Monti, T., Kostas, E. T., and Robinson, J. (2017). “Microwave pyrolysis of biomass for bio-oil production: Scalable processing concepts,” Chem. Eng. J. 316, 481-498. DOI: 10.1016/j.cej.2017.01.130
Chen, M.-q., Wang, J., Zhang, M.-x., Chen, M.-g., Zhy, X-f., Min, F.-f., and Tan, Z.-c. (2008). “Catalytic effects of eight inorganic additives on pyrolysis of pine wood sawdust by microwave heating,” J. Anal. Appl. Pyrolysis 82(1), 145-150. DOI: 10.1016/j.jaap.2008.03.001
Chuayjumnong, S., Karrila, S., Jumrat, S., and Pianroj, Y. (2020). “Activated carbon and palm oil fuel ash as microwave absorbers for microwave-assisted pyrolysis of oil palm shell waste,” RSC Adv. 10(53), 32058-32068. DOI: 10.1039/D0RA04966B
DEDE (2020). “The Department of Alternative Energy Development and Efficiency (DEDE), Ministry of Energy, Thailand, alternative energy development plan 2018-2037 (AEDP2018),” DEDE, (www.dede.go.th/download/Plan_62/20201021_TIEB_ AEDP2018.pdf), Accessed 21 Feb 2022.
Feng, Y., and Meier, D. (2017). “Supercritical carbon dioxide extraction of fast pyrolysis oil from softwood,” J. Supercrit. Fluids 128, 6-17. DOI: 10.1016/j.supflu.2017.04.010
Foong, S. Y., Liew, R. K., Yang, Y., Cheng, Y. W., Yek, P. N. Y., Mahari, W. A. W., Lee, X. Y., Han, C. S., Vo, D.-V. N., and Van, L. Q. (2020). “Valorization of biomass waste to engineered activated biochar by microwave pyrolysis: Progress, challenges, and future directions,” Chem. Eng. J. 389, article ID 124401. DOI: 10.1016/j.cej.2020.124401
Gude, V. G. (2021). Microwave-Mediated Biofuel Production, CRC Press, Taylor & Francis Group, Boca Raton, FL, USA.
Huang, Y. F., Kuan, W., Lo, S., and Lin, C. (2008). “Total recovery of resources and energy from rice straw using microwave-induced pyrolysis,” Bioresource Technol. 99(17), 8252-8258. DOI: 10.1016/j.biortech.2008.03.026
Idris, R., Chong, W. W. F., Ali, A., Idris, S., Hasan, M. F., Ani, F. N., and Chong, C.T. (2021). “Phenol-rich bio-oil derivation via microwave-induced fast pyrolysis of oil palm empty fruit bunch with activated carbon,” Environ. Tech. Innov. 21, Article ID 101291. DOI: 10.1016/j.eti.2020.101291
Janković, B., Manić, N., and Stojiljković, D. (2020). “The gaseous products characterization of the pyrolysis process of various agricultural residues using TGA–DSC–MS techniques,” J. Therm. Anal. Calorim. 139(5), 3091-3106. DOI: 10.1007/s10973-019-08733-4
Jumrat, S., Punvichai, T., Karrila, S., Nisoa, M., and Pianroj, Y. (2021). “Experimental and simulation study of drying skipjack tuna with a modified microwave drying system,” J. Aquat. Food Prod. Technol. 30(8), 968-979. DOI: 10.1080/10498850.2021.1961962
Jun, D., Ping, L., Liu, Z.-H., Sun, D.-g., and Tao, C.-y. (2010). “Fast pyrolysis of biomass for bio-oil with ionic liquid and microwave irradiation,” J. Fuel Chem. Technol. 38(5), 554-559. DOI: 10.1016/S1872-5813(10)60044-8
Jung, K. A., Nam, C. W., Woo, S. H., and Park, J. M. (2016). “Response surface method for optimization of phenolic compounds production by lignin pyrolysis,” J. Anal. Appl. Pyrolysis. 120, 409-415. DOI: 10.1016/j.jaap.2016.06.011
Kostas, E. T., Durán-Jiménez, G., Shepherd, B. J., Meredith, W., Stevens, L. A., Williams, O. S. A., Lye, G. J., and Robinson, J. P. (2020). “Microwave pyrolysis of olive pomace for bio-oil and bio-char production,” Chem. Eng. J. 387, article ID 123404. DOI: 10.1016/j.cej.2019.123404
Li, J., Dai, J., Liu, G., Zhang, H., Gao, Z., Fu, J., He, Y., and Huang, Y. (2016). “Biochar from microwave pyrolysis of biomass: A review,” Biomass Bioenerg. 94, 228-244. DOI: 10.1016/j.biombioe.2016.09.010
Li, X., Peng, B., Liu, Q., and Zhang, H. (2022). “Microwave pyrolysis coupled with conventional pre-pyrolysis of the stalk for syngas and biochar,” Bioresource Technol. 348, article ID 126745. DOI:10.1016/j.biortech.2022.126745
Menéndez, J., Arenillas, A., Fidalgo, B., Fernandez, Y., Zubizarreta, L., Calvo, E.G., and Bermudez, J. M. (2010). “Microwave heating processes involving carbon materials,” Fuel Process. Technol. 91(1), 1-8. DOI: 10.1016/j.fuproc.2009.08.021
Miura, M., Kaga, H., Sakurai, A., Kakuchi, T., and Takahashi, K. (2004). “Rapid pyrolysis of wood block by microwave heating,” J. Anal. Appl. Pyrolysis. 71(1), 187-199. DOI: 10.1016/S0165-2370(03)00087-1
Moen, J., Yang, C., Zhang, B., Lei, H., Hennessy, K., Wan, Y., Le, Z., Liu, Y., Chen, P., and Ruan, R. (2010). “Catalytic microwave assisted pyrolysis of aspen,” Int. J. Agric.Biol. 2(4), 70-75. DOI: 10.3965/j.issn.1934-6344.2009.04.070-075
Omoriyekomwan, J. E., Tahmasebi, A., and Yu, J. (2016). “Production of phenol-rich bio-oil during catalytic fixed-bed and microwave pyrolysis of palm kernel shell,” Bioresource Technol. 207, 188-196. DOI: 10.1016/j.biortech.2016.02.002
Parvez, A. M., Wu, T., Afzal, M. T., Mareta, S., He, T., and Zhai, M. (2019a). “Conventional and microwave-assisted pyrolysis of gumwood: A comparison study using thermodynamic evaluation and hydrogen production,” Fuel Process. Technol. 184, 1-11. DOI: 10.1016/j.fuproc.2018.11.007
Parvez, A. M., Wu, T., Hong, Y., Chen, W., Lester, E. H., Mareta, S., and Afzal, M. (2019b). “Gasification reactivity and synergistic effect of conventional and microwave pyrolysis derived algae chars in CO2 atmosphere,” J. Energy Inst. 92(3), 730-740. DOI: 10.1016/j.joei.2018.02.009
Paul, O. U., John, I. H., Ndubuisi, I., Peter, A., and Godspower, O. (2015). “Calorific value of palm oil residues for energy utilisation,” Int. J. Eng. Innov. Res. 4(4), 664-667.
Pianroj, Y., Jumrat, S., Werapun, W., Karrila, S., and Tongurai, C. (2016). “Scaled-up reactor for microwave induced pyrolysis of oil palm shell,” Chem. Eng. Process. 106, 42-49. DOI: 10.1016/j.cep.2016.05.003
Qarizada, D., Mohammadian, D., Alias, A. B., Rahimi, H. A., and Yusuf, S. B. M. (2018). “Effect of temperature on bio-oil fractions of palm kernel shell thermal distillation,” Int. J. Innov. Res. Sci. Stud. 1(2), 27-31. DOI: 10.53894/ijirss.v1i2.7
Robinson, J. P., Kingman, S. W., Snape, C. E., and Shang, H. (2007). “Pyrolysis of biodegradable wastes using microwaves,” Proc. Inst. Civ. Eng.- Waste Resour. Manag. 160(3), 97-103. DOI: 10.1680/warm2007.160.3.97
Salema, A. A., and Ani, F. N. (2011). “Microwave induced pyrolysis of oil palm biomass,” Bioresource Technol. 102(3), 3388-3395. DOI: 10.1016/j.biortech.2010.09.115
Salema, A. A., Yeow, Y. K., Ishaque, K., Ani, F. N., Afzal, M. T., and Hassan, A. (2013). “Dielectric properties and microwave heating of oil palm biomass and biochar,” Ind. Crops Prod. 50, 366-374. DOI: 10.1016/j.indcrop.2013.08.007
Salema, A. A., Ani, F. N., Mouris, J., and Hutcheon, R. (2017). “Microwave dielectric properties of Malaysian palm oil and agricultural industrial biomass and biochar during pyrolysis process,” Fuel Process. Technol. 166, 164-173. DOI: 10.1016/j.fuproc.2017.06.006
Suriapparao, D. V., and Vinu, R. (2021). “Biomass waste conversion into value-added products via microwave-assisted co-pyrolysis platform,” Renew. Energy 170, 400-409. DOI: 10.1016/j.renene.2021.02.010
Tripathi, M., Sahu, J. N., Ganesan, P., and Dey, T. K. (2015a). “Effect of temperature on dielectric properties and penetration depth of oil palm shell (OPS) and OPS char synthesized by microwave pyrolysis of OPS,” Fuel 153, 257-266. DOI: 10.1016/j.fuel.2015.02.118
Tripathi, M., Sahu, J. N., Ganesan, P., Monash, P., and Dey, T. K. (2015b). “Effect of microwave frequency on dielectric properties of oil palm shell (OPS) and OPS char synthesized by microwave pyrolysis of OPS,” J. Anal. Appl. Pyrolysis. 112, 306-312. DOI: 10.1016/j.jaap.2015.01.007
United Nations (UN) (2022). “United Nations, Nations Department of Economic and Social Affairs, Sustainable Development: The 17 goals,” SDGS, (www.sdgs.un.org/goals), Accessed 21 Feb 2022.
Yin, C. (2012). “Microwave-assisted pyrolysis of biomass for liquid biofuels production,” Bioresour. Technol. 120, 273-284. DOI: 10.1016/j.biortech.2012.06.016
Zhao, Z., Jiang, Z., Xu, H., and Yan, K. (2021). “Selective production of phenol-rich bio-oil from corn straw waste by direct microwave pyrolysis without extra catalyst,” Front. Chem. 9, article ID 700887. DOI: 10.3389/fchem.2021.700887
Article submitted: November 11, 2022; Peer review completed: December 21, 2022; Revised version received and accepted: December 30, 2022; Published: January 5, 2023.
DOI: 10.15376/biores.18.1.1420-1435