
Abstract
Digitized growth pattern images of wood-rotting fungi Fomitopsis palustris (FOM) and Trametes versicolor (TRA) were used with a video processing program with a new formula to calculate the numerical results of microbial inhibition by an active substance (wood vinegar). First, images of daily growth pattern were collected to generate calibration curves for each fungus. FOM stopped growing in 7 days, whereas TRA stopped growing in 11 days. The calibration curves FOM and TRA showed R2 = 0.9899 and 0.8880, respectively. The new methods allow numerical comparison by adding different concentrations of active components (wood vinegar) to assess the inhibition effect of microbial growth. Using the formula allowed the results of inhibition effect to be collected as numerical data. Through the image data, it was possible to present daily inhibitory efficacy data in detail, numerically. Based on these results, microbial growth pattern could be evaluated.
Download PDF
Full Article
Quantification of Microbial Growth Pattern on Growth Medium Using Image Processing Program and Evaluation of Antifungal Activities of Wood Vinegar
Byeongho Kim, Kyoung-Chan Park, Hanna Park, and Se-Yeong Park *
Digitized growth pattern images of wood-rotting fungi Fomitopsis palustris (FOM) and Trametes versicolor (TRA) were used with a video processing program with a new formula to calculate the numerical results of microbial inhibition by an active substance (wood vinegar). First, images of daily growth pattern were collected to generate calibration curves for each fungus. FOM stopped growing in 7 days, whereas TRA stopped growing in 11 days. The calibration curves FOM and TRA showed R2 = 0.9899 and 0.8880, respectively. The new methods allow numerical comparison by adding different concentrations of active components (wood vinegar) to assess the inhibition effect of microbial growth. Using the formula allowed the results of inhibition effect to be collected as numerical data. Through the image data, it was possible to present daily inhibitory efficacy data in detail, numerically. Based on these results, microbial growth pattern could be evaluated.
DOI: 10.15376/biores.17.4.6532-6541
Keywords: Wood-rot fungi; Microbial growth quantification; Fomitopsis palustris; Trametes versicolor
Contact information: Department of Forest Biomaterials Engineering, Kangwon National University, Chuncheon 24341, South Korea; *Corresponding author: parksy319@kangwon.ac.kr
GRAPHICAL ABSTRACT
INTRODUCTION
Carbon neutrality policies are being pursued worldwide in response to climate change, and consequently utilization of wood, an eco-friendly and sustainable resource, has been suggested as an alternative source (Lee et al. 2018). As the most abundant natural polymeric material, wood has advantages of high specific strength, intrinsic quality, and is known for its beautiful patterns (Chen et al. 2020). Wood has been widely used in building materials, for furniture, and everyday utensils. However, wood is a biodegradable polymer comprising an assortment of organic matter; it is vulnerable to deterioration by biological factors such as wood-rotting fungi, wood stain fungi, insects, and non-biological factors such as ultraviolet rays, heat, and water (Ruel et al. 1994; Kim 2017).
Wood contains cellulose, hemicellulose, and lignin, and depending on their type, wood-rotting fungi that utilize these components as nutritional sources and can selectively decompose wood components (Blanchette et al. 1985). A small proportion of these are classified under Ascomycota, whereas more than 90% are classified under Basidiomycota; the latter reproduce inside wood and penetrate cell membrane to destroy and decompose wood structure (Jo et al. 2012). Generally, wood-rotting fungi are classified into brown-rot fungi that decompose polysaccharides from amongst the wood components, and white-rot fungi that simultaneously decompose polysaccharides and lignin. Wood that has been damaged by wood-rotting fungi undergoes changes in its physical characteristics, such as loss of weight and strength. Because of this, tests are needed to check for fungal resistance to ensure that products that use wood as a raw material are safe for use (Won et al. 2017).
Various chemical treatments are used to prevent biodegradation of wood; however, wood itself may possess growth inhibitory substances that provide protection against external invasive organisms. Typically, the presence of plant extracts inhibits microbial growth. Active components including secondary metabolites such as fatty acids, terpenoids, and flavonoids, which can be used in preservatives, food products, cosmetics, and pharmaceuticals, are extracted from various plant parts (Xie et al. 2017).
Inhibition of microbial growth by active components derived from plants is assessed using several methods, amongst which the disk diffusion method is the most common (Yang and Clausen 2007). In the case of bacteria, a fluorescent microscope can be used for assessment after genetically expressing the fluorescent substance observed (Vesterlund et al. 2005 ). Experimental procedures conducted in Petri dishes are required to test the efficacy of active components against wood-rotting fungi and for fungal resistance of the wood itself. The fungal resistance tests for wood can be conducted in accordance with Korean Standard (KS) F 2213 regulations, and one of the four grades can be awarded to it, after assessing weight reduction rate over 8 weeks of decomposition. However, this method is disadvantageous as it requires a considerable amount of time. Conducting the fungal resistance test using an active component by inoculating the microorganism in a Petri dish can lower the accuracy of the test, as the researcher has to visually observe the growth of the microorganism through time (Yang 2016). Furthermore, microbial growth may not be uniform, indicating the experimental method needs improvement to obtain accurate numerical results while measuring size and diameter of microbial growth.
This study quantitatively digitized growth pattern images of wood-rotting fungi using video processing programs obtained through hourly recorded area measurements. Fomitopsis palustris, a brown-rot fungus, and Trametes versicolor, a white-rot fungus, were used as experimental strains in accordance with the Korean Standards (KS). The growth images of each fungus were digitized to determine calibration curves. Based on the calibration curves presented for each experimental strain, new methods that allow for numerical comparison by adding different concentrations of active components (wood vinegar) for the assessment of microbial growth inhibition were proposed.
EXPERIMENTAL DESIGN
Materials
Brown-rot fungus (Fomitopsis palustris, FOM), and white-rot fungus (Trametes versicolor, TRA) were provided from the National Institute of Forest Science in South Korea. Both fungi were cultivated in potato dextrose agar (PDA) at 26 ± 2 °C.
Wood vinegar as active substances was provided from Hongcheon Charcoal Co., Ltd in South Korea. It was collected at a temperature of 400 to 600 °C during charcoal production process.
Growth Condition of Fungi
Culture medium was prepared by using 39 g of PDA powder into 1 L of distilled water. After sterilizing the PDA medium in an autoclave at 121 °C for 15 min, fungal strains of FOM and TRA (50 each) were inoculated on Petri dishes. These Petri dishes were sealed and placed in the culture chamber at 26 ± 2 °C. Cultivation was terminated after all Petri dishes were covered with mycelia.
Quantification of Image Data
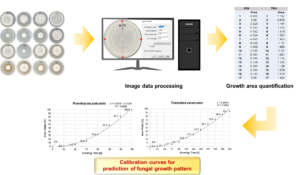
The growth pattern of fungi was photographed daily. These photographs were used to measure the growth area of fungus using ImageJ, an image processing program. Prior to measuring the growth area, measurement units were adjusted using the set scale function of ImageJ. Freehand selection tool in the program was then used to display fungal growth outline according to the fungal morphology. Fungal growth area was quantified daily within displayed lines, and the corresponding data was recorded. Finally, the daily growth area data collected for each strain were represented as a calibration curve (Fig. 1).

Fig. 1. Flow chart of experimental process |
Evaluation of Microbial Growth Inhibition
The inhibition effect of wood vinegar (Hongcheon Charcoal Co., South Korea) was assessed. Before testing, the acquired wood vinegar was passed through a filter paper using an aspirator. After sterilizing wood vinegar and PDA medium in an autoclave at 121 °C for 15 min, these were mixed to adjust the concentration of wood vinegar to 2, 3, 4, 5, and 6%, and 20 mL of t mixture was poured into each Petri dish. Once the medium solidified, pre-cultured mycelial disks of FOM and TRA were placed at the center of each plate to initiate cultivation and five replicates were prepared for each condition. Daily growth patterns were observed in the cultivation medium at 26 ± 2 °C, and image data was obtained using ImageJ as described above.
Experiments were terminated when no microbial growth was observed in the experimental group with the addition of wood vinegar. In the control group (where wood vinegar was not added), the experiments were concluded terminated when mycelium covered the entire Petri dish.
RESULTS AND DISCUSSION
Distribution of Fungal Growth Area
Conventionally, the diameters of growth patterns of wood decay fungi are measured and differences in the growth diameters between the experimental groups are compared visually. In this study, the ImageJ program was used to calculate the area ratio and compare the growth patterns of the two types of wood decay fungi.
Results of daily growth areas of FOM and TRA quantified using the freehand selection tool in the ImageJ are shown in Figs. 2 and 3, respectively. The experiment with approximately 50 iterations showed maximum growth areas of FOM and TRA on days 7 and 11, respectively, in most experimental groups. Similar to the observations in previous studies (Ismayati et al. 2019; Olatinwo et al. 2019), the growth rate of FOM was faster than that of TRA, and growth of FOM was complete on day 7, whereas that of TRA was complete on day 11.
The distribution area of both wood decay fungi increased with increase in the number of growth days. These results show the manner in which previously mentioned problems of observing and comparing microbial growth area through the naked eye could have manifested. However, in this study, the area ratios of the experimental groups were calculated and compared using the ImageJ program. In previous research, growth competition between fungi was studied using ImageJ (Baribault et al. 2012; Chi et al. 2015; Irin 2019). In the present study, only two wood-decay fungi were assessed; however, quantifying the growth area of various other fungi is necessary in the future.
 |
| Fig. 2. Daily FOM growth area ratio (%) |
 |
| Fig. 3. Daily TRA growth area ratio (%) |
Calibration Using Average Growth Area
Figures 4 and 5 show the average growth area rates of FOM and TRA. The calibration curves were generated by taking the average area value for 50 experimental groups of each wood decay fungus. Subsequently, a polynomial equation was used for generating the calibration curve, resulting in relatively high R2 values for FOM (0.9899) and TRA (0.8880).
The acquired calibration curves for average daily growth area ratios of the two different strains can be used to predict the average growth area ratio at a specific time.
 |
| Fig. 4. Average daily growth area ratio of FOM (%) |

Fig. 5. Average daily growth area ratio of TRA (%) |
Evaluation of the Growth Inhibition by Addition of Wood Vinegar
Wood vinegar was used to evaluate microorganism growth inhibition. Wood decay fungi were grown in different concentrations, and the resultant area images were quantified. The growth rates of FOM and TRA based on varying concentrations are shown in Figs. 6 and 7, respectively. Results showed that growth rates of both FOM and TRA were suppressed with increasing concentrations of wood vinegar compared with the growth rates in control samples. At the lowest concentration (1%), no difference in the growth rate was observed between the two strains and their control samples. Thus, this concentration was eliminated from the table.
 |
| Fig. 6. Average growth rate (%) of FOM depending on the wood vinegar concentration |
 |
| Fig. 7. Average growth rate (%) of TRA depending on the wood vinegar concentration |
As mentioned previously, maximum growth areas were observed on days 7 and 11 for FOM and TRA, respectively. In addition, the growth area exceeded 50% on days 4 to 5 (96 to120 h) for FOM and days 7 to 8 (144 to168 h) for TRA.
In a study conducted by Özgenç et al. (2017), wood vinegar showed a higher inhibition ratio than the bark extracts of the four trees. Similarly, in the current study, results of the wood vinegar addition experiment showed that growth area was less than 50% on day six under all concentrations, except 2%, for FOM. Moreover, the growth area ratio was less than 50% for day 9 under all concentrations, except 2%, for TRA. In contrast, FOM and TRA growths were completely suppressed at 6% and 5% concentrations of wood vinegar, respectively. Thus, it was confirmed that the addition of wood vinegar slowed down or inhibited the growth rate of wood decay fungi. This study also thus assisted in quantifying the extent of inhibition.
Results of previous experiments were used to improve the evaluation of wood weathering against bio-degradation. Although the addition of wood vinegar as a microbial growth inhibitor did not show complete inhibition efficacy, the following equation was created to numerically compare the experimental group with the control group.
Inhibitory effect of substance (%)
= (Daily growth rate in the group with added effective substance)
/(Daily growth rate of the control group)×100 (1)
The inhibitory effect of the substance was calculated using the ratio of average daily growth rate of experimental group, which included the active substance, to the average daily growth rate of the specific wood decay fungus. Because the daily growth rate of each wood decay fungus is different, the calculations should be specific to the strain evaluated.
Table 1. FOM Growth Inhibition Ratio (%) by Adding Wood Vinegar

Table 2. TRA Growth Inhibition Ratio (%) by Adding Wood Vinegar

Results of the wood vinegar experiment were substituted in the above equation to calculate inhibitory effect of wood vinegar. The acquired results are shown in Tables 1 and 2. The conditions and primary information for each available fungal strain that showed more than 50% inhibition efficiency and 100% inhibition efficiency, depending on the concentration of wood vinegar added. The standard deviation of ImageJ was lower than the macroscopic method used in other studies (Theapparat et al. 2015; Zhao et al. 2020).
CONCLUSIONS
- The ImageJ program was used to collect and analyze daily data for growth and inhibition area of Fomitopsis palustris (FOM) and Trametes versicolor (TRA). It provided a clearer standard of comparison between the experimental groups in contrast to the conventional method of observing and measuring the growth diameter with naked eye.
- The evaluation results of microbial inhibition after the addition of the active substance (wood vinegar), which could evaluate the substance’s inhibition efficacy, were presented as numerical values to obtain more specific information by introducing a new formula.
ACKNOWLEDGEMENTS
This study was carried out with the support of ‘R&D Program for Forest Science Technology (Project No. 2019151D10-2223-0301)’ provided by Korea Forest Service (Korea Forestry Promotion Institute) and supported by 2021 Research Grant from Kangwon National University.
REFERENCES
Baribault, T. W., Kobe, R. K., and Finley, A. O. (2012). “Tropical tree growth is correlated with soil phosphorus, potassium, and calcium, though not for legumes,” Ecological Monographs 82(2), 189-203. DOI: 10.1890/11-1013.1
Blanchette, R. A., Otjen, L., Effland, M. J. and Eslyn, W. E. (1985). “Changes in structural and chemical components of wood delignified by fungi,” Wood Science and Technology 19, 35-46. DOI: 10.1007/BF00354751
Chen, C., Kuang, Y. D., Zhu, S. Z., Burgert, I., Tobias, K., Gong, A., Li, T., Berglund, L., Eichhorn, S. J., and Hu, L. B. (2020). “Structure–property–function relationships of natural and engineered wood,” Natural Review Materials 5(9), 642-666. DOI: 10.1038/s41578-020-0195-z
Chi, X., Tang, Z., Xie, Z., Guo, Q., Zhang, M., Ge, J., Xiong, G., and Fang, J. (2015). “Effects of size, neighbors, and site condition on tree growth in a subtropical evergreen and deciduous broad-leaved mixed forest, China,” Ecology and Evolution 5(22), 5149-5161. DOI: 10.1002/ece3.1665
Irin, F. (2019). Wood Decaying Fungi Gain Competitive Strength through Competition, Master’s Thesis, Mid Sweden University, Östersund, Sweden.
Ismayati, M., Zulfiana, D., Tarmadi, D., Lestari, A. S., Krishanti, N. P. R. A., Himmi, S. K., Fajar, A., and Yusuf, S. (2019). “Biological control of wood destroying organism using plant extracts collected from Mt. Merapi National Park, Indonesia,” Biosaintifika 11(3), 360-368, DOI: 10.15294/biosaintifika.v11i3.20102.
Jo, C. W., Kim, Y. H., Hong, J. Y., Kim, S. J., Lee, J. M. and Choi, J. E. (2012). “Influence of wood decaying fungi for termite ecology,” Conservation Studies 33, 99-108.
Lee, B. H., Kim, S. B., Lee, C. J., Sung, Y. J., Lee, C. B., So, S. J., and Kim, T. H. (2018). “Analysis on industrial structure and stable supply and demand of wood chip,” Journal of Korea TAPPI 50(3), 53-61. DOI: 10.7584/JKTAPPI.2018.06.50.3.53
Olatinwo, R., So, C. L. and Eberhardt, T. L. (2019). “Effect of Acaromyces ingoldii secondary metabolites on the growth of brown-rot (Gloeophyllum trabeum) and white-rot (Trametes versicolor) fungi,” Mycobiology 47(4), 506-511, DOI: 10.1080/12298093.2019.1686944
Özgenç, Ö., Durmaz, S., Yildiz, Ü. C., and Erişir, E. (2017). “A comparison between some wood bark extracts: Antifungal activity,” Journal of Forestry Faculty 17(3), 502-508, DOI: 10.17475/kastorman.282637
Ruel, K., Ambert, K., and Joseleau, J. P. (1994). “Influence of the enzyme equipment of white-rot fungi on the patterns of wood degradation,” FEMS Microbiology Reviews 13, 241-254, DOI: 10.1111/j.1574-6976.1994.tb00045.x
Theapparat, Y., Chandumpai, A., Leelasuphakul, W., and Laemsak, N. (2015). “Pyroligneous acids from carbonisation of wood and bamboo: Their components and antifungal activity,” Journal of Tropical Forest Science 27(4), 517-526. http://www.jstor.org/stable/43596228
Vesterlund, S., Johanna Paltta, J., Matti Karp, M. and Ouwehand, A. C. (2005). “Measurement of bacterial adhesion in vitro evaluation of different methods,” Journal of Microbiological Methods 60, 225-233. DOI: 10.1016/imimet.2004.09.013
Won, R. K., Jung, S. Y., Hong, N. E., Jang, Y. G., Jo, J. H., and Byeon, H. S. (2017). “Evaluation of decay resistance for sapwood and heartwood of hardwood after immersion-treatment with pyroligneous liquor,” Journal of Agriculture & Life Science 51(3), 29-36. DOI: 10.14397/jals.2017.51.3.29
Xie, Y., Wang, J., Huang, Q., and Zhang, D. (2017). “Antifungal activity of several essential oils and major components against wood-rot fungi,” Industrial Crops & Products 108, 278-285. DOI: 10.1016/j.indcrop.2017.06.041
Yang, J. C. (2016). “A study on the cosmetic preservative effects of Cornus officinalis seed extracts,” Journal of Oil & Applied Science 33(2), 333-341, DOI: 10.12925/jkocs.2016.33.2.333
Yang, V. W., and Clausen, C. A. (2007). “Inhibitory effect of essential oils on decay fungi and mold growth on wood,” American Wood Protection Association. c2007, 62-70.
Yeong-Suk Kim, Y. S. (2017). “Current research on the weathering of wood,” Journal of the Korean Wood Science and Technology 45(5), 483-494. DOI: 10.5658/WOOD.2017.45.5.483
Zhao, D., Cardona, C., Gottel, N., Winton, V. J., Thomas, P. M., Raba, D. A., Kelley, S. T., Henry, C., Gilbert, J. A., and Stephens, B. (2020). “Chemical composition of material extractives influences microbial growth and dynamics on wetted wood materials,” Scientific Reports 10(14500). DOI: 10.1038/s41598-020-71560-3
Article submitted: August 23, 2022; Peer review completed: September 24, 2022; Revised version received and accepted: October 2, 2022; Published: October 5, 2022.
DOI: 10.15376/biores.17.4.6532-6541