
Abstract
A new method is presented for quantitative evaluation of hybrid aspen genotype xylem morphology and immunolabeling micro-distribution. This method can be used as an aid in assessing differences in genotypes from classic tree breeding studies, as well as genetically engineered plants. The method is based on image analysis, multivariate statistical evaluation of light, and immunofluorescence microscopy images of wood xylem cross sections. The selected immunolabeling antibodies targeted five different epitopes present in aspen xylem cell walls. Twelve down-regulated hybrid aspen genotypes were included in the method development. The 12 knock-down genotypes were selected based on pre-screening by pyrolysis-IR of global chemical content. The multivariate statistical evaluations successfully identified comparative trends for modifications in the down-regulated genotypes compared to the unmodified control, even when no definitive conclusions could be drawn from individual studied variables alone. Of the 12 genotypes analyzed, three genotypes showed significant trends for modifications in both morphology and immunolabeling. Six genotypes showed significant trends for modifications in either morphology or immunocoverage. The remaining three genotypes did not show any significant trends for modification.
Download PDF
Full Article
Quantitative Evaluation of Hybrid Aspen Xylem and Immunolabeling Patterns Using Image Analysis and Multivariate Statistics
David Sandquist,a Lennart Norell,b and Geoffrey Daniel c,*
A new method is presented for quantitative evaluation of hybrid aspen genotype xylem morphology and immunolabeling micro-distribution. This method can be used as an aid in assessing differences in genotypes from classic tree breeding studies, as well as genetically engineered plants. The method is based on image analysis, multivariate statistical evaluation of light, and immunofluorescence microscopy images of wood xylem cross sections. The selected immunolabeling antibodies targeted five different epitopes present in aspen xylem cell walls. Twelve down-regulated hybrid aspen genotypes were included in the method development. The 12 knock-down genotypes were selected based on pre-screening by pyrolysis-IR of global chemical content. The multivariate statistical evaluations successfully identified comparative trends for modifications in the down-regulated genotypes compared to the unmodified control, even when no definitive conclusions could be drawn from individual studied variables alone. Of the 12 genotypes analyzed, three genotypes showed significant trends for modifications in both morphology and immunolabeling. Six genotypes showed significant trends for modifications in either morphology or immunocoverage. The remaining three genotypes did not show any significant trends for modification.
Keywords: Wood genotyping; Immunocoverage; Wood chemistry; Immunolabeling; Quantitative microscopy
Contact information: a: University of Hamburg, Leuschnerstr. 91c, 21031 Hamburg, Germany; b: Applied Statistics and Mathematics, Department of Economics, Swedish University of Agricultural Sciences, P.O. Box 7013, SE-750 07 Uppsala, Sweden; c: Wood Science, Department of Forest Products, Swedish University of Agricultural Sciences, P.O. Box 7008, SE-750 07 Uppsala, Sweden;
* Corresponding author: geoffrey.daniel@slu.se
INTRODUCTION
Immunolabeling in combination with fluorescence and electron microscopy is a powerful tool for studying the microdistribution of specific epitopes in biological specimens. It has been used extensively over the last decade to study the development and topochemistry of primary and secondary cell walls in plant and xylem tissues, including in genetically modified trees (e.g. Awano et al. 2000; Willats et al. 2000; Grunwald et al. 2001, 2002a,b; Zhang et al. 2003; Joseleau et al. 2004; Knox et al.2005; McCartney et al. 2005; Hosoo et al. 2006; Ruel et al. 2006; Altaner et al. 2007a, b; Daniel et al.2006; Nishikubo et al. 2007; Bowling and Vaughn 2008; Mast et al. 2009; Sandquist et al. 2010; Kim et al. 2012; Kim and Daniel 2013). It is an outstanding observational aid to highlight the presence and availability of epitopes, within limits of the specificity determined for each antibody. It can thus be used as a complementary tool in studying xylem differences in tree breeding, wood quality, and genetic engineering. One area however, where the technique struggles is in comparisons of highly similar biological specimens. This is often further exacerbated by natural variations of the specimens themselves.
If quantitative evaluation techniques could be easily employed, where microscopic immunolabeling and morphological (anatomical) approaches are correlated, evaluation would become a more easily accessible analytical tool for tree breeders and studies of genetic engineering. Reports of using quantitative immunoassays successfully in combination with other detection techniques, such as microarray profiling (e.g. Alonso-Simón et al. 2010) and Förster resonance energy transfer (FRET) fluorescence correlation microscopy (Förster 1948; Andrews 1989; Bhat 2009) or semi-quantitative approaches, where changes in fluorescence (Donaldson et al. 2010; Donaldson and Knox 2012) and/or numbers of gold particles after labeling with transmission electron microscopy are also available (e.g. Kim et al. 2010). Microarray profiling normally requires the destruction of samples, whereas fluorescence and electron microscopic approaches, while conducted on whole sections, are usually restricted to small areas of analysis.
The aim of the study was to present preliminary results illustrating a method of complementing microscopy-based immunolabeling with image analysis and statistics. Such an approach may help to overcome the aforementioned shortcomings and yield quantitative identification of changes in traits between genotypes of hybrid aspen. To effectively compare the different lines, genotypes, and controls, it was necessary to conduct a multivariate statistical analysis. This allows for a solid overview of genotype effects in combination with detailed information of specific effects.
Table 1. Aspen Genotype Constructs in Study
| Construct | PU No. | POPTR ID | CloneID | Annotation |
| KR016 | PU02990 | POPTR_0008s02650.1 | B005P05.3pR | ATCSLA09; mannan synthase/transferase |
| KR100 | PU00831 | POPTR_0017s05770.1 | A021P10 | pfkB-type carbohydrate kinase family protein |
| KR126 | PU01245 | POPTR_0014s07670.1 | A045P60.3pR | LIM domain-containing protein |
| KR129 | PU01524 | POPTR_0001s10120.1 | A047P55.3pR | disease resistance-responsive family or dirigent family protein |
| KR143 | PU02081 | POPTR_0014s11000.1 | A065P30 | SAM-2 (S-ADENOSYLMETHIONINE SYNTHETASE 2) |
| KR151 | PU02254 | POPTR_0001s43940.1 | A076P11 | quinone reductase family protein |
| KR165 | PU02482 | POPTR_0017s05770.2 | A087P07 | pfkB-type carbohydrate kinase family protein |
| KR175 | PU03034 | POPTR_0001s09090.1 | B004P67.5pR | remorin family protein |
| KR213 | PU00627 | POPTR_0015s09930.1 | A010P74 | pectate lyase family protein |
| KR015 | PU02944 | POPTR_0008s00710.1 | B005P04.3pR | glycosyltransferase family 14 or core-2/I-branching enzyme family protein |
| KR080 | PU00489 | POPTR_0003s07230.1 | A011P29 | UTP-glucose-1-phosphate uridylyltransferase family protein |
| KR183 | PU00145 | POPTR_0008s05450.1 | A001P04 | unknown protein |
| For further information (such as partial cDNA) please refer to the The Populus Genome Integrative Explorer (http://popgenie.org/) using the CloneID above (Sjödin et al. 2009). | ||||
As a basis for developing the methodology, 12 genotypes of hybrid aspen were analyzed. Each of the aspen genotypes was down-regulated in one gene (Table 1). The twelve knock-down genotypes were selected based on pre-screening by pyrolysis-IR of global chemical content (unpublished observations).
Because changes in global chemistry can be caused by both changes in morphology and changes in cell wall composition, the immunolabeling analysis was complemented with morphological characterization. High tissue variability in combination with less regular xylem makes morphological characterization more of a challenge for hardwoods than softwoods. For hardwoods, the types of morphological traits likely to be affected are: fiber length and width, lumen area and cell wall thickness, vessel cell wall thickness, ratio of vessels to fibers, vessel frequency and size, and the local chemical composition of the cell walls.
EXPERIMENTAL
Materials
Genetic transformations
Antisense constructs were generated by cloning partial cDNA, (CloneID, popgenie.org, Sjödin et al.2009) shown in Table 1, into gateway compatible antisense binary vectors, pK7GWIWG2(I) (Karimi et al. 2002). The constructs were then transformed into hybrid aspen (clone T89, Populus tremula x tremuloides) as described previously by Nilsson et al. (1992). Kanamycin-resistant lines were clonally propagated in vitro and planted in the greenhouse. Each transformation was carried out twice, generating two independent lines per genotype, with three replicates per line. There was some mortality spread randomly across the genotypes. Out of a total of 72 possible transgenic plants, 65 survived for analysis. In addition, 8 and 10 non-transformed plants were used as controls for the two groups, respectively. In total 83 plants were analyzed.
Plant material
Hybrid aspen (Populus tremula x tremuloides) were grown in a greenhouse with an 18-h photo-period, a temperature regime of 22/17 °C (day/night), and relative humidity (RH) of at least 70%. Natural daylight was supplemented with light from HQI-TS 400W/DH metal halogen lamps (Osram, Munich, Germany). Trees were watered daily and fertilized once a week with a 1:100 dilution of SUPERBA S (Hydro Supra AB, Landskrona, Sweden). The trees were planted in two groups. The first group was planted in March 2006 and the second in June 2006. Trees were measured for height and diameter monthly and harvested at 3 months of age. Both groups of genotypes were accompanied with non-transformed reference trees.
Methods
Sampling, embedding, and sectioning
From each tree at 20 cm above soil height, a 1 cm high section of stem was collected and directly plunged into liquid nitrogen. In preparation for embedding, samples were thawed, and three radial sectors of 1 mm width were collected and fixed with 3% v/v glutaraldehyde containing 2% v/v paraformaldehyde in sodium cacodylate buffer (0.1 M, pH 7.2) for 4 h at room-temperature. After fixation, samples were washed 2 × 20 min with distilled water and dried with an ethanol series consisting of 20 min steps (20, 40, 60, 70, 80, 90, 95, and 99.5%).
From each sector, one sample was collected of approximately 1 mm height and embedded in Technovit 8100 (Kulzer, Wehrheim, Germany) according to the manufacturers’ instructions, gradually increasing the methacrylate infiltration over one week. From the embedded samples, 2 µm sections were collected on a Microm microtome (HM 350, Microm, Germany).
Wood maceration for morphological characterization
Three sectors of wood, approximately 3 mm by 1 cm for each tree, were delignified and macerated by treatment in a 1:1 mixture of 100% acetic acid and 30% H2O2 at 60 °C for 18 h (Wise et al. 1946) to allow for fiber length and width measurements to be obtained using light microscopy and image analysis (see below).
Chemical staining for morphological characterization
Toluidine blue (1% w/v in borax buffer, pH 8.4) staining was used as an aid for morphological characterization and measurements (Chaffey 2002). All samples were control stained to verify the absence of tension wood by double staining with Safranin and Astra Blue (Chaffey 2002).
Immunofluorescence labeling
Immunofluorescence labeling was carried out with five carbohydrate monoclonal antibodies shown in Table 2. Antibody labeling was performed using a 1:10 solution of the primary antibodies from Table 2 in PBS (pH 7.4) supplemented with 1% w/v BSA overnight at 4 °C (Puhlmann et al. 1994). After labeling, slides were washed 4 × 15 min with distilled water. The presence of primary antibody was detected with 1:500 solution of FITC conjugated (goat) anti-mouse or anti-rat IgG according to the manufacturers’ instructions (Sigma) in PBS (pH 7.4) for 1 h at room-temperature. Finally, all slides were washed for 15 min in PBS solution (pH 7.4) and 15 min in distilled water. Control samples were labeled in parallel with omission of the primary antibody.
Table 2. Immunolabeling Antibodies

Morphological characterization
Morphological characterization was carried out according to the IAWA standard (Wheeler and Gasson 1989). Briefly, one mean was calculated for each tree for each measurement to minimize pseudo replication. These means were based on 300 measurements for fiber lumen area, 100 for vessel lumen area, 100 for tangential and radial cell wall thickness, and a minimum of 60 for the remaining measurements. The fiber lumen area measurement was increased from the IAWA standard of 100 to 300 to normalize longitudinal geometrical effects. One complete set of images was recorded for the full area of each sector from cambium to pith at 43x magnification. Morphological measurements were made on fully differentiated cells, approximately 1 mm from the cambium. Image analysis was performed using Image-Pro Plus and ImageJ (Media Cybernetics 2009; Abramoff et al. 2004). Images of macerated fibers were taken of free fully hydrated fibers, tip-to-tip for fiber length. The morphological properties characterized were:
- Fiber length, width, and lumen area
- Double fiber radial and tangential cell wall thickness
- Vessel lumen area and vessel density
- Vessel type (single, double or multiple)
Fluorescence microscopy
Fluorescence microscopy of immunolabeled samples was conducted using a wide-field Leica DMRE fluorescence microscope fitted with a mercury lamp and I3-513808 filter-cube (Leica, excitation 450 to 490 nm, emission > 515 nm) (Leica Microsystems, Wetzlar, Germany). Reference images (i.e. before and after) were collected of sections labeled with one of the monoclonal antibodies listed in Table 2, together with images of control sections with omission of the primary antibody (i.e. labeled with only FITC conjugated anti-mouse IgG).
Immunocoverage quantification
Immunocoverage was defined as the fraction of signal area to total tissue area. Immunocoverage quantification was performed using ImageJ 1.42 on Java 1.6 with a customized Difference of Gaussian (DoG) protocol,

Results of the protocol are illustrated in Fig. 1. The collected lignin autofluorescence images were utilized both as a reference for the full cell wall area, and for background subtraction from the immunolabeled image.
For a set of two images, the green color channel was isolated, and the images were aligned using a scale invariant feature transform (SIFT) algorithm (Lowe 1999, 2004). After alignment, the immunolabeling signal was isolated by subtracting the autofluorescence image from the immunofluorescence image using a DoG algorithm (see above).
A narrow Gaussian kernel (σ1 = 1.5) was applied to the immunofluorescence image and a wide Gaussian kernel (σ2 = 2.4) was applied to the autofluorescence image. The ratio between the two kernels was maintained at 1.6 for optimal blur reduction and sharpening (Marr 1982).

Fig. 1. Illustration of Gaussian image subtraction. Autofluorescence signal of wood section (A), autofluorescence and immunofluorescence labeling of antibody CCRC-M8 (B), resulting subtraction of images A and B (C), and resulting subtraction overlaid on thresholded image A (D).
The resulting immunolabeling signal and autofluorescence images were then cropped to the area of interest and thresholded to remove noise and to isolate the signals. Thresholding was performed using two fixed thresholding levels under manual supervision (Billinton and Knight 2001). In this study 18 and 15, respectively, were used as thresholding levels based on a 256 gray-scale image. A lower thresholding level was required for the resulting immunolabeling signal image due the DoG subtraction. From the thresholded images, coverage was calculated as total area of the isolated immuno-signal, divided by the total area of isolated tissue. The effects of photobleaching were estimated using separate time series experiments which indicated that no corrections were warranted or required over the two exposures employed. For more details and examples please see:
https://bitbucket.org/sandquist/fluoroj/wiki/Home
Statistical model for analysis
To effectively compare the different lines, genotypes, and controls, it was necessary to conduct multivariate statistical analysis. To facilitate this, it was necessary to consider both groups and lines in the statistical model. However, because of dimensional complexity, only fiber, tree height, and diameter measurements were included in the multivariate model. The remaining vessel measurements were analyzed with univariate versions of the model. The multivariate model used for the analysis was,

 (2)
(2)
where n is the number of dimensions/variables, µ = [µ(1) , . . . , µ(7)]‘ = the vector of overall means, γij= [γij(1) , . . . , γij(7)]‘ = the vector of genotype effects, and j = 0, . . . , ni , n1 = 9, n2 = 2 are the fixed effects (genotypes in group A and B, respectively). The vectors of random effects for line and residual variation ℓijk = [ℓijk(1) , . . . , ℓijk(7)]‘ and eijkm = [eijkm(1) , . . . , eijkm(7)]‘ are assumed to follow multivariate normal distributions with mean vectors 0 and covariance matrices:

and

respectively. The vectors  and
and  are assumed independent.
The model, or parts of it, was used for different comparisons. First, to compare the control genotypes of the groups, it was possible to simplify the model as the controls with subscript j = 0, because it contained only one line with k = 1, implying the line effects ℓi01 = 0. Thus, the model for the comparison of controls was  , and the tests were performed as a T2−test, a generalization of the t−test, proposed by Hotelling (1931). Secondly, in the complete model there was a risk that the estimates of the components of
  degenerate; in case estimates of the diagonal elements of would equal zero. This was checked by univariate versions of the model. In the final multivariate model, the components for variance and covariance were set to zero.
The comparisons of genotypes versus their group controls were performed by using the multivariate model and univariate version for one variable at a time. The test variable for the multivariate comparisons was an approximate F statistic with 7 df in the numerator, and for the univariate comparison, a t statistic was used. If the components of were non-zero, then the precision of the comparison of a genotype against its control was influenced by the variation among the lines in addition to the variation among residual errors. The set of comparisons within a group were adjusted for experiment-wise error using Bonferroni adjustments. A single difference was considered significant if the p−value was at most 0.05/9 = 0.0056 or 0.05/3 = 0.0167 in the A and B groups, respectively.
RESULTS AND DISCUSSION
Group and Line Effects
For this study, two genetic transformations were carried out per genotype to generate two independent lines that were propagated to give three replicates per line. Due to random mortality, in total 65 transgenic plants were analyzed. The transgenic trees were planted at two separate times in the same greenhouse accompanied by a set of controls, resulting in two groups A and B. There were 8 and 10 non-transformed plants in each control group A and B, respectively.
Normally, to accumulate a sufficiently large population for statistical evaluation it is necessary to group the results from multiple transgenic lines together, as was the case in this study. However, this can only be done when line variations have at most a negligible impact on the combined statistical evaluation. Line variations are of less biological and biochemical interest in comparative analysis, as they may be caused by dose differences between lines, while the overall trends of change are still the same. In the present study, there were no (multivariate) statistically significant line variations, and plots of line effects and (random error) residuals did not show any essential deviations from the assumption of normal distributions. Furthermore, there were no significant individual differences, as shown in Tables 3 and 4, with the exception of CCRC-M1 and fiber width.
Table 3. Estimated Variances of Immunocoverage Residuals

In addition, there were no overall (multivariate) significant differences between the two control groups in A and B, either in morphology (p=0.182) or immunolabeling (p=0.229). However, individually, there were significant differences in radial and tangential fiber cell wall thickness, as well as the immunolabeling pattern of antibody CCRC-M8. This may be an indication of seasonal dependency in fiber cell wall formation, possibly influenced by the light in the greenhouse. Based on these results, it was deemed appropriate to combine the results from groups A and B into one multivariate evaluation.
Morphological Relationships
From the multivariate analysis, it was possible to analyze not only individual measurements, but also covariation between measurements. These are shown above the diagonal in Tables 3 and 4. The remaining non-significant morphological results have been omitted. From the morphological and growth measurements, a significant correlation was observed between plant height and stem (plant) diameter (0.71) (Table 4). A significant correlation between fiber length and fiber lumen area (0.32) was also apparent. A negative significant correlation (-0.33) between radial fiber cell wall thickness and fiber lumen area (in the absence of correlation with fiber width) indicated that an increase in fiber cell wall thickness took place at the cost of fiber lumen area and not overall fiber width. This significant correlation between radial- and tangential cell wall thickness (0.83; Table 4) further demonstrates the importance of uniform fiber cell wall development in aspen.
Table 4. Estimated Variances of Morphological Residuals and Correlations

Immunocoverage Interpretation
Changes in immunocoverage indicate absolute changes that may have been caused by chemical, morphological, masking, or micro-structural changes. Without a more in-depth study, it is difficult to assess which of these possibilities contribute most to the measured change. The performance of a particular protein, such as an antibody, will also contribute to the sensitivity and selectivity. Without further evidence, our interpretation in the present study is that a significantly different immunocoverage measurement indicates a change in concentration or masking (e.g. by change in the cell wall ultrastructure) of the epitope.
Immunocoverage Relationships
Interpretation of the statistical relationships for immunocoverage properties, shown in Table 3, was less straightforward than for the equivalent morphological properties. A significant correlation was observed between CCRC-M1 (xyloglucan) and CCRC-M8 (arabinogalactan; 0.28, Table 3). The signal from CCRC-M1 was most prominent in ray cell walls (Fig. 2A), vessel pits, and primary cell walls. In contrast, the signal from CCRC-M8 was almost exclusively found in the ray cell walls (Fig. 2B). Potentially, this covariance may reflect changing ray distributions in the samples.

Fig. 2. Reference staining patterns on wildtype for the antibodies, CCRC-M1 (A), CCRC-M8 (B), Negative mouse IgG control (C), JIM-5 (D), JIM-7 (E), and LM-10 (F).
An indication of statistical correlation also was observed between CCRC-M1 and JIM-7 (putative methyl-esterified homogalacturonan) (Table 3). The (weak) signal from JIM-7 was mainly found in vessels, rays, and middle-lamella cell corners (MLcc) (Fig. 2E), and was consistent with previous reports (Hafrén and Westermark 2001; Knox et al. 1990). Most likely the covariation was caused by similarities in signal patterns for these antibodies, coupled with changes in cell distribution in the tissue.
Interestingly, the lack of correlation between CCRC-M1 and JIM-5 (homogalacturonan) may be caused by a much stronger signal in the MLcc for JIM-5 than for JIM-7 (Figs. 2D and E), which was consistent with earlier reports (Hafrén and Westermark 2001; Knox et al. 1990). This may have caused the JIM-5 signal to be more influenced by fiber corner (Mlcc) distribution than either CCRC-M1 or JIM-7. In addition, the signal from JIM-7 was overall less intense than for JIM-5 in our samples (Figs. 2D and E). This putatively supports the suggestion by Siedlecka et al. (2008) that pectins in aspen are mainly non-esterified.
We also observed an indication of negative statistical correlation between JIM-5 and LM-10 (xylan) (Table 3). The LM-10 signal was found in cell walls throughout tissue cross-sections and was not limited to any morphological features (Fig. 2F). This is consistent with earlier reports by Kim et al. (2012), Kim and Daniel (2012), and Altaner et al. (2010). This may indicate masking effects between homogalacturonan, pectins, and xylan. Alternatively, it may also be an effect of changes in fiber cell wall thickness affecting the relative amount of pectin signal. However, if this was the case, this raises questions regarding the lack of a similar relationship for CCRC-M1. The lack of a relationship for arabinogalactan was more easily perceived, as the CCRC-M8 signal was found almost exclusively in ray cell walls in aspen.
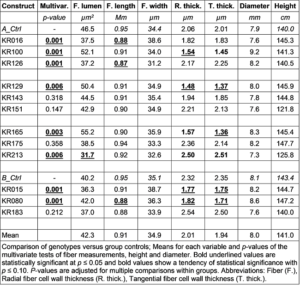
Table 5. Morphological Comparison of Genotypes versus Group Controls
Overall Genotypical Observations
With respect to results of individual genotypes and univariate measurements, only univariate significant results were observed for fiber morphological measurements and immunocoverage for the antibodies LM-10 (xylan) and JIM-5 (homogalacturonan). The univariate observations are summarized in Tables 5 and 6, for the morphology and immunocoverage results, respectively. The univariate vessel results exhibited, with one minor exception (vessel grouping of genotype KR183), non-significant results, and have therefore been omitted. However, they are still included in the overall multivariate model. It is speculated that fully functional ray and vessel formation is crucial for the development of a healthy phenotype. Subsequently, at this resolution, no significant changes were found for the two antibodies, which mainly target rays and vessels.
Table 6. Immunocoverage Comparison of Genotypes versus Group Controls

Individual Genotypical Observations
Genotype KR165 showed significant immunocoverage reductions with both JIM-5 (less esterified homogalacturonan) and LM-10 (xylan) (Figs. 3G, H; Table 6), combined with significantly reduced fiber cell wall thickness (Table 5). There was an approximate reduction by a factor of 2 in JIM-5 immunocoverage and a reduction by a factor of 35 for LM-10 immunocoverage. This change could not be explained by a relative increase in primary cell wall and MLcc at the cost of reduced secondary fiber cell wall development. Furthermore, it was highly unlikely that a healthy phenotype could develop with such a reduction in xylan. Instead, it is proposed that a knock down of the gene contributed to an overall reduced development, with masking or possibly substitutional changes of xylan as a side effect. This overall reduction would also decrease the relative “concentration” of primary cell wall and MLcc, leading to a reduction of the JIM-5 signal.

Fig. 3. Examples of the labeling of genotypes. JIM-5 (A) and LM-10 (B) labeling of KR143. JIM-5 (C) labeling of KR015. JIM-5 (D) and LM-10 (E) labeling of KR151. LM-10 (F) labeling of KR183. JIM-5 (G) and LM-10 (H) labeling of KR165. Together with Figure 2 the images demonstrate the difficulties in discerning quantitative differences between genotypes from visual inspection alone.
In addition, although not as statistically apparent, it is proposed that the effects on KR165 are similar for genotypes KR100 and KR126. For KR100 this was likely caused by both constructs for KR100 and KR165 targeting the same gene. Both KR100 and KR126 showed overall significance in immunocoverage without any univariate significance (Table 6). Morphologically, KR100 (Fig. 4B and Table 5) exhibited very similar trends as those for KR165, whereas KR126 showed a reduced fiber length (Table 5), instead of changes in cell wall thickness.
In contrast with KR165, genotype KR183 showed an indication for increased LM-10 immunocoverage combined with reduced fiber length, as shown in Fig. 3F and Tables 5 and 6. The reduced fiber length should not increase the volume of cross-cut tissue, and the increase in xylan binding was therefore likely caused by an unmasking or increased availability of the xylan epitope.
Genotypes KR143 and KR151 showed statistical indications of reduced labeling for both JIM-5 and LM-10 (Figs. 3A-B, D-E; Table 6), without significant changes in morphology (Table 5). Without a change in morphology, the most probable cause of these indications was masking or reduction of the xylan and pectin epitopes. Another possibility could have been substitutional changes of the xylan and pectins, but this was not possible to determine without further study.
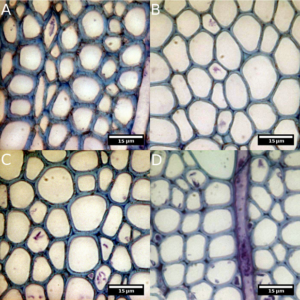
Fig. 4. Images of genotypes KR213 (A), KR100 (B), KR080 (C) and non-transformed reference wildtype (D). Genotype KR213 displays thick-walled fibers with smaller lumen area, whereas KR100 and KR080 show thin-walled fibers compared to the wildtype. These images also illustrate the difficulties in using only traditional visual observations to differentiate genotypes.
Genotypes KR015 (Fig. 3C) and KR129, showed no overall immunocoverage significance, but they did show morphological changes. This would suggest normal chemical content, but with slightly reduced morphological xylem development. Genotype KR015 showed a univariate indication of reduced JIM-5 immunocoverage (Figure 3C) which may indicate masking or reduction of pectins, or a relative reduced “concentration” of primary cell walls and MLcc epitopes. However, the absence of overall significance may indicate lack of a definitive trend. It is unlikely that any transformation that has a significant effect on xylem development will change only one cell property. Therefore, the lack of an overall significance calls for reservation of the importance of the univariate result.
Genotypes KR016, KR213 (Fig. 4A), and KR080 (Fig. 4C) displayed changes in morphology without changes in immunocoverage. The reduced fiber length (KR016, KR080) and change in fiber cell wall thickness (KR080, KR213) did not cause any significant changes in labeling with the range of epitopes used in this study.
Genotype KR175 displayed no significant difference in morphology or immuno-coverage compared to untransformed aspen reference trees.
Correlation with Level of Genetic Down-Regulation
As no overall correlations could be drawn between relative genetic knock-down and its impact on either morphology or cell wall chemistry, no attempt was made to include it as part of any statistical modeling in this study. Without significant detailed knowledge of the affected pathways, it is difficult to try to predict any magnitude effects. Therefore, a detailed discussion of the biochemical and microbiological effects of the presented genotypes was outside the scope of this study.
CONCLUSIONS
- Identification of genetic traits of changes in wood formation was achieved using immunofluorescence and morphological characterization in combination with a quantification framework. The presented methodology may provide indications on the underlying mechanisms for changes in traits, even with little or no prior knowledge of the biochemical/microbiological mechanisms involved.
- Presently, with the current knowledge available on the putative biological effects of the 12 transformations studied, it is difficult to speculate on any specific effects on cell wall biosynthesis, since a range of carbohydrate and protein systems have been investigated. However, the present quantitative screening analysis of morphological changes, induced in the transgenic aspen lines, demonstrated the integrated complexity of the systems involved.
- In addition, despite showing some significant statistical differences with multivariate analysis, this was not reflected in any readily apparent changes in the visual appearance of the plants or extreme differences in the wood anatomy. Indeed, from transverse sections of significantly different genotypes, changes in wood cell wall thickness/lumen size were not dramatic (Fig. 4 A-D). Therefore, present results emphasize the importance of conducting an extensive statistical analysis with large sample size in order to study changes in traits in wood formation.
ACKNOWLEDGMENTS
The authors gratefully acknowledge funding provided by the Formas FuncFiber Center of Excellence (www.funcfiber.se). The authors gratefully acknowledge Prof. Björn Sundberg for supplying the hybrid plants, and Prof. Sundberg and SweTree Technologies for the initial screening of these genotypes (swetree.com).
REFERENCES CITED
Abramoff, M., Magelhaes, P., and Ram, S. (2004). “Image processing with ImageJ,” Biophotonics International 11(7), 36-42.
Alonso-Simón, A., Kristensen, J. B., Obro, J., Felby, C., Willats, W. G., and Jørgensen, H. (2010). “High-throughput microarray profiling of cell wall polymers during hydrothermal pre-treatment of wheat straw,” Biotechnology Bioengineering 105(3), 509-514. DOI: 10.1002/bit.22546
Altaner, C., Knox, J. P., and Jarvis, M. C. (2007). “In situ detection of cell wall polysaccharides in Sitka spruce (Picea sitchensis (Bong.) carriére) wood tissue. BioResources 2, 284-295
Altaner, C., Tokareva, E., Jarvis, M., and Harris, P. (2010). “Distribution of (1-4)-beta-galactans, arabinogalactan proteins, xylans and (1-3)-beta-glucans in tracheid cell walls of softwoods,” Tree Physiology 30, 782-793. DOI: 10.1093/treephys/tpq021
Andrews, D. L. (1989), “A unified theory of radiative and radiation less molecular energy transfer,” Chemical Physics 135(2), 195-201. DOI:10.1016/0301-0104(89)87019-3
Awano, T., Takabe, K., Fujita, M., and Daniel, G. (2000). “Deposition of glucuronoxylans on the secondary cell wall of Japanese beech as observed by immuno-scanning electron microscopy,” Protoplasma 212, 72-79. DOI: 10.1007/BF01279348
Bhat, R. A. (2009). “FRET and FLIM applications in plants,” in: FRET and FLIM Techniques – Laboratory Techniques in Biochemistry and Molecular Biology (Book 33), Gadella, T.W.J. (ed.), Elsevier Science, Amsterdam. ISBN: 9780080915128
Billinton, N., and Knight, A. (2001). “Seeing the wood through the trees: A review of techniques for distinguishing green fluorescent protein from endogenous autofluorescence,” Analytical Biochemistry291, 175-197. DOI: 10.1006/abio.2000.5006
Bowling, A. J., and Vaughn, K. C. (2008). “Immunocytochemical characterization of tension wood: Gelatinous fibers contain more than just cellulose,” American Journal of Botany 95, 655-663. DOI: 10.3732/ajb.2007368
Chaffey, N. L. (2002). “Wood microscopy techniques” in: Wood Formation in Trees, NL Chaffey (ed), Taylor & Francis Inc, London. DOI: 10.1093/aob/mcf216
Clausen, M. H., Willats, W. G., and Knox, J. P. (2003). “Synthetic methyl hexagalacturonate hapten inhibitors of anti-homogalacturonan monoclonal antibodies LM-7, JIM5 and JIM7,” Carbohydrate Research 338, 1797-1800. DOI 10.1016/S0008-6215(03)00272-6
Daniel, G., Filonova, L., Kallas, A. S. M., and Tuula, T. T. (2006). “Morphological and chemical characterisation of the G-layer in tension wood fibres of Populus tremula and Betula verrucosa: Labelling with cellulose-binding module CBM1HjCel7A and fluorescence and FE-SEM microscopy,” Holzforschung 60, 618-624. DOI: 10.1515/HF.2006.104
Donaldson, L., Radotić, K., Kalauzi, A., Djikanović, D., and Jeremić, M. (2010). “Quantification of compression wood severity in tracheids of Pinus radiata D. Don using confocal fluorescence imaging and spectral deconvolution,” Journal of Structural Biology 169,106-115. DOI: 10.1016/j.jsb.2009.09.006
Donaldson, L.A., and Knox, J. P. (2012). “Localization of cell wall polysaccharides in normal and compression wood of radiata pine: Relationships with lignification and microfibril orientation,” Plant Physiology 158, 642-653. DOI: http://dx.doi.org/10.1104/pp.111.184036
Freshour, G., Bonin, C. P., Reiter, W. D., Albersheim, P., Darvill, A. G., and Hahn, M. G. (2003). “Distribution of fucose-containing xyloglucans in cell walls of the mur1 mutant of Arabidopsis thaliana,” Plant Physiol. 131, 1602-1612. DOI: 10.1104/pp.102.016444
Förster, T. (1948), “Zwischenmolekulare Energiewanderung und Fluoreszenz,” Annalen der Physik437(1-2), 55-75. DOI: 10.1002/andp.19484370105
Grünwald, C., Ruel, K., and Schmitt, U. (2002a). “Differentiation of xylem cells in rolC transgenic aspen trees-a study of secondary cell wall development,” Annals of Forest Science 59, 679-685. DOI: http://dx.doi.org/10.1051/forest:2002056
Grünwald, C., Ruel, K., Joseleau, J.-P., and Fladung, M. (2001). “Morphology, wood structure and cell wall composition of rolC transgenic and non-transformed aspen trees,” Trees 15, 503-517. DOI: 10.1007/s00468-001-0126-6
Grünwald, C., Ruel, K., Kim, Y., and Schmitt, U. (2002b). “On the cytochemistry of cell wall formation in poplar trees,” Plant Biology 4, 13-21. DOI: 10.1055/s-2002-20431
Hafrén, J., and Westermark, U. (2001). “Distribution of acidic and esterified polygalacturonans in sapwood of spruce, birch and aspen,” Nord. Pulp Pap. Res. J. 16(4), 284-290. DOI: 10.3183/NPPRJ-2001-16-04-p284-290
Hosoo, Y., Imai, T., and Yoshida, M. (2006). “Diurnal differences in the supply of glucomannans and xylans to innermost surface of cell walls at various developmental stages from cambium to mature xylem in Cryptomeria japonica,” Protoplasma 229, 11-19. DOI: 10.1007/s00709-006-0190-2
Hotelling, H. (1931). “The generalization of Student’s ratio,” Annals of Mathe-
matical Statistics 2(3), 360-378. DOI: 10.1214/aoms/1177732979
Joseleau, J.-P., Imai, T., Kuroda, K., and Ruel, K. (2004). “Detection in situ and characterization of lignin in the G-layer of tension wood fibres of Populus deltoids,” Planta 219, 338-345. DOI: 10.1007/s00425-004-1226-5
Kim, J. S., and Daniel, G. (2012). “Distribution of glucomannans and xylans in poplar xylem and their changes under tension stress,” Planta 236, 35-50. DOI: 10.1007/s00425-012-1588-z
Kim, J. S., Awano, T., Yoshinaga, A., and Takabe, K. (2010). “Immunolocalization and structural variations of xylan in differentiating earlywood tracheid cell walls of Cryptomeria japonica,” Planta232, 817-824. DOI: 10.1007/s00425-010-1225-7
Kim, J. S., and Daniel, G. (2013). “Developmental localization of homogalacturonan and xyloglucan epitopes in pit membranes varies between pit types in two poplar species,” IAWA J. 34, 245-262. DOI: 10.1163/22941932-00000021
Kim, J. S., Sandquist, D., Sundberg, B., and Daniel, G. (2012). “Spatial and temporal variability of xylan distribution in differentiating secondary xylem of hybrid aspen,” Planta 235, 1315-1330. DOI: 10.1007/s00425-011-1576-8
Karimi, M., Inze, D., and Depicker, A. (2002). “GATEWAY(TM) vectors for agrobacterium-mediated plant transformation,” Trends in Plant Science 7(5), 193-195. DOI: 10.1016/S1360-1385(02)02251-3
Knox, J., Linstead, P., King, J., Cooper, C., and Roberts, K. (1990). “Pectin esterification is spatially regulated both within cell walls and between developing tissues of root apices,” Planta 181, 512-521. DOI: 10.1007/BF00193004
Knox, P., and McCartney, L. (2005). “Carbohydrate-binding modules as molecular probes for plant cell wall polymers,” Microscopy and Microanalysis 11, 1128-1129. DOI: http://dx.doi.org/10.1017/S1431927605501806
Lowe, D. (2004). “Distinctive image features from scale-invariant keypoints,” International Journal of Computer Vision 60(2), 91-110. DOI: 10.1023/B:VISI.0000029664.99615.94
Lowe, D. G. (1999). “Object recognition from local scale-invariant features,” in: Computer Vision, the Proceedings of the Seventh IEEE International Conference on 2, 1150 -1157. DOI: 10.1109/ICCV.1999.790410
Marr, D. (1982). “Representing the image,” in: Vision: A Computational Investigation into the Human Representation and Processing of Visual Information, Wilson J (ed), W. H. Freeman and Co., 1st Ed., San Francisco, USA, pp. 62-63. ISBN: 9780262514620
Mast, S. W., Donaldson, L., Torr, K., Phillips, L., Flint, H., West, M., Strabala, T. J., and Wagner, A. (2009). “Exploring the ultrastructural localization and biosynthesis of β (1, 4)-galactan in Pinus radiata compression wood,” Plant Physiology 150, 573-583. DOI: http://dx.doi.org/10.1104/pp.108.134379
McCartney, L., Marcus, S. E., and Knox, J. P. (2005). “Monoclonal antibodies to plant cell wall xylans and arabinoxylans,” J. Histochem. Cytochem. 53(4), 543-6. DOI: 10.1369/jhc.4B6578.2005
Media Cybernetics (2009). Image-Pro Plus 6.0. http://www.mediacy.com/
Nilsson, O., Aldén, T., Sitbon, F., Little, A. C. H., Chalupa, V., Sandberg, G., and Olsson, O. (1992). “Spatial pattern of cauliflower mosaic virus 35S promoter-luciferase expression in transgenic hybrid aspen trees monitored by enzymatic assay and non-destructive imaging,” Transgenic Research 1, 209-220. DOI: 10.1007/BF02524751
Nishikubo, N., Awano, T., Banasiak, A., Bourquin, V., Ibatullin, F., Funada, R., Brumer, H., Teeri, T. T., Hayashi, T., and Sundberg, B. (2007). “Xyloglucan endo-transglycosylase (XET) functions in gelatinous layers of tension wood fibers in poplar -a glimpse into the mechanism of the balancing act of trees,” Plant and Cell Physiology 48, 843-855. DOI: 10.1093/pcp/pcm055
Pattathil, S., Avci, U., Baldwin, D., Swennes, A., McGill, J., Popper, Z., Bootten, T., Albert, A., Davis, R., Chennareddy, C., Dong, R., O’Shea, B., Rossi, R., Leoff, C., Freshour, G., Narra, R., O’Neil, M., York, W., and Hahn, M. (2010). “A comprehensive toolkit of plant cell wall glycan-directed monoclonal antibodies,” Plant Physiology 153, 514-525. DOI: 10.1104/pp.109.151985
Puhlmann, J., Bucheli, E., Swain, M., Dunning, N., Albersheim, P., Darvill, A., and Hahn, M. G. (1994). “Generation of monoclonal antibodies against plant cell wall polysaccharides. I. Characterization of a monoclonal antibody to a terminal alpha-(1,2)-linked fucosyl-containing epitope,” Plant Physiology 104, 699-710. DOI: 10.1104/pp.104.2.699
Ruel, K., Chevalier-Billosta, V., Guillemin, F., Berrio-Sierra, J., and Joseleau, J.-P. (2006). “The wood cell wall at the ultrastructural scale-formation and topochemical organization,” Maderas Ciencia y Tecnología 8, 107-116. DOI: http://dx.doi.org/10.4067/S0718-221X2006000200004
Sandquist, D., Filonova L., von Schantz, L., Ohlin, M., and Daniel, G. (2010). “Microdistribution of xyloglucan in differentiating poplar cells,” BioResources 5(2), 796-807.
Siedlecka, A., Wiklund, S., Peronne, M., Micheli, F., Lesniewska, J., Sethson, I., Edlund, U., Richard, L., Sundberg, B., and Mellerowicz, E. (2008). “Pectin methyl esterase inhibits intrusive and symplastic cell growth in developing wood cells of Populus,” Plant Physiology 146, 554-565. DOI: 10.1104/pp.107.111963
Sjödin, A., Street, N. R., Sandberg, G., Gustafsson, P., and Jansson, S. (2009). “The Populus genome integrative explorer (PopGenIE): A new resource for exploring the Populus genome,” The New Phytologist 182(4), 1013-1025, DOI:10.1111/j.1469-8137.2009.02807.x. PMID 19383103
Verhertbruggen, Y., Marcus, S., Haeger, A., Ordaz-Ortiz, J., and Knox, J. (2009). “An extended set of monoclonal antibodies to pectic homogalacturonan,” Carbohydrate Research 344, 1858-1862. DOI: 10.1016/j.carres.2008.11.010
Wheeler, E., and Gasson, P. (eds) (1989). “IAWA list of microscopic features for hardwood identification,” International Association of Wood Anatomists (IAWA), IAWA Bulletin n.s. 10(3), 219-332.
Willats, W., Limberg, G., Buchholt, H., van Alebeek, G., Benen, J., Christensen, T., Visser, J., Voragen, A., Mikkelsen, J., and Knox, J. (2000). “Analysis of pectic epitopes recognised by hybridoma and phage display monoclonal antibodies using defined oligosaccharides, polysaccharides, and enzymatic degradation,” Carbohydrate Research 327(3), 309-320. DOI: 10.1016/S0008-6215(00)00039-2
Wise, L. E., Murphy, M., and d’ Addieco, A. A. (1946). “A chlorite holocellulose, its fractionation and bearing on summative wood analysis and studies on the hemicelluloses,” Paper Trade Journal 122(2), 35-43.
Zhang, Y., Brown, G., Whetten, R., Loopstra, C. A., Neale, D., Kieliszewski, M. J., and Sederoff, R. R. (2003). “An arabinogalactan protein associated with secondary cell wall formation in differentiating xylem of loblolly pine,” Plant Molecular Biology 52, 91-102. DOI: 10.1023/A:1023978210001
Article submitted: January 7, 2015; Peer review completed: May 4, 2015; Revised version received: June 22, 2015; Accepted: June 23, 2015; Published: June 25, 2015.
DOI: 10.15376/biores.10.3.4997-5015