
Abstract
One challenge of monitoring and inspecting timber bridges is the difficulty of measuring the moisture content anywhere other than close to the surface. Damage or design mistakes leading to water penetration might not be detected in time, leading to costly repairs. By placing electrodes between the glulam beams, the moisture content through the bridge deck can be measured. Due to the logarithmic decrease of the resistance in wood as a function of electrode length, the model must be calibrated for measurement depth. Two models were created: one for electrode lengths of 50 mm and one for electrode lengths up to 1355 mm. The model for short electrodes differed by no more than 1 percentage points compared with the oven dry specimens. The model for long electrodes differed up to 2 percentage points for lengths up to 905 mm, and over that it could differ up to 4 percentage points.
Download PDF
Full Article
Resistance Measurements to Find High Moisture Content Inclusions Adapted for Large Timber Bridge Cross-Sections
Niclas Björngrim,a,* Per-Anders Fjellström,b and Olle Hagman a
One challenge of monitoring and inspecting timber bridges is the difficulty of measuring the moisture content anywhere other than close to the surface. Damage or design mistakes leading to water penetration might not be detected in time, leading to costly repairs. By placing electrodes between the glulam beams, the moisture content through the bridge deck can be measured. Due to the logarithmic decrease of the resistance in wood as a function of electrode length, the model must be calibrated for measurement depth. Two models were created: one for electrode lengths of 50 mm and one for electrode lengths up to 1355 mm. The model for short electrodes differed by no more than 1 percentage points compared with the oven dry specimens. The model for long electrodes differed up to 2 percentage points for lengths up to 905 mm, and over that it could differ up to 4 percentage points.
Keywords: Timber bridge; Wood sensors; Timber bridge monitoring; Moisture content
Contact information: a: Luleå University of Technology, SE-931 87, Skellefteå, Sweden; b: SP – Science Partner, Laboratorgränd 2, SE- 931 62, Skellefteå, Sweden;
* Corresponding author: niclas.bjorngrim@ltu.se
INTRODUCTION
Timber bridges built in Sweden have a required service life of 40 or most often 80 years. In order to meet the service life requirement, the most important thing is to make sure that moisture cannot enter the structure. The moisture content (MC) is the best indicator of design flaws and damage to the structure. A high local level of MC indicates any of the aforementioned problems. If the MC of wood exceeds 20% for longer periods, there is a risk for rot, which will start decaying the timber and reduce the structural integrity. If the MC exceeds the fiber saturation point (FSP) at 28 to 30%, then the risk is significantly increased. High levels of moisture might also lead to cupping of the bridge deck and a decrease in the stiffness of the deck. Bengtsson (2000) reported a change of 1% in Young’s modulus per percent of MC. All bridges in Sweden, regardless of material, are inspected every six years. The MC measurements performed during an inspection are made manually, close to the surface, and on accessible parts. Swedish timber bridges are largely owned by municipalities and forest companies. The owners do not have the expertise or the means necessary for adequate bridge inspections. A reliable, robust, and cost-effective system for MC measurements in timber bridges would be a valuable tool to keep timber bridges serviceable.
Because the electrical properties of wood are quite accurate functions of MC from 0% to FSP (James 1963) and the MC is proportional to the resistance up to FSP (Stamm 1927), resistance measurements are suitable as a monitoring tool. Resistance meters are commercially available both for measuring MC in boards as well as for monitoring timber structures. Resistance meters have a measurement accuracy of about +/- 1.5% units between 6 and 24% MC at temperatures above 5 °C (Forsén and Tarvainen 2000). For the sake of bridge monitoring, it is sufficient to know whether the MC is sound, elevated, or over the FSP. The sensor used to monitor moisture content (MC) is usually placed on the underside of the bridge deck to measure the MC at a depth of a few centimeters (Dietsch et al. 2015; Björngrim et al. 2016). These sensors would not be able to detect high levels of MC close to the top of the deck or in the middle of the deck close to the pre-stressing rods, nor would an inspector be able to evaluate those spots. Other bridges have used sensors that measure the MC at a few isolated points in the bridge deck (Dyken and Klepp 2010; Tannert et al. 2010). These sensors are better suited to monitor moisture, but still only measure at a few points in the deck. Pousette and Fjellström (2016) reported their experiences from 67 stress laminated timber bridges built between 1994 and 2015; 21 of those bridges showed MC over 20%, and eight had rot.
Swedish timber bridge manufacturers have produced timber bridge decks of thicknesses of 225 to 1400 mm. By using electrodes a few centimeters shorter than the thickness of the bridge deck and mounting them at key points, it is possible to monitor moisture coming from the top, sides, and the underside of a bridge. This paper evaluates the parameters influencing resistance measurements in stress-laminated bridge decks and presents an model for acquiring the correct MC on the basis of electrode length.
EXPERIMENTAL
Materials
The study was based on glulam specimens of two sizes, boards, and stress-laminated glulam. All specimens were made from the Norway spruce (Picea abies). All glulam specimens used melamine-urea-formaldehyde adhesive and 45 mm-wide lamellas.
The small glulam specimens were 270 mm long, 60 mm wide, and 18 mm thick and were made of six lamellas. The thickness of the glulam is typically used for pedestrian timber bridges. The large glulam specimens were 495 mm long, 65 mm wide, and 55 mm thick and made of 11 lamellas. The fiber direction is along the width of the glulam specimens The boards were 266 mm long, 68 mm wide, and 25 mm thick. The stress-laminated glulam was made of three glulam beams, where each beam measured 450 mm high, 620 mm long, and 90 mm wide. The three beams were pre-stressed to 0.3 MPa by two tensioning rods. On each side of the rod there was a hardwood bearing plate, an anchor plate in aluminum, and a stainless steel plate closest to the pre-stressing rod. The uninsulated electrodes were made of stainless steel thread with a diameter of 0.75 mm. The resistance was measured with a Fluke 1507 resistance tester (Everett, WA, USA). An Instron 5500 R universal testing machine (Norwood, MA, USA) was used to apply pressure on the specimens to simulate the stress-laminated force.
Methods
It was hypothesized that resistance in glulam is a function of the MC, number of glue lines, and the pre-stressing force. To evaluate this hypothesis, four laboratory tests were performed. The resistance was measured with a Fluke 1507 resistance tester.
The distance between the electrodes was set to 25 mm as used by off-the-shelf moisture meters. The distance between the electrodes did not have any significant effect on the measurement (James 1963). The specimens from Tests I through III were oven dried (O. D.) at 103 °C for 24 h to determine the MC.
Test I
The first test was conducted to evaluate how the pre-stressing force and number of glue lines affected the resistance of the specimen; ten small glulam specimens were used. The specimens were labeled A through J. Two electrodes, spaced 25 mm apart, were placed between a pair of glulam specimens (Fig. 1), and then the specimens were placed in the universal testing machine and pressure was applied. The electrode length was tested at 50 mm, 95 mm, 140 mm, 185 mm, and 230 mm, thus passing one glue line at 50 mm, two at 95 mm, and so forth. For each electrode length tested, three different pressures were applied: 0.3 MPa, 0.7 MPa, and 1 MPa. The tests were performed with the glulam specimens conditioned to a target MC of 12%, 20%, and 25%.
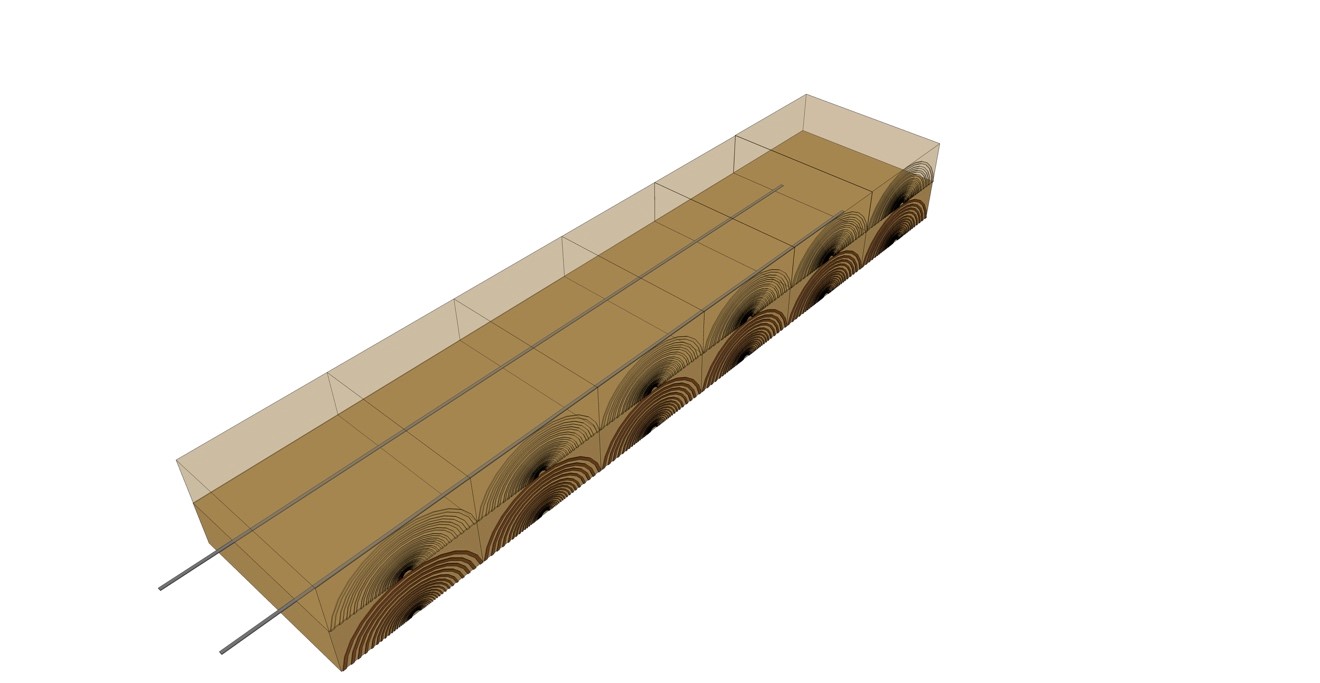
Fig. 1. Schematic of test 1, a pair of small glulam specimens with electrodes clamped in between
Test II: Specimens without glue
The second test was performed to determine whether the electrode length affected the resistance. The test was performed similarly to Test I, but instead of glulam, regular spruce boards of the same dimensions were used. For practical reasons the electrodes were placed parallel to the grain, whereas in Test I they had been placed perpendicular to the grain. Two regular spruce boards with two electrodes spaced 25 mm apart were tested. The electrode length was tested at 50 mm, 95 mm, 140 mm, 185 mm, and 230 mm. The boards where conditioned to a target MC of 12%. For each tested length, the force applied on the specimens was 0.3 MPa, 0.7 MPa, and 1 MPa.
Test III: Long specimens
To evaluate the resistance of long electrodes, two 1485 mm-long glulam specimens were used. The long specimens consisted of three glulam pieces clamped together with a bar clamp. Each piece was 495 mm long. The glulam was conditioned at 12% MC. The electrodes were placed in between, and a pre-stress force of 0.7 MPa was applied with the universal testing machine (Fig. 2). The resistance was measured at a depth of 185 mm and then at every 90 mm increment of the glulam length.
Test IV: Temperature dependency
The fourth test investigated how the temperature affected the resistance of the wood. A stress-laminated deck was conditioned to 12% MC and then equipped with
electrodes and temperature sensors (Fig. 3). The stress-laminated deck was placed in a climate chamber, and the temperature was lowered from 20 °C to -20 °C by decrements of 5 °C. At each temperature step, the resistance was measured at a depth of 45 mm and 430 mm. Each decrement of temperature took 18 h.
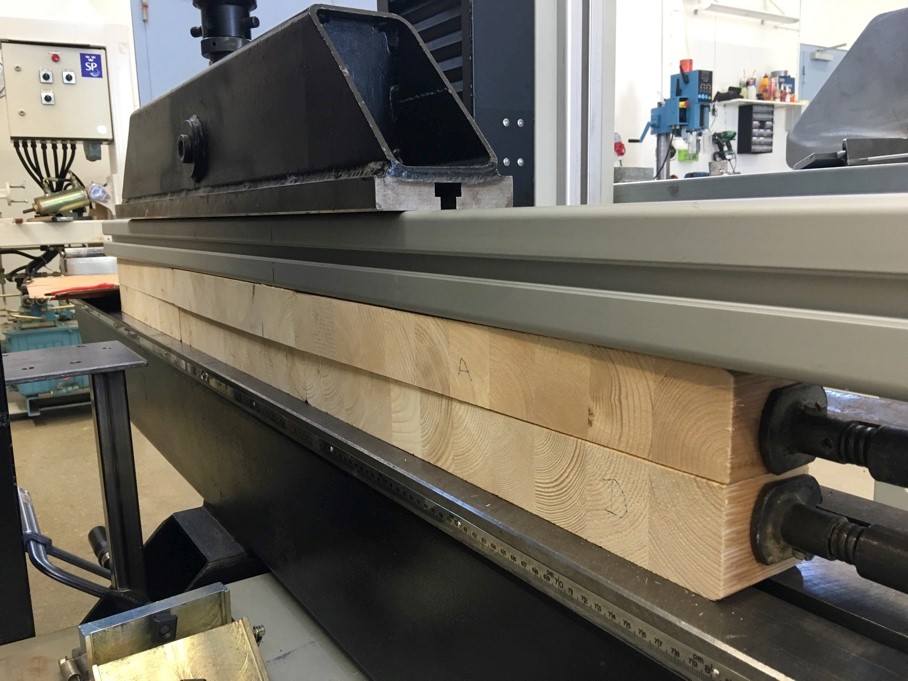
Fig. 2. Two long glulam specimens under pressure in the universal testing machine
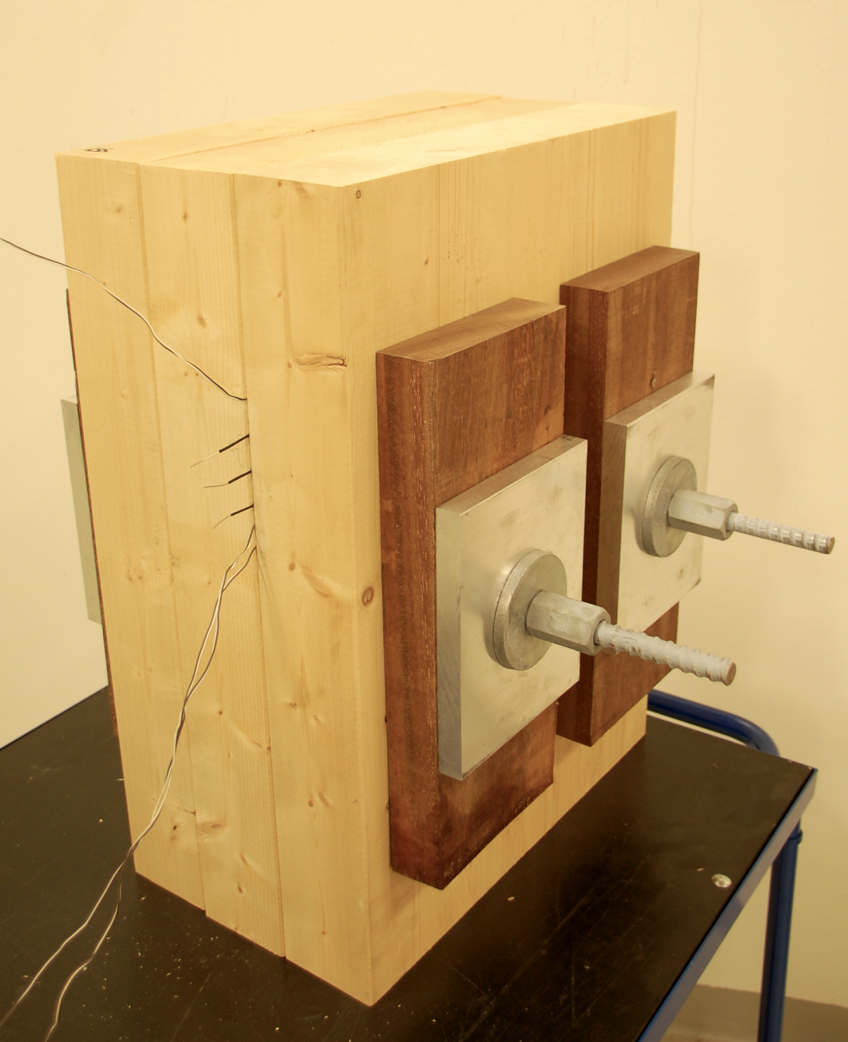
Fig. 3. Three stress-laminated glulam beams with three electrodes for resistance measurements and three thermocouples
RESULTS AND DISCUSSION
All the specimens had been conditioned to the target MC for weeks, but the MC distribution was not constant. The resistance measured was the lowest resistance in the cross-section, which means that the highest MC in the cross-section was found.
Result of Test I
All resistance measurements are presented in Table 1. As the length of the electrode increased, the resistance decreased. In Fig. 4, the decrease in resistance is logarithmic. Due to the large difference in measured resistance compared to electrode length, it was necessary to create two models: one model for measurements close to the bottom of the deck using short electrodes, and another for the middle and topside of the deck using long electrodes.
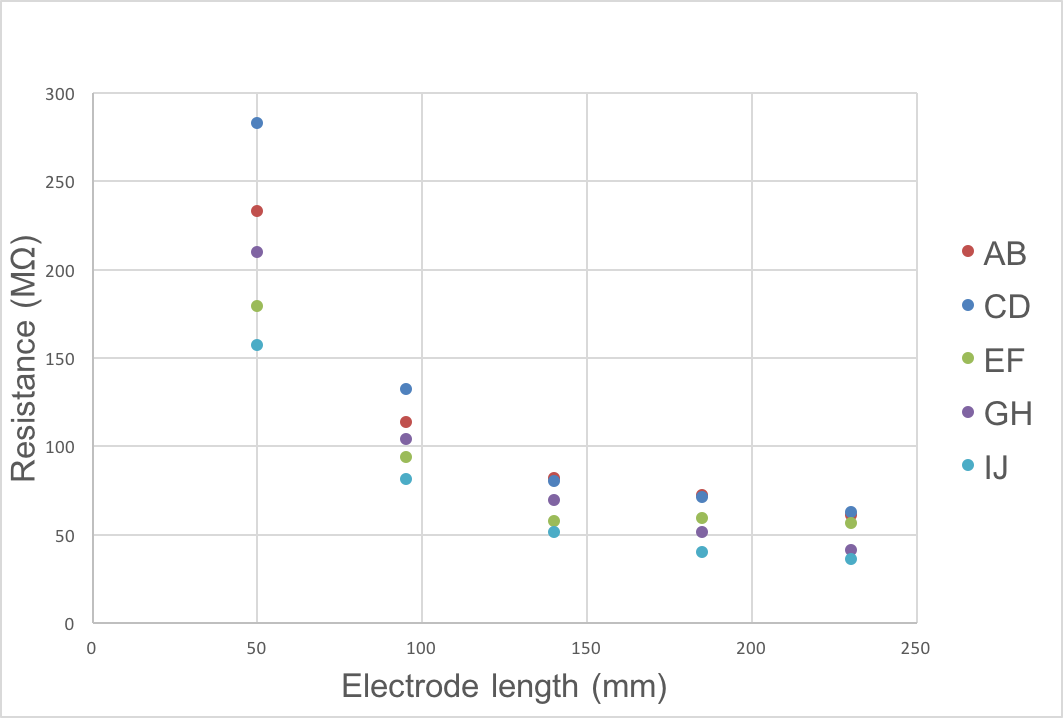
Fig. 4. Decrease in resistance as the electrode length increased for the five specimen pairs at 0.3 MPa pre-stress force
In Fig. 5, the resistance for five different specimen combinations at three different pre-stress forces and the standard error is presented. There was no significant difference between the different pre-stress forces tested. The conditioning of the small glulam specimens to 25% MC failed, and the actual MC was around 30%.
Table 1. Measured Resistance for the Specimens at Different Electrode Lengths, Different Pre-Stress Forces, and Target MC and Actual MC
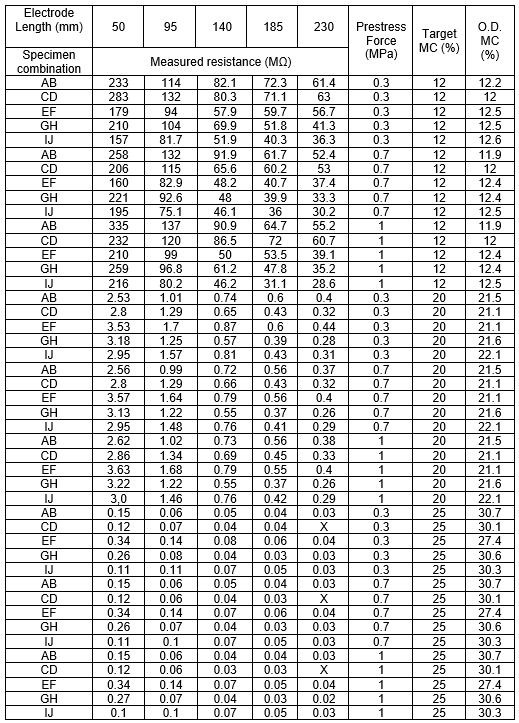
Note: X denotes a value that is too low for the resistance meter to measure.
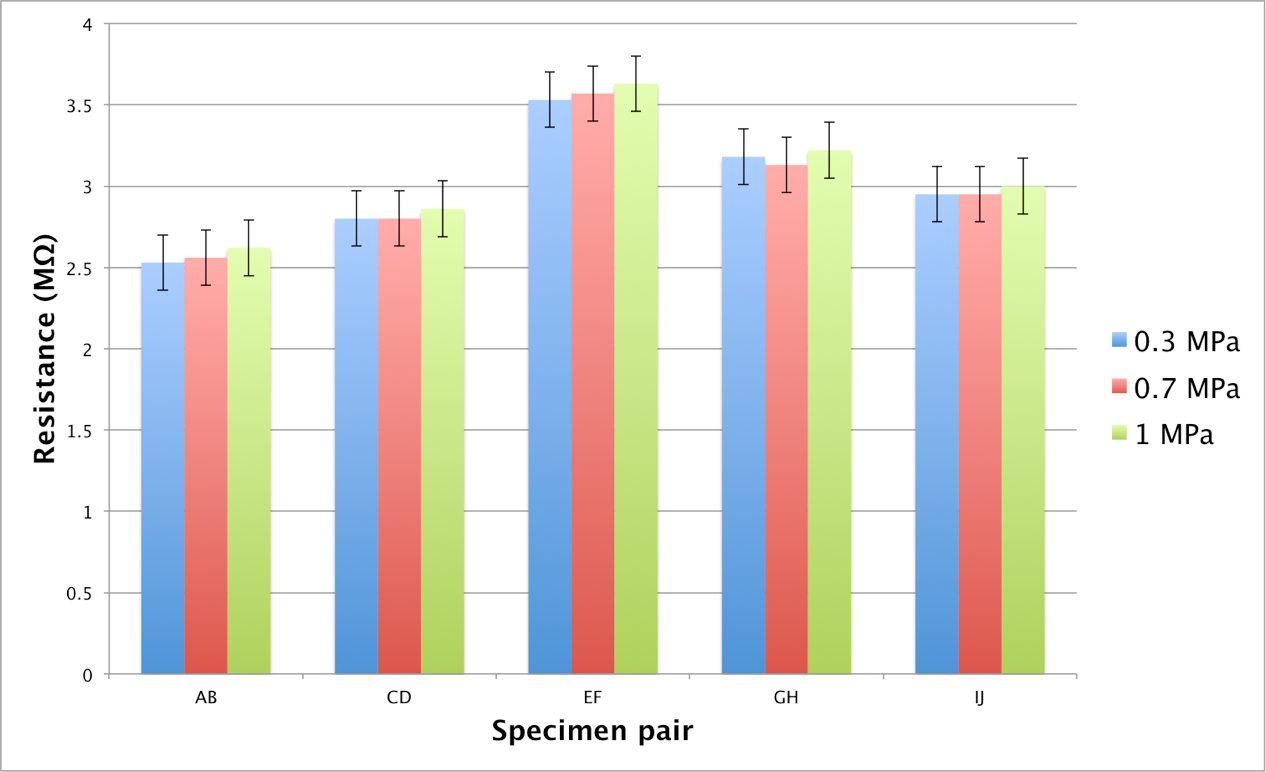
Fig. 5. Colored columns showing the resistance at different pre-stress forces for the small glulam specimens, and the bars show the standard error.
Result of Test II (Specimens without glue)
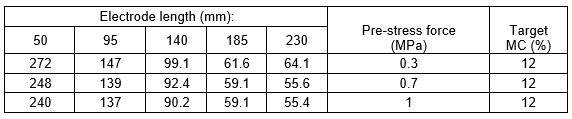
The solid wood specimens also showed that the measured resistance decreased with increasing electrode length (Table 2), which was the same behavior shown for the specimens with glue lines. This pointed to the length of the electrodes rather than the number of glue lines as being the predominant reason for the decrease in resistance.
Table 2. Measured Resistance in MΩ for Specimens without Glue
Results of Test III (Long specimens)
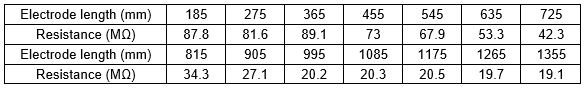
The measurements are presented in Table 3.The resistance measurements plateaued around an electrode length of 1000 mm. The measured value at 365 mm was an outlier and could be a measurement error.
Table 3. Resistance Measurements for the Long Glulam Specimens
Result of Test IV (Resistance temperature)
The resistance showed a logarithmic increase with decreasing temperature (Fig. 6). There was a steep increase in resistance around -5 °C and resistance measurements below -10 °C were out of the measurement range of the resistance tester. Thus it is suggested that measurements only be taken at timber temperatures over -5 °C.
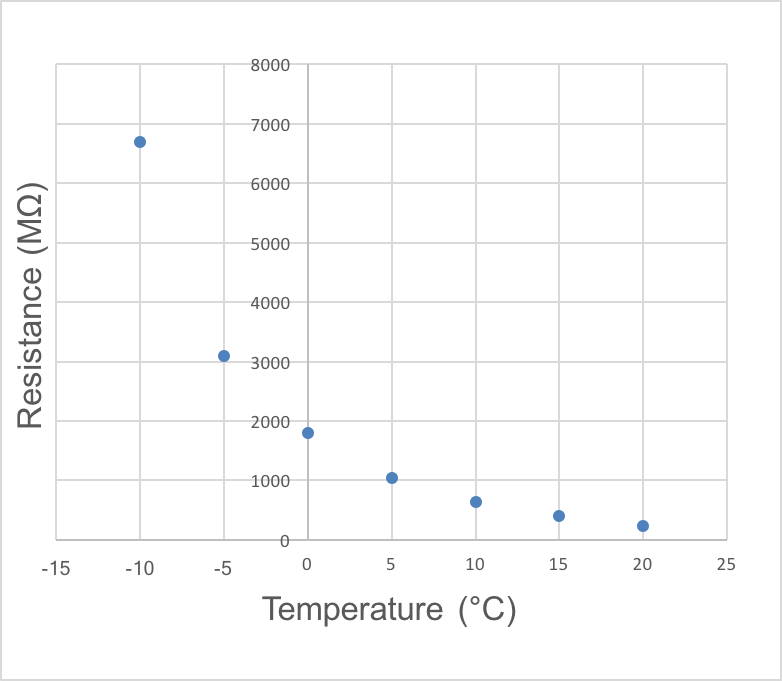
Fig. 6. Resistance versus temperature at 12% MC
Modeling
The experimental data were used to create a model predicting the MC in a bridge deck based on the measurement depth (electrode length) and the measured resistance and temperature. The glulam specimens were oven-dried to determine the MC for each test and each conditioning. The logarithm of the resistance values was used to perform a linear regression, where the MC was a function of the log-transformed resistance value as follows,
u = a+b(log R) (1)
where u is the MC, a and b are constants, and log R is the logarithmic value of the resistance. The effect of temperature on the measurements was calibrated by adjusting the acquired resistance values along the temperature curve calculated from Test III. The calibrated resistance value is given by linear interpolation of the resistance as a function of temperature, where T20 is the room temperature, Tx is the temperature during the measurement, and Rx is the measured resistance (Eq. 2).
logR = b(T20–Tx)+logRx (2)
Two models were created, one for an electrode depth of 50 mm from the underside, and the other for measuring 50 mm below the deck. The model for temperature-adjusted resistance is shown in Eq. 3,
RT-adjusted = 10-0.0468*(20-T)+Log(Rx)) (3)
where R is the measured resistance and T is the measured temperature. The actual MC is given by Eq. 4.
MCshort = 24.209*(RT-adjusted-0.124) (4)
To model the MC at longer electrode lengths, data from the 230 mm-long electrodes in Test I were used (Eq. 5).,
MClong = 18.92*(RT-adjusted-0.114) (5)
To adjust the model for decks thicker than 230 mm, data from Test III were used to model the electrode length dependency, as shown in Eq. 6.
logRL-adjusted = -0.0007*L+logRT-adjusted (6)
In Table 4, the MC predicted by the model for a measurement depth of 50 mm (Eq. 4) is tabulated against the oven-dry MC. For MC values under FSP, the difference was no greater than 1%. Over FSP, the error was over 2%. Table 5 shows the MC predicted by the model for a measurement depth of 230 mm (Eq. 5) tabulated against the oven-dry MC. For values under FSP, the difference between predicted values and oven-dry MC was no greater than 6%. For values around FSP, the model underestimated the MC. However, resistance measurements over FSP correlated badly to MC (James 1963) and should only be considered as “over FSP”.
The model for the 230-mm measurement depth (Eq. 5) was applied to the large specimens used in Test III, and Eq. 6 was used to compensate for the longer electrode length. In Fig. 7 the predicted MC of the model is plotted against the oven dry MC. The model differed by up to four percentage points for the longest electrodes. For electrodes that were no longer than 900 mm the difference between the model and oven dry MC was up to two percentage points.
Table 4. Comparison of Predicted MC with the Oven-Dry MC for Model MCshort.The electrode length was 50 mm for all measurements.
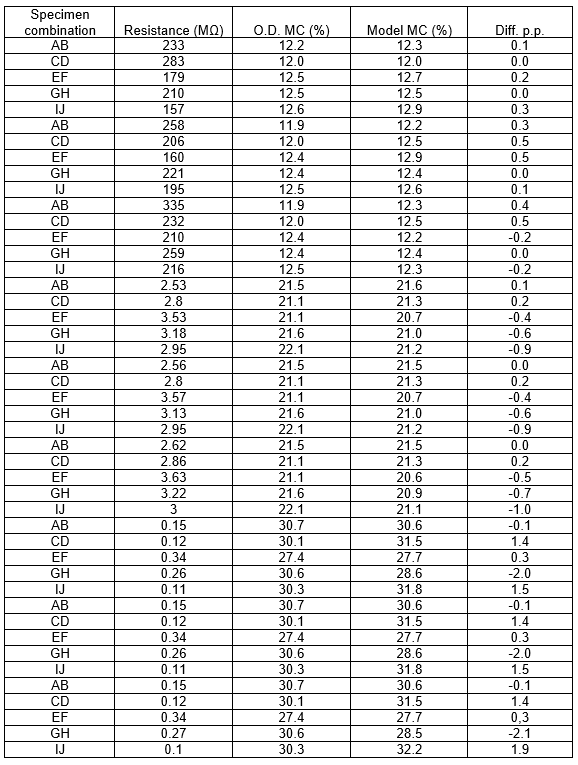
Table 5. Comparison of Predicted MC with the Oven-Dry MC for the Model MClong. *
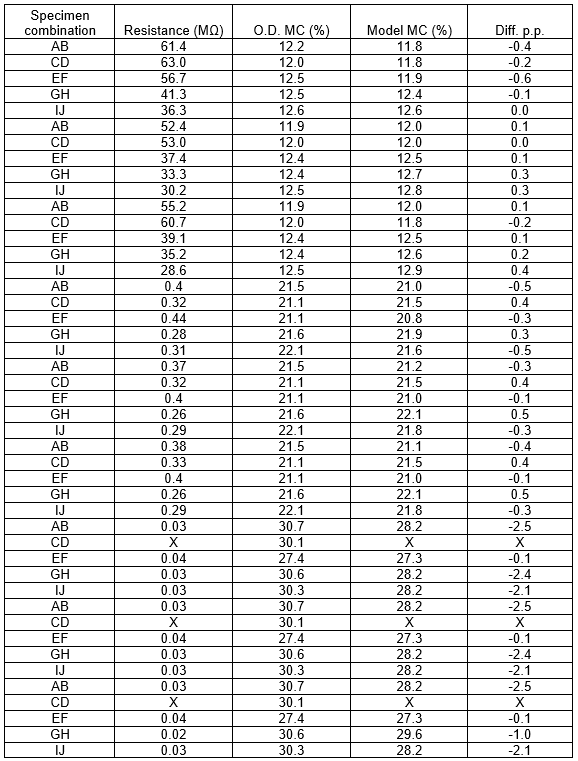
* Notes: X denotes a value that the resistance meter could not measure.
The electrode length was 230 mm for all measurements.
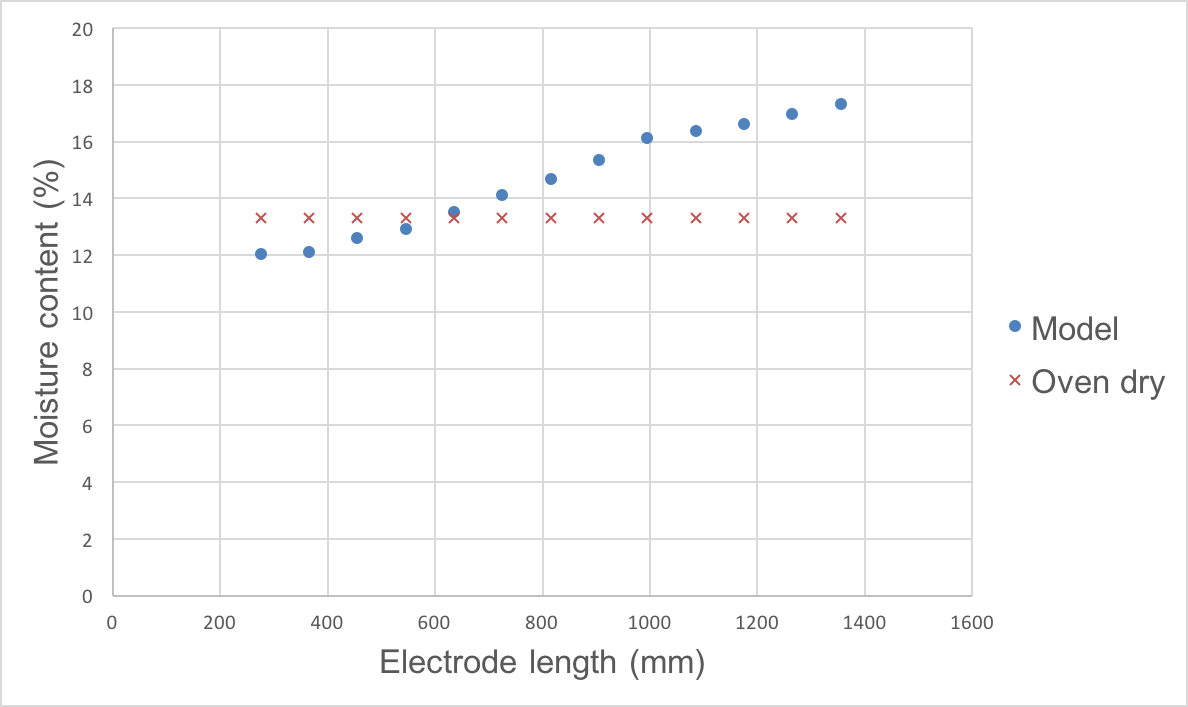
Fig. 7. Comparison of Predicted MC with the Oven dry MC for long electrodes.
CONCLUSIONS
- The presented model for measuring the MC of timber bridges using electrodes at the height of the cross-section could be a highly useful as a method of monitoring timber bridges, offering better MC monitoring possibilities than conventional sensors. The system is robust, cheap, and uses off-the-shelf components.
- For MC values under FSP and electrode lengths up to 905 mm, the model and actual MC differed by no more than 2 percentage points. For electrode lengths up to 635 mm the model and actual MC differed no more than 1.5 percentage points. This is similar to results reported for hand-held resistance meters (Forsén and Tarvainen 2000). For electrodes between 905 and 1355 mm the model had an error between 2 to 4 percentage points, which is to uncertain and must be further studied.
- The resistance measured was highly dependent on the length of the electrodes. To achieve correct measurements at both top and bottom, two models must be used, one that is calibrated for short electrode lengths (0 to 50 mm) and another that is calibrated for long electrodes (up to 1355 mm).
- The sensor can only find the highest MC along the length of the electrode, so for thick bridge decks it might be necessary to make use of several electrode lengths to know where along the cross-section the increased MC is located.
- The pre-stressing force does not affect the model, so this system could be used in any solid wood construction where MC monitoring is of interest.
- This research was performed on Norway spruce, and the findings might not be transferable to other species without calibration.
- The system has been mounted during production on a couple of timber bridges and retrofitted on one bridge.
ACKNOWLEDGMENTS
Financial support from the Swedish Research Council Formas, Project Experimental Studies of Capillary Phenomena in Bio-based Materials 942-2016-64, is gratefully acknowledged.
REFERENCES CITED
Bengtsson, C. (2000). “Stiffness of spruce wood – Influence of moisture conditions,” Holz als Roh-und Werkstoff 58(5), 344-352. DOI:10.1007/s001070050443
Björngrim, N., Hagman, O., and Wang, X. A. (2016). “Moisture content monitoring of a timber footbridge,” BioResources 11(2), 3904-3913. DOI: 10.15376/biores.11.2.3904-3913
Dietsch, P., Franke, S., Franke, B., Gamper, A., and Winter, S. (2015). “Methods to determine wood moisture content and their applicability in monitoring concepts,” Journal of Civil Structural Health Monitoring 5(2), 115-127. DOI: 10.1007/s13349-014-0082-7
Dyken, T., and Kepp, H. (2010). “Monitoring the moisture content of timber bridges,” in: Proceedings of the International Conference on Timber Bridges, Lillehammer, Norway, pp. 223-236.
Forsén, H., and Tarvainen, V. (2000). Accuracy and Functionality of Handheld Wood Moisture Content Meters, Technical Research Centre of Finland, Espoo, Finland.
James, W. L. (1963). Electric Moisture Meters for Wood (Vol. 8), U.S. Department of Agriculture, Forest Products Laboratory, Madison, WI.
Pousette, A., and Fjellström, P. A. (2016). Experiences from timber bridge inspections in Sweden–examples of influence of moisture. SP Rapport, ISSN 0284-5172 ; 2016:45
Stamm, A. J. (1927). “The electrical resistance of wood as a measure of its moisture content,” Industrial & Engineering Chemistry 19(9), 1021-1025.
Tannert, T., Müller, A., and Vogel, M. (2010). “Structural health monitoring of timber bridges,” in: Proceedings of the International Conference on Timber Bridges, Lillehammer, Norway, pp. 205-212.
Article submitted: December 6, 2016; Peer review completed: February 5, 2017; Revised version received: March 20, 2017; Accepted: March 21, 2017; Published: March 28, 2017.
DOI: 10.15376/biores.12.2.3570-3582