
Abstract
As an adsorbent of metal ions, activated carbon is often used to purify sewage. However, activated carbon fibres typically show similar adsorption capacity for different metal ions. Salix psammophila fibre (Spsf) was used as raw material to prepare activated carbon fibres (SP-FAC). This was modified with nitric acid (HNO3) to obtain HNO3-SP-FAC (FACHNO3). At 65 wt% concentration of HNO3, the impregnation ratio was 1:35 during 12 h, at 100 °C drying temperature, and the adsorption effect of FACHNO3 on Pb(II) was the best. At CHNO3 = 75 wt%, the impregnation ratio was 1:25. After an impregnation time of 36 h at the same drying temperature, the effect of FACHNO3 on Mn(II) was the best. At CHNO3 = 55 wt%, the impregnation ratio was 1:35, impregnation time was 36 h at 120 °C drying temperature, and the adsorption effect of FACHNO3 on Zn(II) was the best. These results indicate the existence of a close relationship between the pore structure of activated carbon fibres and the adsorption capacity of metal ions, and that the control variables changed the pore structure of activated carbon fibres so that it can achieve a competitive adsorption effect for different ions.
Download PDF
Full Article
Selective Adsorption of Metal Ions on Salix psammophila Fibre Activated Carbon
Duoyu Wang,a,b,# Xin Wang,a,b,* Yang Wang,a,b,# and Xi Wang a,b
As an adsorbent of metal ions, activated carbon is often used to purify sewage. However, activated carbon fibres typically show similar adsorption capacity for different metal ions. Salix psammophila fibre (Spsf) was used as raw material to prepare activated carbon fibres (SP-FAC). This was modified with nitric acid (HNO3) to obtain HNO3-SP-FAC (FACHNO3). At 65 wt% concentration of HNO3, the impregnation ratio was 1:35 during 12 h, at 100 °C drying temperature, and the adsorption effect of FACHNO3 on Pb(II) was the best. At CHNO3 = 75 wt%, the impregnation ratio was 1:25. After an impregnation time of 36 h at the same drying temperature, the effect of FACHNO3 on Mn(II) was the best. At CHNO3 = 55 wt%, the impregnation ratio was 1:35, impregnation time was 36 h at 120 °C drying temperature, and the adsorption effect of FACHNO3 on Zn(II) was the best. These results indicate the existence of a close relationship between the pore structure of activated carbon fibres and the adsorption capacity of metal ions, and that the control variables changed the pore structure of activated carbon fibres so that it can achieve a competitive adsorption effect for different ions.
DOI: 10.15376/biores.17.3.4410-4431
Keywords: Sandy shrub; Activated Carbon Fibres; Selective adsorption; HNO3 modification; Heavy metal ions
Contact information: a: College of Materials Science and Art Design, Inner Mongolia Agricultural University, 306 Zhaowuda Road, Hohhot 010018 China; b: Inner Mongolia Key Laboratory of Fibrotic and Energy Development and Utilization of Sandy Shrub Resource, Hohhot 010018 China;
# These authors contributed equally to this work; *Corresponding author: wangxin2930@163.com
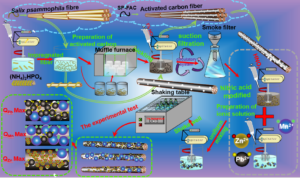
GRAPHICAL ABSTRACT
INTRODUCTION
Commonly used wastewater treatment methods include chemical precipitation, ion exchange, membrane filtration, and adsorption through porous material. Porous materials have the potential to provide an obvious adsorption effect, low price, and environmental protection (Chen et al. 2011; Fu and Wang 2011; Gupta et al. 2012). Activated carbon is widely used in wastewater treatment as a porous material. It is usually used to adsorb metal ions in sewage. Activated carbon can be classified into powder, granular, and fibrous forms. Powdered activated carbon can quickly remove impurities, but it often floats above the liquid level. In addition, this form of activated carbon is difficult to recover, which can lead to secondary pollution (Liu et al. 2011). Meanwhile, with granular activated carbon, the metal ions attach mainly to its surface, which is called monolayer adsorption, resulting in a poor adsorption effect (Hete et al. 2012; Loganathan et al. 2018; Jjagwe et al. 2021). Fibrous activated carbon often exhibits the best performance and fastest adsorption rate among the three forms. The impurities in the water can be easily adsorbed on the inside of the activated carbon; thus, the fibrous activated carbon exhibits strong adsorption capacity (Phan et al. 2006).
However, most activated carbon materials absorb mixed ions present in sewage, and the inability to make a selection leads to a decrease in the secondary utilization of metal ions (Seco et al. 1997; Luo et al. 2015). Conventional activated carbon is unable to selectively adsorb mixed metal ions (Marzal et al. 1996; Srivastava et al. 2008; Uchimiya et al. 2010). In principle, the selective adsorption of activated carbon can be achieved in two ways. Firstly, it is necessary to use raw materials with larger specific surface area to prepare activated carbon, because this raw material can obtain activated carbon with excellent adsorption capacity and lay a foundation for the adsorption of metal ions. Among them, Salix psammophila fibre (Spsf) exhibits large specific surface area, high activity, and softness, and has more pore structure than most wood. It is a natural porous material commonly used as a base material for activated carbon (Li et al. 2014). Therefore, it is used to prepare activated carbon and used to improve the capacity of sewage treatment (Liu and Lang 2020). Secondly, by changing the adsorption capacities of adsorbents for different metal ions to achieve optimal selective adsorption effect, the sustainable development of resources is important (Kuroki et al. 2019). Wang et al. (2017) used HCl to change the pore structure of activated carbon, the results showed that in the mixed solution of Cu(Ⅱ) and Cd(Ⅱ), activated carbon preferentially adsorbed Cu(Ⅱ), indicating that selective adsorption can be achieved by changing the pore structure of activated carbon. Changing the pore structure of activated carbon by modifying it with nitric acid can effectively adjust the adsorption capacities of metal ions (Gokce and Aktas 2014; Ge et al. 2014; Li et al. 2019).
Ghosh (2009) modified activated carbon with H2SO4 and HNO3. Under the same conditions, the modification effect of HNO3 was more evident, which yielded 10.93 mg/g maximum adsorption capacity of activated carbon to metal ions. However, the adsorption capacity needs to be further improved. Choma et al. (1999) modified activated carbon with different concentrations of hydrogen oxide, perchloric acid, and nitric acid solutions. The results showed that nitric acid changed the pore structure of activated carbon most significantly. Qu et al. (2012) modified activated carbon fibre with nitric acid and hydrogen peroxide solutions of various concentrations. The results showed that the modification by nitric acid improved the adsorption capacity of activated carbon to metal ions. A comparison of different modifiers indicated that HNO3 exhibited the most evident change effect on the pore structure. However, the adsorption effect of activated carbon on metal ions needs to be further improved. Zhang et al. (2013) modified activated carbon by controlling the HNO3 concentration to change its surface chemical properties, increase acidic functional groups, and enhance the adsorption capacity. Li et al. (2018b) used nitric acid to modify activated carbon fibre and found that the adsorption process of modified activated carbon is a spontaneous endothermic process with excellent adsorption capacity. Oter et al. (2021) modified activated carbon by HNO3. The results showed that HNO3 modification can adjust the adsorption rates of Th(IV) and U(VI) ions and yield adsorption capacities of QTh = 37.60 mg/g and QU =18.38 mg/g, respectively. Saputro et al. (2019) found that after acid modification of activated carbon, the adsorption capacity of Pb(Ⅱ) was significantly increased, and the Pb(Ⅱ) present in the waste was effectively removed. Ucer et al. (2006) studied the adsorption capacity of nitric acid-modified activated carbon for various metal ions and found that the adsorption capacity of Mn(Ⅱ) was QMn = 1.11 mg/g. Considerable research has shown that nitric acid can increase the adsorption capacity of activated carbon. However, the adsorption capacity of mixed ions was average. Therefore, it is necessary to study the relationship between nitric acid and pore structure to achieve the selective adsorption of mixed metal ions by activated carbon.
In this study, Spsf activated carbon fibres (SP-FAC) were modified with HNO3 to selectively adsorb Pb(Ⅱ), Mn(Ⅱ), and Zn(Ⅱ) plasma in sewage, thus facilitating the removal of useless metals and recycling of useful metals. Through controlling factors, such as CHNO3, impregnation ratio, impregnation time, and drying temperature, and adjusting the pore structure, the relationship between the adsorption capacities of different metal ions and the pore structure of activated carbon fibres was determined. In addition, the optimal process for activated carbon fibres modification was identified, and a new route for metal resource recycling was developed.
EXPERIMENTAL
Materials and Reagents
Salix psammophila (Sps) was purchased from Ordos, China. All the water used in the experiment was distilled water, which was prepared in the laboratory of Inner Mongolia Agricultural University. All reagents used were of analytical grade. The materials include: potassium pyrophosphate trihydrate from Zhengzhou Paini Chemical Reagent Factory (Henan, China), potassium bromide from Shandong Lvying Chemical Technology Co., Ltd. (Shandong, China), zinc oxide reference and anhydrous sodium acetate from Dezhou Runxin Experimental Instrument Co., Ltd. (Shandong, China), lead nitrate and hexamethylenetetramine from Hunan Hanhua Chemical Co., Ltd. (Hunan, China), manganese chloride from Shanghai Zhanyun Chemical Co., Ltd. (Shanghai, China), and hydrochloric acid, concentrated nitric acid, and concentrated sulfuric acid from Maoming Xiongda Chemical Co., Ltd. (Guangdong, China). The zirconium hydrogen phosphate, potassium periodate, glacial acetic acid, xylenol orange, sodium hydroxide, and anhydrous ethanol were purchased from Shanghai McLean Biochemical Technology Co., Ltd. (Shanghai, China) and used as received.
Methods
Preparation of SP-FAC
5g Spsf was impregnated into 35% (NH4)2HPO4 solution in the 1:3.5 impregnation ratio (the ratio of Spsf mass to (NH4)2HPO4 solution mass, W/W) within a 12 h impregnation time. The impregnated Spsf was placed in a muffle furnace and carbonized at 200 °C for 60 min under 0.02 MPa vacuum, followed by activation at 800 °C for 60 min. After the reaction, the fibre was cooled to room temperature. The products were gathered and soaked in 5% hydrochloric acid solution for 1.0 h to remove the ash and metal ions generated during the activation process. Then, the solution was washed with distilled water to make it neutral, and then filtered and dried to obtain SP-FAC.
Preparation of FACHNO3
Various impregnation ratios (1:25, 1:30, and 1:35), HNO3 concentrations (55%, 65%, and 75%), impregnation times (12 h, 24 h, and 36 h), and drying temperatures (80 °C, 100 °C, and 120 °C) were set for the activated carbon fibres prepared under the process conditions, as shown in Table 1. First, 1.0 g of activated carbon fibres was added to a beaker, to which the required amount of HNO3 was added, and the mixture was stirred using a magnetic mixer for 15 min. The sample was immersed for a fixed period and then washed with distilled water repeatedly until the solution became neutral. The impurities were removed using a vacuum filter, dried in an oven for 6 h, and the activated carbon fibres thus obtained was stored for later use.
Table 1. Orthogonal Experimental Design Table

Testing of adsorption properties of Pb(Ⅱ), Mn(Ⅱ), and Zn(Ⅱ) by FACHNO3
The samples were prepared with standard solutions of 50 mL Pb(Ⅱ), Mn(Ⅱ), and Zn(Ⅱ) in various iodine bottles, and the pH value was adjusted to 4; then, 0.1 g of FACHNO3 was added to the solution, which was placed in a constant-temperature water bath oscillator. The temperature was set at 40 °C and the speed was set at 120 rpm. After the reaction, the mixture was repeatedly filtered with filter paper until there was no solid residue in the filtrate, and the absorbance of the filtrate was measured.
The FACHNO3 adsorption of Pb(Ⅱ): To a certain amount of filtrate, hexamethylene-tetramine solution and dimethyl phenol orange solution were added in a 50-mL volumetric flask. The absorbance at 575 nm after a period of color development was measured. Then, a standard curve was prepared and the adsorption capacity was calculated.
FACHNO3 adsorption of Mn(Ⅱ): To a certain amount of filtrate, potassium pyrophosphate–sodium acetate solution and potassium periodate solution were added in a 50-mL volumetric flask, and the absorbance at 525 nm was measured. Then, a standard curve was drawn and the adsorption capacity was determined.
FACHNO3 adsorption of Zn(Ⅱ): To a certain amount of filtrate, acetic acid–sodium acetate solution and dimethyl phenol orange solution were added in a 50-mL volumetric flask and the absorbance at 570 nm was measured after a period of color development. Then, a standard curve was drawn and the adsorption capacity was calculated.
The adsorption quantity (Q) can be obtained using Eq. 1,
 (1)
(1)
where Q is the adsorption capacity (mg/g), C0 is the initial concentration of the metal ion solution (mg/L), C1 is its residual concentration after adsorption, m is the amount of FACHNO3 added (g), and V is the volume of the solution (L).
The adsorption capacity of activated carbon fibres was tested according to the GB/T standards 12496.22 (1999) and 12496.13 (1990). The specific surface area and pore structure were tested according to the GB/T standards 7702.21 (1997b) and 7702.20 (1997a), respectively. The concentrations of metal ions before and after adsorption were evaluated according to the GB/T standard 26798 (2011), and the adsorption capacity was calculated.
Specific surface area and pore size (BET) analysis
The specific surface area and pore size were used to test the SP-FAC, FACHNO3, and the adsorbed samples. The specific surface area and pore size of samples were measured by BET (ASAP-2460, Micromeritics Instruments Corporation, Norcross, GA, USA) tests were determined on the samples treated in nitrogen and helium environments (test range 2 nm to 200 nm) to obtain pore structure data. Each sample was tested three times and the results were averaged.
Fourier transform-infrared spectroscopy (FT-IR) analysis
First, the sample was mixed with potassium bromide and ground to a uniform powder. Secondly, the KBr tablet was obtained by pressing 1.0 min on the pressure table. Finally, the FT-IR (Nicolet-6700, Thermo Fisher Scientific, Waltham, MA, USA) spectrum was recorded. The changes in the functional groups of the samples were analysed by comparing the peaks of the spectra.
X-ray diffraction (XRD) analysis
The test tray was filled with the sample and placed in an XRD analyser (X-pert Pro, Malvern Panalytical B.V., Almelo, Netherlands) for testing. The diffraction range of the XRD analyser was 5° to 90° and the scanning speed used was 2 days/min. The XRD pattern was obtained, and the crystal structure of the sample was analyzed, to follow the structural changes.
Field emission-scanning electron microscopy (SEM) and spectroscopy (EDS) analyses
The surface morphology and elemental changes of activated carbon fibers were analyzed by field emission-scanning electron microscopy (S-4800, Hitachi, Ltd., Tokyo, Japan) and energy-dispersive spectroscopy (S-4800, Hitachi, Ltd., Tokyo, Japan). Because SEM and EDS are tested on different computer terminals in the same sample table, it is necessary to observe the images of computers equipped with SEM and DES analysis software at the same time during each sample test. Among them, each sample was tested three times, and the image with the best effect was taken as the result analysis. The sample was subjected to vacuum spraying treatment with gold (99.99%, Li Jisheng New Materials Co., Ltd., Shijiazhuang, Hebei, China) (samples must be repeatedly treated), and tested after the treatment. Firstly, the morphology of activated carbon fiber was analyzed by SEM. Secondly, EDS tests were carried out on the samples collected at the same location to analyze the chemical composition of the samples.
RESULTS
Effects of Various Process Conditions on the Adsorption Capacities of Pb(II), Mn(II), and Zn(II) Ions
The initial concentrations of Pb(II), Mn(II), and Zn(II) were set at 300 mg/L, and their absorbance capacities were measured by adding these solutions to activated carbon fibres for a fixed period. As shown in Fig. 1, a standard curve was obtained to calculate the adsorption capacities of heavy metal ions on activated carbon fibres according to Eq. 1. As shown in Figs. 1a and 1b, the test results conformed to a normal distribution.


Fig. 1. Effects of different processes on the adsorption capacities of Pb(II), Mn(II), and Zn(II) ions (a, c, e: standard curves of Pb(II), Mn(II), and Zn(II) ions, respectively; b, d, f: Adsorption distribution histogram of Pb(II), Mn(II), Zn(II) ions)
The adsorption capacity of FACHNO3 in tests 1 to 6 for Pb(II) increased rapidly, the adsorption capacities of tests 6 to 9 for Pb(II) decreased slowly, and the adsorption capacity of FACHNO3 6 for was the highest (QPb = 85.46 mg/g). At this point, the histogram distribution frequency was 0.16, reaching the peak value, which verifies the correctness of the test results. As shown in Figs. 1c and 1d, the adsorption capacity of Mn(II) in FACHNO3 tests 1 to 7 increased rapidly, and the adsorption capacity of Mn(II) on tests 7 to 9 decreased slowly. At this time, the distribution frequency of the histogram was 0.17, and it reached the peak value, indicating that the adsorption of FACHNO3 test 7 was the largest (QMn = 92.32 mg/g). As shown in Figs. 1e and 1f, the adsorption capacity of FACHNO3 tests 1 to 3 on Zn(II) increased rapidly, and that of FACHNO3 tests 3 to 9 on Zn(II) decreased rapidly. At this time, the distribution frequency of the histogram was 0.17 and it reached the peak value, indicating that of FACHNO3 test 3 on Zn(II) was the highest (QZn = 59.93 mg/g). There are two reasons for this phenomenon. First, the change of nitric acid concentration, impregnation ratio, impregnation time, drying temperature and other technological conditions led to the reaction between SP-FAC and HNO3, which changes the pore structure of activated carbon fiber. The measurement of pore structure includes specific surface area, outer surface pore radius, inner pore radius, and pore volume, which all change with the change of relative pressure (P/P0) to varying degrees, which is a manifestation of the change of pore structure. Secondly, it was concluded by adsorption tests that the pore sizes of different ions were different. The maximum pore diameters of Pb(II), Mn(II), and Zn(II) were 1.00 to 1.15 nm, 1.10 to 1.38 nm, and 0.56 to 1.00 nm, respectively, which indicated that under different technological conditions, the adsorption capacity of FACHNO3 to metal ions was different. The selective adsorption was realized by changing the technological conditions, and the pore structure was closely related to the technological conditions. Therefore, it can be concluded that the technological conditions of nitric acid modified activated carbon fiber had significant influence on the adsorption of metal ions, and it is necessary to discuss the influence of four technological conditions on the pore structure of activated carbon. The detailed results are analyzed in the following section.
Through controlling the modification process using HNO3, FACHNO3 test 6 exhibited the best adsorption effect on Pb(Ⅱ), FACHNO3 7 exhibited the best effect on Mn(Ⅱ), and FACHNO3 3 exhibited the best adsorption effect on Zn(Ⅱ) ions.
Effects of HNO3 Concentrations on Pb(II), Mn(II), and Zn(II) Ions Adsorption Capacities
Figures 2a and 2b show that the outer surface pore radius of FACHNO3 decreased with increasing HNO3 concentrations (SP-FAC were used as the blank control group). The pore radius of Spsf itself was larger, while the outer surface pore radius of FAC was smaller than that of Spsf because the activator corroded many small pores on its surface, and most of the large porous structure of Spsf was destroyed after high-temperature carbonization. When HNO3 was added to FAC, HNO3 corroded the surface of activated carbon fibres to form more micropores; when CHNO3 = 55 wt% and CHNO3 = 65 wt%, the increase in the pore pore radius, r, was not evident. When CHNO3 = 75 wt%, the increase in the SP-FAC radius, R, was evident. This is because part of the HNO3 solution entered the pore and increased its radius; the specific surface area first increased and then decreased with increasing HNO3 concentration. At CHNO3 = 0 to 65 wt%, the exact surface area continued to increase; at CHNO3 = 75 wt%, the specific surface area decreased rapidly. This is because, with an increase in HNO3 concentration, more micropores were formed on the FAC surface, and the specific surface area increased. Nitric acid caused the pores of the FAC surface to collapse, reducing the specific surface area; with an increase in HNO3 concentration, the pore volume first increased and then decreased, while the pore radius first decreased and then increased. Combined with the specific surface area, the rate of change of the specific surface area was much higher than that of the pore radius; thus, the change trends of the pore volume and specific surface area were consistent. In addition, P/P0 first decreased and then increased with an increase in HNO3 concentration, because P/P0 increased with the smaller pore volume, and vice versa.
Figure 2c shows that the adsorption capacity of FACHNO3 on Pb(II) increased first and then decreased with increasing CHNO3. The adsorption capacity reached the maximum when CHNO3 was 65 wt%, QPb = 85.46 mg/g, indicating that FACHNO3 selectively adsorbed Pb(II) at this time. The adsorption capacity of FACHNO3 on Mn(II) increased with the increase of CHNO3, but at CHNO3 = 55 wt%, the adsorption capacity of FAC decreased slightly compared to that without any added HNO3. This was attributed to the fact that HNO3 destroyed the original pore structure of FAC, reducing the pore size suitable for the Mn(II) ion. At CHNO3 = 75 wt%, the adsorption capacity reached the highest, QMn = 92.32 mg/g, indicating that FACHNO3 selectively adsorbed Mn(II). The adsorption capacity of Zn(II) first increased and then decreased with an increase in CHNO3. At CHNO3 = 55 wt%, the adsorption capacity reached the maximum, QZn = 59.93 mg/g, indicating that FACHNO3 selectively adsorbed Zn(II) at this time. The results show that selective adsorption of FACHNO3 on different metals can be achieved by controlling CHNO3.
In summary, when CHNO3 is controlled, the adsorption capacity of FACHNO3 for heavy metal ions is positively correlated with the outer surface pore radius, specific surface area, pore volume, and P/P0, and it is negatively correlated with the inner pore radius. Thus, the selective adsorptions of Pb(Ⅱ), Mn(Ⅱ), and Zn(Ⅱ) by FACHNO3 can be realized by controlling the concentration of HNO3.


Fig. 2. Correlations among nitric acid concentration, pore structure, and adsorption capacity; a: effects of CHNO3 on outer surface pore radius, inner pore radius, and specific surface area; b: effects of CHNO3 on pore volume and P/P0; and c: effects of CHNO3 on the adsorption capacities of Pb(II), Mn(II), and Zn(II) ions
Effect of Immersion Ratio on the Adsorption Capacities of Pb(II), Mn(II), and Zn(II) Ions
As shown in Figs. 3a and 3b, the outer surface pore radius, inner pore radius, and P/P0 of FACHNO3 decreased with an increase in the HNO3 impregnation ratio. This was because the higher impregnation ratios of SP-FAC and HNO3 resulted in a better corrosion effect on the surface of activated carbon fibres and more micropores were generated. The number of micropores was much larger than the number of medium pores, making the outer surface pore radius smaller; the specific surface area and pore volume increased with the impregnation ratio, and the specific surface area and total pore volume increased with the porosity of micropores. The pore radius of SP-FAC was smaller than that of FACHNO3 when the impregnation ratio was 1:25. This was because HNO3 caused the formation of many micropores on SP-FAC and increased the outer surface pore radius of FACHNO3; P/P0 was positively correlated with the pore radius. Therefore, it is consistent with the upward and downward trends of the pore radius.


Fig. 3. Correlations among impregnation ratio, pore structure, and adsorption capacity (a: influence of impregnation ratio on outer surface pore radius, inner pore radius, and specific surface area; b: influence of impregnation ratio on pore volume and P/P0; and c: effect of impregnation ratio on the adsorption capacities of Pb(II), Mn(II), and Zn(II) ions)
As shown in Fig. 3c, the adsorption capacities of Pb(Ⅱ) and Zn(Ⅱ) by FACHNO3 increased with the impregnation ratio and reached the maximum at an impregnation ratio of 1:35. The adsorption capacity of Mn(Ⅱ) decreased with the increase in the impregnation ratio and reached the maximum when the impregnation ratio was 1:25. The adsorption capacity of Mn(Ⅱ) by SP-FAC was higher than that by Spsf because more pores were formed on the surface of Spsf at high temperature, and the adsorption capacity of Mn(Ⅱ) by FACHNO3 increased by adding considerable HNO3 to activated carbon fibres. Therefore, the best impregnation ratio of Pb(Ⅱ) and Zn(Ⅱ) was 1:35 and that of Mn(Ⅱ) was 1:25.
In conclusion, when the impregnation ratio is controlled, the adsorption capacity of FACHNO3 for heavy metal ions is positively correlated with the specific surface area and pore volume, and negatively correlated with the outer surface pore radius, inner pore radius, and P/P0. Thus, the selective adsorption capacities of Pb(Ⅱ), Mn(Ⅱ), and Zn(Ⅱ) by FACHNO3 can be realized by controlling the impregnation ratio.
Effect of Impregnation Time on Adsorption Capacities of Pb(II), Mn(II), and Zn(II) Ions
Figures 4a and 4b show that the outer surface pore radius, intracellular radius, and P/P0 of FACHNO3 decreased with increasing HNO3 immersion time, which was the same as the effect of immersion ratio. A longer immersion time resulted in a better corrosion effect on the SP-FAC surface and more micropores formed; the specific surface area and pore volume increased with the impregnation time. The reasons for the decrease in r and P/P0 of SP-FAC are in line with those shown in Figs. 3a and 3b.


Fig. 4. Relationships among impregnation time, pore structure, and adsorption capacity (a: effect of impregnation time on outer surface pore radius, inner pore radius, and specific surface area; b: effect of impregnation time on pore volume and P/P0; and c: effect of impregnation time on the adsorption capacities of Pb(II), Mn(II), and Zn(II) ions)
Figure 4c shows that the adsorption capacities of Mn(II) and Zn(II) by FACHNO3 increased with the immersion time and reached the maximum at the immersion time of 36 h; the adsorption capacity of Pb(II) decreased first and then increased with the increase of immersion time. The maximum was reached at 12 h. Therefore, the best impregnation time of Mn(II) and Zn(II) was 36 h and that of Pb(II) was 12 h.
In conclusion, when the impregnation time is controlled, the adsorption capacity of FACHNO3 for heavy metal ions was positively correlated with the specific surface area and pore volume, and it was negatively correlated to the outer surface pore radius, inner pore radius, and P/P0. Thus, the selective adsorptions of Pb(II), Mn(II), and Zn(II) by FACHNO3 can be realized by controlling the impregnation time.
Effect of Drying Temperature on Adsorption Capacities of Pb (II), Mn (II), and Zn (II)
Figures 5a and 5b show that the outer surface pore radius, inner pore radius, and P/P0 of FACHNO3 decreased with the increase in drying temperature. This is because the reaction rate was accelerated with the increase in temperature, and many micropores were rapidly generated within a short time. The number of micropores was much larger than the number of medium pores; thus, the outer surface pore radius was reduced. The specific surface area and pore volume increased with the drying temperature.


Fig. 5. Relationships among drying temperature, pore structure, and adsorption capacity (a: effects of drying temperature on outer surface pore radius, inner pore radius, and specific surface area; b: effects of drying temperature on pore volume and P/P0; and c: effects of drying temperature on the adsorption capacities of Pb(II), Mn(II), and Zn(II) ions)
Figure 4a shows that the adsorption capacity of FACHNO3 on Zn(Ⅱ) increased with the drying temperature and reached the maximum when the drying temperature was 120 °C. As the drying temperature increased, the adsorption capacities of Pb(Ⅱ) and Mn(Ⅱ) ions increased first and then decreased, and reached the maximum at 100 °C. Therefore, the optimum drying temperature for Zn(Ⅱ) was at 120 °C and that for Pb(Ⅱ) and Mn(Ⅱ) was at 100 °C.
In summary, when the drying temperature is varied, the adsorption capacity of FACHNO3 for heavy metal ions was positively correlated with specific surface area and pore volume, and it was negatively correlated with the outer surface pore radius, inner pore radius, and P/P0; thus, the selective adsorption capacities of Pb(Ⅱ), Mn(Ⅱ), and Zn (Ⅱ) by FACHNO3 can be achieved by regulating the drying temperature.
BET Characterization
The N2 adsorption and desorption curves obtained from BET analysis are shown in Fig. 6. Spsf was found to belong to a type-III isotherm, indicating that its adsorption capacity was small and the interaction force between Spsf and the adsorbent was weak. The adsorption and desorption values of Spsf were the lowest, and the SP-FAC fibre belonged to type-I isotherm (Langmuir isotherm), which was consistent with the characteristic curve of activated carbon fibres.
The BET data calculated from Fig. 6 are shown in Table 2. The multiple BET specific surface areas of Spsf was 3.55 m2/g, while that of SP-FAC was 129.3 m2/g. This result was attributed to the increase in surface voids and specific surface area of Spsf during carbonization at high temperature, which belongs to physical modification. The total volume of single-point pores of Spsf was 0.10 cm3/g, and that of FAC was 0.16 cm3/g.
Table 2. Pore Structure Analysis Results of Salix Fibre, FAC, and FACHNO3

Because of the increase in specific surface area that increased the total volume of FAC; the pore radius of Spsf was 110.0 nm, and that of SP-FAC was 80.4 nm. This indicated that during carbonization of Salix fibre, large pores were collapsed and many mesopores were formed. The single-point mean pore radius and SP-FAC fibre were 55.8 and 2.42 nm, respectively, which indicated that during the high-temperature carbonization process, some macropores were caved in and ash-volatilized, and more mesopores were formed on the surface of some macropores due to the addition of the activator. The pore size distributions of the samples, shown in Fig. 6I, also confirm their highly developed micropores. The pore size distributions showed a sharp peak centered at 0.2 and 0.5 nm for all the samples, and their volumes declined with increasing HNO3 addition.


Fig. 6. Adsorption and desorption isotherms of Spsf, SP-FAC, and FACHNO3 (a: adsorption and desorption isotherms of Spsf; b: adsorption and desorption isotherms of SP-FAC; c–k: FACHNO3 1 to FACHNO3 9; and i: pore size distributions of samples)
Compared to SP-FAC, the specific surface area and total pore volume of FACHNO3 increased. The maximum specific surface area achieved was 1033 m2/g, which was 7.99 times that of SP-FAC, and the maximum total pore volume was 0.60 cm3/g, which was 3.83 times that of SP-FAC. This was because of the HNO3 etching on the SP-FAC surface, which indicated that HNO3-modified SP-FAC can increase the adsorption capacity of activated carbon fibres. The single-point outer surface pore radius was mostly micropores, indicating that HNO3 modification regulates the pore radius of SP-FAC.
FT-IR Characterisation Analysis
Figure 7 shows the FT-IR spectra of Spsf, SP-FAC, FACHNO3, FACHNO3-Pb, FACHNO3-Mn, and FACHNO3-Zn In all spectra, 3350 to 3300 cm-1 corresponded to an -O-H stretching vibration peak (Zhao et al. 2016), which is characteristic of cellulose. The characteristic peak of SP-FAC decreased at 3390 to 3220 cm-1, which is caused by the destruction of intermolecular hydrogen bonds after high temperature carbonization of Spsf. In addition, the following characteristic peaks were observed: 2930 to 2833 cm-1 corresponded to an -C-H stretching vibration peak (El Mansouri et al. 2011), the vibrations of -C-C bonds and aliphatic -C-H, -C-O, and -C-O-C groups at 1500 to 1000 cm-1; and peaks in the 900 to 615 cm-1 range (indicating -C-H deformation in benzene ring) (Srisasiwimon et al. 2018). The peak values of SP-FAC decreased in all these characteristic peaks, which can be attributed to the chemical reaction between Spsf and (NH4)2HPO4, which destroyed the functional groups. The characteristic peak of FACHNO3 was lower than that of SP-FAC, indicating that the chemical reaction between SP-FAC and HNO3 destroyed the functional groups. However, the characteristic peaks of FACHNO3-Pb, FACHNO3-Mn and FACHNO3-Zn were similar to those of FACHNO3, indicating that the functional groups in the adsorption process did not change, which further confirmed that the adsorption process was a simple physical modification.

Fig. 7. FT-IR spectra of Spsf, SP-FAC, FACHNO3, FACHNO3-Pb, FACHNO3-Mn, and FACHNO3-Zn
XRD Characterisation
Figure 8 shows the XRD patterns of Spsf, SP-FAC, FACHNO3, FACHNO3-Pb, FACHNO3-Mn, and FACHNO3-Zn, where the characteristic peaks C(101) and C(002) of Spsf resemble those of Cellulose-I, indicating that Spsf belongs to type-I cellulose. The characteristic peaks of FAC at C(101) and C(002) disappeared, indicating that FAC destroyed the crystal structure during high-temperature carbonization. In contrast, the characteristic peaks of FACHNO3 of C(002) reappeared, indicating that HNO3 strengthened the crystal structure of FAC. The characteristic peaks of FACHNO3-Pb, FACHNO3-Mn, and FACHNO3-Zn agreed with that of FACHNO3, indicating that the crystal structure of activated carbon fibres remained unchanged after the adsorption of metal ions by FACHNO3.
At 2θ = 37.76°, 43°, 64.38°, and 77.46°, the refraction maxima correspond to (111), (200), (220), and (311) crystal planes and belong to the graphite plane peak (Liu and Lang 2020). All three materials showed graphite plane peaks, which are the characteristic diffraction peaks of the crystal surface structure of carbon. The peak values of FACHNO3, FACHNO3-Pb, FACHNO3-Mn, and FACHNO3-Zn decreased rapidly, while those of FACHNO3-Mn and FACHNO3-Zn increased at 2θ = 43°, 64.38°, and 77.46°, indicating that the crystal structure of Spsf was strengthened by the carbonization process of activated carbon fibres. The results further showed that HNO3 changed the crystal structure of SP-FAC but the metal ions did not.

Fig. 8. XRD patterns of Sps, SP-FAC, FACHNO3, FACHNO3-Pb, FACHNO3-Mn, and FACHNO3-Zn
SEM and EDS Characterizations
Figure 9a shows the SEM comprehensive and detailed diagrams of Spsf, and Fig. 9b shows the EDS scanning diagram of the corresponding sample. The surface of Spsf appeared as smooth, with a few large pores, and the morphology was irregular and evidently fibrous. The results of the EDS analysis showed that the Spsf was composed of C and O elements, which conform to the content characteristics of basic elements of cellulose. Figures 9c and 9d show the characterization of SP-FAC. The surface roughness of SP-FAC was increased, there were many neatly arranged pores, and the contents of P and N elements was also increased. This is because SP-FAC was obtained after (NH4)2HPO4 solution treatment of Spsf during the preparation process and it formed many folds and micropores after carbonization at high temperature. Figures 9e and 9f show the characterization of FACHNO3. The surface roughness, number of micropores, and specific surface area were increased, while the contents of P and N elements remained constant. This is due to the formation of many microporous structures on the SP-FAC surface via HNO3 corrosion. Figures 9g and 9h show the characterization peaks of Pb(Ⅱ) adsorbed by FACHNO3. There are many bright spots in the figure, which are the characteristic light spots reflected by metal ions. EDS shows that the Pb element content was increased in the sample, indicating that considerable Pb(Ⅱ) was attached to FACHNO3. Figures 9i and 9j show the characterization of Mn(Ⅱ) adsorption by FACHNO3. The figure further highlighted metal reflection and EDS showed that Mn element was added in the sample, indicating that Mn(Ⅱ) was successfully attached to FACHNO3. Figures 9k and 9l show the characterization of Zn(Ⅱ) adsorption by FACHNO3. Many white reflective metal ions were formed on the FACHNO3 surface. The EDS showed that the Zn element was added to the sample, indicating that many Zn(Ⅱ) were attached to FACHNO3.
The results showed that the Spsf and FACHNO3 had evident adsorption effect on Pb(Ⅱ), Mn(Ⅱ), and Zn(Ⅱ) ions in its pore structures. Therefore, there was a correlation between the adsorption capacity of activated carbon fibres for metal ions and pore structure. The sequential adsorption of different metal ions on activated carbon fibres can be clearly understood by nitric acid modification.

Fig. 9. SEM and EDS spectra. a: SEM full view and local details of Spsf; b: EDS spectrum of S. psammophila fibre; c: SEM full view and local details of SP-FAC; d: EDS spectrum of SP-FAC; e: SEM full view and local details of FACHNO3; f: EDS spectra of FACHNO3

Fig. 9. cont. SEM and EDS spectra. g: SEM full view and local details of FACHNO3-Pb; h: EDS spectrum of FACHNO3-Pb; i: SEM full view and local details of FACHNO3-Mn; j: EDS spectrum of FACHNO3-Mn; k: SEM full view and local details of FACHNO3-Zn; and l: EDS spectrum of FACHNO3-Zn).
CONCLUSIONS
- With the increase in specific surface area of SP-FAC prepared by carbonization, the adsorption capacities of Pb(Ⅱ), Mn(Ⅱ), and Zn(Ⅱ) increased, while the outer surface pore radius and inner pore radius were decreased. The pore structure of SP-FAC appeared more suitable for the adsorption of the three metal ions.
- At CHNO3 = 65 wt%, impregnation ratio 1:35, impregnation time 12 h, and drying temperature 100 °C, the maximum adsorption capacity of Pb(II) on activated carbon fiber was 85.5 mg/g, and the pore radius of FACHNO3 was 1.12 nm, which is in line with the size range of Pb(II). At CHNO3 = 75 wt%, impregnation ratio 1:25, impregnation time 36 h, and drying temperature 100, the maximum adsorption capacity of Mn(II) was 92.3 mg/g, and the pore radius of FACHNO3 was 1.24 nm, which is in line with the size range of Mn(II). At CHNO3 = 55 wt%, impregnation ratio 1:35, impregnation time 36 h, and drying temperature 120, the maximum adsorption capacity of Zn(II) was 59.9 mg/g, and the pore radius of FACHNO3 was 0.97 nm, which is in line with the size range of Zn(II).
- There was a close correlation between the pore structure and adsorption capacity. The specific surface area and pore volume were positively correlated with adsorption capacity. The outer surface pore radius, pore radius, and P/P0 were negatively correlated with adsorption capacity. When CHNO3 increased, the specific surface area was positively correlated with adsorption capacity, and the concentration affects the specific surface area much more than other variables.
- This study shows that the activated carbon fiber was modified with HNO3 to make it have selective adsorption capacity, which provides a new idea for the recovery and utilization of metal ions. Secondly, the technology can be applied to the medical field, using the competitive adsorption of activated carbon to different ions and balancing the content of trace metals in the blood, to achieve the purpose of treating some diseases.
ACKNOWLEDGMENTS
This research was financially supported by Natural Science Foundation of Inner Mongolia Autonomous Region (Grant No. 2017MS0358), and the Autonomous Region Undergraduate Innovation and Entrepreneurship Training Program (Grant No. 202110129007).
Author Contributions
Conceptualization, X.W.; methodology, D.W.; validation, Y.W. and X.W.; formal analysis, D.W.; investigation, Y.W.; data curation, D.W.; writing—original draft preparation, D.W.; and writing—review and editing, X.W. All authors have read and agreed to the published version of the manuscript.
Conflicts of Interest
The authors declare no conflict of interest.
REFERENCES CITED
Aggarwal, D., Goyal, M., and Bansal, R. C. (1999). “Adsorption of chromium by activated carbon from aqueous solution,” Carbon 37(12), 1989-1997. DOI: 10.1016/S0008-6223(99)00072-X
Chen, L. F., Liang, H. W., Lu, Y., Cui, C. H., and Yu, S. H. (2011). “Synthesis of an attapulgite clay@carbon nanocomposite adsorbent by a hydrothermal carbonization process and their application in the removal of toxic metal ions from water,” Langmuir 27(14), 8998-9004. DOI: 10.1021/la2017165
Choma, J., Burakiewicz, M. W., Jaroniec, M., and Klinik, J. (1999). “Monitoring changes in surface and structural properties of porous carbons modified by different oxidizing agents,” Journal of Colloid and Interface Science 214(2), 438-446. DOI: 10.1006/jcis.1999.6246
El Mansouri, N. E., Yuan, Q., and Huang, F. (2011). “Characterization of alkaline lignins for use in phenol-formaldehyde and epoxy resins,” BioResources 6(3), 2647-2662. DOI: 10.15376/biores.6.3.2647-2662
Fu, F. L., and Wang, Q. (2011). “Removal of heavy metal ions from wastewaters: A review,” Journal of Environmental Management 92(3), 407-418. DOI: 10.1016/j.jenvman.2010.11.011
GB/T 12496.13 (1990). “Test method for wood activated carbon – heavy metal content,” Standardization Administration of China, Beijing, China.
GB/T 12496.22 (1999). “Wood activated carbon test method — Determination of heavy metals,” Standardization Administration of China, Beijing, China.
GB/T 26798 (2011). “Single beam UV-vis spectrophotometer,” Standardization Administration of China, Beijing, China.
GB/T 7702.20 (1997). “Test method for granular activated carbon from coal – Determination of pore volume,” Standardization Administration of China, Beijing, China.
GB/T 7702.21 (1997). “Test method for granular activated carbon from coal – Determination of specific surface area,” Standardization Administration of China, Beijing, China.
Ge, X. Y., Ma, X. F., Wu, Z. S., Xiao, X. M., and Yan, Y. J. (2014). “Modification of coal-based activated carbon with nitric acid using microwave radiation for adsorption of phenanthrene and naphthalene,” Research on Chemical Intermediates 41(10), 1-21. DOI: 10.1007/s11164-014-1815-2
Ghosh, P. K. (2009). “Hexavalent chromium [Cr (VI)] removal by acid modified waste activated carbons,” Journal of Hazardous Materials 171(1-3), 116-122. DOI: 10.1016/j.jhazmat.2009.05.121
Gokce, Y., and Aktas, Z. (2014). “Nitric acid modification of activated carbon produced from waste tea and adsorption of methylene blue and phenol,” Applied Surface Science 313(15), 352-359. DOI: 10.1016/j.apsusc.2014.05.214
Gupta, V. K., Ali, I., Saleh, T. A., Nayak, A., and Agarwal, S. (2012). “Chemical treatment technologies for waste-water recycling-an overview,” RSC Advances 2(16), 6380-6388. DOI: 10.1039/c2ra20340e
Hete, Y. V., Gholase, S. B., and Khope, R. U. (2012). “Adsorption study of cobalt on treated granular activated carbon,” Journal of Chemistry 9(1), 335-339. DOI: 10.1155/2012/472517
Jjagwe, J., Olupot, P. W., Menya, E., and Kalibbala, H. M. (2021). “Synthesis and application of granular activated carbon from biomass waste materials for water treatment: A review,” Journal of Bioresources and Bioproducts 6(4), 292-322. DOI: 10.1016/J.JOBAB.2021.03.003
Kuroki, A., Hiroto, M., Urushihara, Y., Horikawa, T., Sotowa, K. I., and Avila, J. R. A. (2019). “Adsorption mechanism of metal ions on activated carbon,” Adsorption 25(6), 1251-1258. DOI: 10.1007/s10450-019-00069-7
Li, L. Y., Gong, X. D., and Abida, O. (2019). “Waste-to-resources: Exploratory surface modification of sludge-based activated carbon by nitric acid for heavy metal adsorption,” Waste Management 8(7), 375-386. DOI: 10.1016/j.wasman.2019.02.019
Li, Q., Sun, J., Ren, T. H., Guo, L., Yang, Z. L., Yang, Q., and Chen, H. (2017). “Adsorption mechanism of 2,4-dichlorophenoxyacetic acid onto nitric-acid-modified activated carbon fiber” Environmental Technology 39(5-8), 895-906. DOI: 10.1080/09593330.2017.1316318
Li, Y. B., Huang, J. T., and Pan, Y. F. (2014). “Preparation and photocatalytic properties of rod-shaped TiO2 based on Salix fiber,” Key Engineering Materials 60(9), 250-254. DOI: 10.4028/www.scientific.net/KEM.609-610.250
Liu, J. T., Liu, S. J., and Gao, H. (2011). “Study on adsorption of Cr(VI) in wastewater by powdered activated carbon,” Advanced Materials Research 287(290), 2070-2073. DOI: 10.4028/www.scientific.net/AMR.287-290.2070
Liu, W. J., and Lang, Z. (2020). “The structure and self-regeneration performance of Salix psammophila-activated carbon modified by Ag and N co-doped TiO2” RSC Advances 10(7), 3844-3852. DOI: 10.1039/C9RA10305H
Loganathan, P., Shim, W. G., Sounthararajah, D. P., Kalaruban, M., Nur, T., and Vigneswaran, S. (2018). “Modelling equilibrium adsorption of single, binary, and ternary combinations of Cu, Pb, and Zn onto granular activated carbon,” Environmental Science and Pollution Research 25(17), 16664-16675. DOI: 10.1007/s11356-018-1793-9
Luo, X. S., Zhang, Z., Zhou, P. X., Liu, Y. N., Ma, G. F., and Lei, Z. Q. (2015). “Synergic adsorption of acid blue 80 and heavy metal ions (Cu2+/Ni2+) onto activated carbon and its mechanisms,” Journal of Industrial and Engineering Chemistry 27(11), 164-174. DOI: 10.1016/j.jiec.2014.12.031
Marzal, P., Seco, A., and Gabaldon, C. (1996). “Cadmium and zinc adsorption onto activated carbon: Influence of temperature, pH and metal/carbon ratio,” Journal of Chemical Technology & Biotechnology 66(3), 279-285. DOI: 10.1002/(SICI)1097-4660(199607)66:3<279::AID-JCTB506>3.0.CO;2-K
Oter, C., and Zorer, O. S. (2021). “Adsorption behaviours of Th(IV) and U(VI) using nitric acid (HNO3) modified activated carbon: Equilibrium, thermodynamic and kinetic studies,” International Journal of Environmental Analytical Chemistry 101(14), 1-16. DOI: 10.1080/03067319.2019.1691184
Phan, N. H., Rio, S., Faur, C., Coq, L. L., Cloirec, P. L., and Nguyen, T. H. (2006). “Production of fibrous activated carbons from natural cellulose (jute, coconut) fibers for water treatment applications,” Carbon 44(12), 2569-2577. DOI: 10.1016/j.carbon.2006.05.048
Qu, G. Z., Ji, H. B., Xiao, R., and Liang, D. L. (2012). “Effect of modification with nitric acid and hydrogen peroxide on chromium (VI) adsorption by activated carbon fiber,” Advanced Materials Research 518(523), 2099-2103. DOI: 10.4028/www.scientific.net/AMR.518-523.2099
Saputro, S., Mahardiani, L., Masykuri, M., and Jazuli, A. Z. (2019). “The effectiveness of the activated carbon from coconut shell and corn cob to adsorb Pb (II) ion and its analysis using solid-phase spectrophotometry,” IOP Conference Series: Materials Science and Engineering 57(8), Article ID 012020. DOI: 10.1088/1757-899X/578/1/012020
Seco, A., Marzal, P., and Gabaldon, C. (1997). “Adsorption of heavy metals from aqueous solutions onto activated carbon in single Cu and Ni Systems and in binary Cu–Ni, Cu–Cd and Cu–Zn systems,” Journal of Chemical Technology & Biotechnology 68(1), 23-30. DOI: 10.1002/(SICI)1097-4660(199701)68:1<23::AID-JCTB595>3.0.CO;2-N
Srisasiwimon, N., Chuangchote, S., Laosiripojana, N., and Sagawa, T. (2018). “TiO2/lignin-based carbon composited photocatalysts for enhanced photocatalytic conversion of lignin to high value chemicals,” ACS Sustainable Chemistry & Engineering 6(11), 13968-13976. DOI: 10.1021/acssuschemeng.8b02353
Srivastava, V. C., Mall, I. D., and Mishra, I. M. (2008). “Adsorption of toxic metal ions onto activated carbon Study of sorption behaviour through characterization and kinetics,” Chemical Engineering and Processing 47(8), 1275-1286. DOI: 10.1016/j.cep.2007.04.006
Ucer, A., Uyanik, A., and Aygun, S. F. (2006). “Adsorption of Cu(II), Cd(II), Zn(II), Mn(II) and Fe(III) ions by tannic acid immobilised activated carbon,” Separation and Purification Technology 47(3), 113-118. DOI: 10.1016/j.seppur.2005.06.012
Uchimiya, M., Lima, I. M., Klasson, K. T., Chang, S. C., Wartelle, L. H., and Rodgers, J. E. (2010). “Immobilization of heavy metal ions (Cu(II), Cd(II), Ni(II), and Pb(II)) by broiler litter-derived biochars in water and soil,” Journal of Agricultural and Food Chemistry 58 (9), 5538-44. DOI: 10.1021/jf9044217
Wang, Z. H., Shen, F., Shen, D. K., Jiang, Y. H., and Xiao, R. (2017). “Immobilization of Cu2+ and Cd2+ by earthworm manure derived biochar in acidic circumstance,” Journal of Environmental Sciences 53(03), 293-300. DOI: 10.1016/j.jes.2016.05.017
Zhang, J., Liu, J. S., Liu, C., Yang, J. L., and Zhang, L. (2013). “Characteristics of activated carbon modified with nitric acid and its performance in catalytic ozonation of Acid Red 3R,” Advanced Materials Research 2480(726-731), 1687-1690. DOI: 10.4028/www.scientific.net/AMR.726-731.1687
Zhao, M., Meng, L., Ma, L., Wu, G., Wang, Y., Xie, F., and Huang, Y. (2016). “Interfacially reinforced carbon fiber/epoxy composites by grafting melamine onto carbon fibers in supercritical methanol,” RSC Advances 6(35), 29654-29662. DOI: 10.1039/C6RA00570E
Article submitted: April 2, 2022; Peer review completed: May 14, 2022; Revised version received: May 26, 2022; Accepted: May 27, 2022; Published: June 1, 2022.
DOI: 10.15376/biores.17.3.4410-4431