
Abstract
The feasibility of separating small molecular organic compounds in the aqueous fraction of methyl bio-oils (AFMBO) using nanofiltration (NF) and reverse osmosis (RO) membranes was studied. Four kinds of commercially available NF and RO membranes were studied preliminarily by using model solutions (aqueous solution of methyl glycosides and glycerol). The membrane module was spiral wound, which is a more suitable format for industrialization than the flat-sheet format for dead-end filtration. The NF400-600 membrane exhibited the best separation performance; the permeate flux was 48.6 L/(m2·h), the methyl glucosides (MEG) rejection ratio was 95.4%, and the transmission of glycerol was 81.0% with an initial concentration of 10 g/L (0.4 MPa, 45 ºC). Compared with the model solution, the NF performance of AFMBO, which included permeate flux, rejection of MEG, transmission of glycerol, and separation of the other components in AFMBO, was investigated. The more complex constituents of AFMBO led to NF400-600 permeability and separating property decline compared with the model solution in the same operating conditions; meanwhile more serious and even irreversible membrane fouling occurred. This research provided a reference for membrane separation industrial feasibility and application of AFMBO.
Download PDF
Full Article
Separation of Methyl Glycosides and Glycerol from Aqueous Fraction of Methyl Bio-oils Using Nanofiltration
Zean Xie,a,b Xinping Wang,a Lu Li,*,a and Jinhui Pang a
The feasibility of separating small molecular organic compounds in the aqueous fraction of methyl bio-oils (AFMBO) using nanofiltration (NF) and reverse osmosis (RO) membranes was studied. Four kinds of commercially available NF and RO membranes were studied preliminarily by using model solutions (aqueous solution of methyl glycosides and glycerol). The membrane module was spiral wound, which is a more suitable format for industrialization than the flat-sheet format for dead-end filtration. The NF400-600 membrane exhibited the best separation performance; the permeate flux was 48.6 L/(m2·h), the methyl glucosides (MEG) rejection ratio was 95.4%, and the transmission of glycerol was 81.0% with an initial concentration of 10 g/L (0.4 MPa, 45 ºC). Compared with the model solution, the NF performance of AFMBO, which included permeate flux, rejection of MEG, transmission of glycerol, and separation of the other components in AFMBO, was investigated. The more complex constituents of AFMBO led to NF400-600 permeability and separating property decline compared with the model solution in the same operating conditions; meanwhile more serious and even irreversible membrane fouling occurred. This research provided a reference for membrane separation industrial feasibility and application of AFMBO.
Keywords: Methyl glycosides; Glycerol; Bio-oil; Nanofiltration; Membrane fouling
Contact information: a: College of Marine Science and Biological Engineering, Qingdao University of Science and Technology, Qingdao, 266042, China; b: State Key Laboratory of Heavy Oil, College of Science, China University of Petroleum, Beijing, 102249, China;
* Corresponding author: zhanglilu@126.com
INTRODUCTION
Due to rapid depletion of fossil fuels and associated environmental pollution, increased attention has been directed towards biomass, as an abundant, non-edible, and readily available source of renewable material. Biomass can also be transformed into high-value production. Direct utilization of the biomass resources as chemical feedstocks is difficult due to their complex and robust crystalline structure; thus, the biomass must be refined to more convenient forms (Teella et al. 2011). Research has shown that hydrolysis of biomass by different kinds of acid catalysis at relatively lower temperatures (< 473 K) (Zhao et al. 2006) is most suitable for upgrading to the industrial application when it was compared with high-temperature pyrolysis (high-energy input and low selectivity) and enzymatic catalysis (slow process and high projected manufacturing costs) (Kamm 2007; Zellagui et al. 2016; Rezaei et al. 2017). Deng et al. (2010) reported that cellulose can be transformed into methyl glucosides (MEG) in methanol with relatively high yields of 50% to 60%, while Xu et al. (2012) reported that more complex biomass (lignocellulosic materials) liquefied and separated into a biopolyol aqueous phase and hydrophobic phenolics with the addition of a sufficient amount of water (Huber et al. 2004; Elliott et al. 2009). The aqueous fraction of the methyl bio-oil (AFMBO) mainly contains MEG (35.0%), glycerol (40.0%), and other organic compounds (25%), including esters, furans, phenols, acids, etc. (Xu et al. 2012; Feng et al. 2016). MEG are known as natural renewable materials for consumer-friendly and environmentally friendly anionic surfactants (El-Sukkary et al. 2008; Xu et al. 2011). To separate and purify the AFMBO, various traditional separation methods, such as centrifugation, precipitation, extraction, multi-effect evaporation, and column chromatography, have been reviewed (Mussatto and Roberto 2004; Huang et al. 2008; Pienkos and Zhang 2009). However, none of these methods have proven efficient in an ability to separate methyl sugar derivatives from AFMBO, and each of them has its own drawbacks: high processing costs (centrifugation, evaporation), high chemical consumption and production of wastes (ion-exchange, adsorption), hazardous solvent handling (liquid/liquid extraction), and significant sugar loss or low efficiency (centrifugation, precipitation, and column chromatography) (Nguyen et al. 2015). However, membrane separation has significant advantage of refining low molecular weight solution without the requirement of stoichiometric reagents. Pressure-driven membrane separation processes are often more efficient and easier to operate than traditional separation processes (Watson and Hornburg 1989; Ducom and Cabassud 1999). Nanofiltration (NF) and reverse osmosis (RO) have been used successfully in separation of organic substances (Van der Bruggen et al. 1998). Han and Cheryan (1995) reported that several RO and NF membranes were screened for separating acetic acid from glucose, and the average acetate and glucose rejections are 40% and 99%, respectively. They also report that flux and rejection of acetic acid are influenced by pressure, temperature, concentration, pH, and the degree of dissociation of the acetate. Woźniak and Prochaska (2014) reported on the rejection of fumaric salts from glycerol fermentation broth, of which the rejection of glycerol was lower than 6%, which shows better permeability of glycerol through a NF membrane. The research of Van der Bruggen et al. (1998) and Wang and Nakao (1988) showed that the rejection of a series of neutral small organic molecules were mostly influenced by each molecule’s size parameter (correlated with molecular weight) in the nanofiltration process. The separation layers of NF membranes have pores in the 0.5 nm to 2 nm range, and are suited for rejecting compounds of molecular weight up to 150 g/mol to 1000 g/mol (Weng et al. 2009), while a RO membrane with more compact layers can reject smaller molecules, according to the theory. MEG and glycerol have molecular weights of 194 g/mol and 92 g/mol, respectively, also suggesting that NF is appropriate for separating the two solutes. However, nanofiltration membrane performance depends on size exclusion as well as surface interactions between the membrane and dissolved species, feed pH, ionic strength, and the concentration of the various dissolved solutes (Bellona et al. 2004). Maiti et al. (2012) and Weng et al. (2010) have conducted a more detailed study in which the removal of toxic compounds from rice straw hydrolysates and the concentration of monomeric sugars is possible using nanofiltration membranes. Consequently, membrane performance is difficult to predict as it depends on the interaction between all of these parameters. The aim of this work was to select appropriate membranes from different kinds of spiral-wound modules of NF and RO membranes on a filtration device for their ability to separate MEG and glycerol from AFMBO (the spiral-wound module is more suitable for large-scale production and close to the actual industrial applications) (Tsibranska and Tylkowski 2013). Experiments were conducted with model solution containing MEG and glycerol, and the effects of operating pressure, temperature, and concentration on permeate flux and solute rejection were studied. Membranes and operational conditions providing the highest methyl glucosides rejection with the highest glycerol transmission were selected for future investigations. Compared with the model solution, AFMBO was used to study the real situation of membrane separation, fouling, and cleaning.
EXPERIMENTAL
Materials
AFMBO and model solution
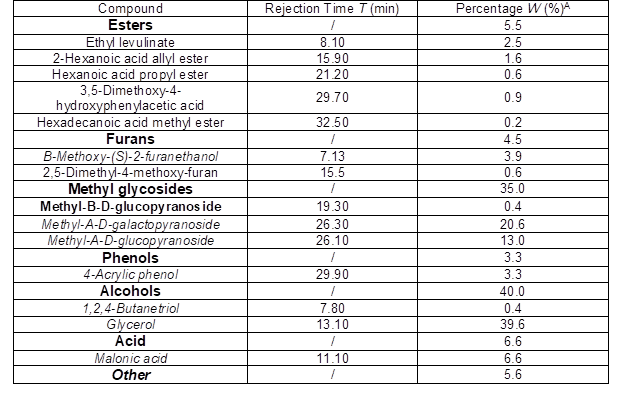
Lignocellulosic biomass (bamboo) was liquefied catalytically in methanol and glycerol solution under suitable temperature and pressure. The liquefied products (Institute of Chemical Industry of Forest Products, Chinese Academy of Forestry, Beijing, China) were separated by the addition of a sufficient amount of water after removing the methanol via rotary evaporation (Xu et al. 2012). Calcium hydroxide was added until the solution was neutral, and then the hydrophobic phenolics and calcium sulfate were removed using a Buchner funnel. Lastly, the bio-oil solution was filtered preliminarily by microfiltration of thin-film (Φ50 mm, nominal 0.45-μm pore sizes) for the removal of the major quantity of char particles and ash content of the bio-oil. The analysis of composition of bamboo methanol liquefied analysis of polyglycosides is given in Table 1. The model solution contained glycerol (40%) and methyl glucosides (35%), as they are the main compounds of AFMBO (Feng et al. 2016). The chemicals that were purchased from Aladdin Reagent Co., Ltd. (Shanghai, China) and Bodi Chemical Co., Ltd. (Tianjing, China).
Table 1. Composition of Bamboo Methanol Liquefied Analysis of Polyglycosides
Membranes
Four commercially available RO and NF membranes (Table 1) were selected according to the constituent of bio-oil solution, literature reports, and data from suppliers. For NF membranes, molecular weight cut-off (MWCO) was in the range of 200 g/mol to 800 g/mol as given by manufacturers, which is suitable for the separation. The MWCO was not indicative enough because craftsmanship might vary from one manufacturer to the other. All membranes were thin-film composite membranes with an aromatic polyamide active layer. Maximal operating conditions were 45 ºC, 6 bar, and 2 to 11 for pH. The membrane module form selected was the spiral wound module, which has potential for larger scale applications compared with flat-sheet of dead-end filtration (Bian et al. 2000).
Table 2. Parameters of Reverse Osmosis and Nanofiltration Membrane
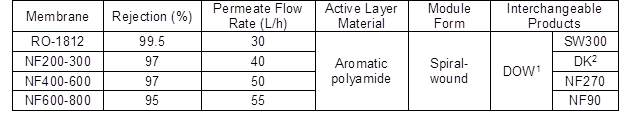
Note: Testing conditions of water permeate flux and rejection ratio of RO-1812 were 2000 ppm NaCl, 225 psi (1.55 MPa), and 25 ºC. Testing conditions of water permeate flux and rejection ratio of NF membrane were 2000 ppm MgSO4, 70 psi (0.48 MPa), and 25 ºC.
1 DOW: the membrane products from The Dow Chemical Company
2 DK: the membrane products from American General Corporation
Filtration device and protocol
Experiments were performed with use of a Ro-nf-uf-4010 filtration device (MoSu Equipment Science Ltd., Shanghai, China), which allowed several spiral-wound membrane modules to be tested in sequence. Filtration area was 0.4 m2 for each membrane type. Pure water was first filtered for membrane compaction at 0.4 MPa until flux stabilization.
The effects of pressure, concentration, and temperature on rejections and permeate flux were studied on the NF and RO groups separately in batch recycling mode (both retentate and permeate recycled in the feed vessel) (Fig. 1).
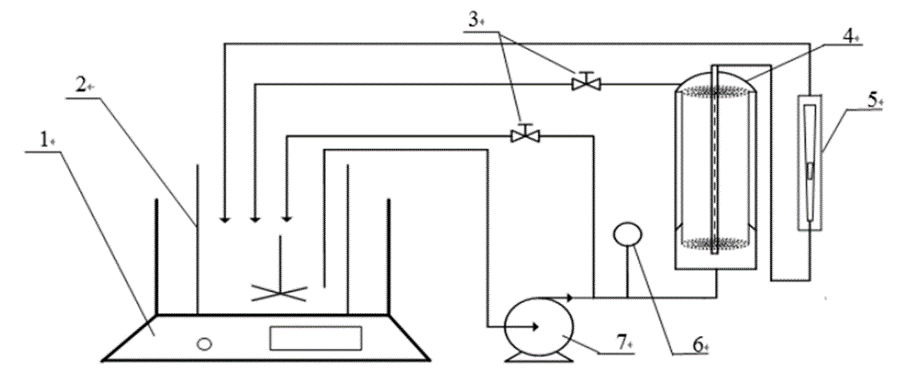
Fig. 1. Schematic diagram of filtration system (1: Water bath; 2: Feed vessel; 3: Control valve; 4: Nanofiltration module; 5: Flowmeter; 6: Pressure gauge; and 7: Infusion pump)
Pressure was increased from 0.2 MPa to 0.6 MPa in increments of 0.1 MPa. At each pressure, after 10 min circulating for stabilization, samples of feed, current retentate, and individual permeate were collected to detect the concentration of required components by high performance liquid chromatography (HPLC) with differential refraction detector, and the permeate flux was recorded.
The pure water flux Jw and permeate flux Jp through the membrane were calculated by permeate flow-rate measurements as in Eq. 1,
Jw, Jp = Fp / S (1)
where Fp is the permeate flow rate (L / h) and S is the membrane area (m2).
The observed rejection Ri and transmission Ti were calculated in Eqs. 2 and 3,
Ri (%) = (1 – Cp,I / CF,i) × 100 (2)
Ti (%) = 100 – Ri (3)
where Cp,I and CF,I are the concentrations of solute i (g/L) in the permeated and in the feed tank, respectively.
The fouling ratio (FR) and the water flux recovery ratio (WFR) were calculated in Eqs. 4 and 5,
FR (%) = (J0 – Jfw) / J0 × 100 (4)
WFR (%) = (Jw – Jfw) / (J0 – Jfw) × 100 (5)
where J0 is the pure water flux before filtration (L/(m2·h)), Jfw is the pure water flux after filtration of solution(L/(m2·h)), and Jw is the pure water flux after cleaning the membrane by water, dilute acid solution, dilute alkali solution, or special detergent (L/(m2·h)).
Methods
The samples were analyzed by HPLC (Shimadzu, Kyoto, Japan). Solutes (glycerol, methyl glucosides, and malonic acid) were separated in the SUGAR SC1011 column (300 mm × 8 mm i.d., 6-μm particle size; Shodex Corporation, Tokyo, Japan), which was heated at 70 ºC. The detector was an evaporative light-scattering detector (Shimadzu, Kyoto, Japan) and the evaporation temperature was 30 ºC. The mobile phase was water at a flow rate of 1 mL/min. The concentration of samples was determined by external standard method, and sorbitol was used as external standard.
RESULTS AND DISCUSSION
Table 3. The Index of Membrane Experiment
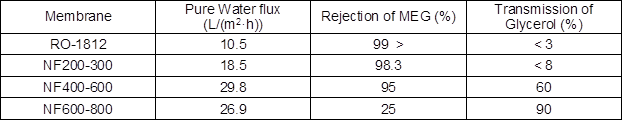
Note: For the filtration condition, the operating pressure was 0.4 MPa, initial concentration was 20 g/L (the ratio of MEG and glycerol was 1:1), and the operation temperature was 25 ºC.
The Selection of Membranes
The pure water flux results of four membranes are given in Table 3 under the same conditions. The pure water flux of RO-1812 was 10.5 L/(m2·h) and exhibited the lowest permeability, probably because this reverse osmosis membrane had a lower porosity factor and was more compact than nanofiltration, which was consistent with the lowest permeate flow rate shown in Table 2. The highest permeability of NF400-600 among the NF membranes (29.8 L/(m2·h)) might have been related to its low active layer thickness compared to NF200-300 (90 nm for NF270 against 120 nm for DK nanofiltration membrane according to Dalwani et al. (2011)).
For RO-1812 and NF200-300, rejection of MEG and glycerol were both higher than 97% due to a predominant size exclusion effect. However, the best membrane that was selected should provide the highest MEG rejection together with the highest glycerol transmission. For NF600-800, rejection of MEG and glycerol were both lower than 25%, which showed strong permeability, and is also not suitable for the separation. The MEG rejection for NF400-600 was 95%, and the glycerol transmittance was 60%, which indicated that the majority of MEG had remained in the retentate, and most of the glycerol flowed through the membrane into the permeate, resulting in remarkable separation during the membrane filtration process.
In summary, NF400-600 had better performance for the separation of MEG and glycerol, while the other three films showed poor ability of separation. Meanwhile, NF200-300 and RO1812 could be used in a concentrated aqueous solution containing glycerol or MEG. The subsequent experiments were all studies of NF400-600 properties in the separation of bio-oil solution.
NF of Model Solution
The permeate flux, rejection of MEG, and transmission of glycerol were taken as indexes, and experiments were conducted with 10 g/L model solution at 20 ºC via experimental method as previously mentioned. First, the effects of operating pressure for NF were investigated, with each experiment repeated three times and the average result under the same condition recorded. The result data were integrated, appraised, and selected for adoption as the next steps’ conditions. For the effect of initial concentration and operating temperature, the same steps above were also taken sequentially.

Fig. 2. (a) Effect of operating pressure on the permeate flux; (b) Effect of operating pressure on the MEG rejection ratio and the transmission of glycerol
Effect of operating pressure
According to the solution-diffusion model (Nguyen et al. 2015),
![]()
where ∆∏ is the osmotic pressure difference of retentate and permeate, and Aw is the permeate constant. The permeate flux was nearly a linear function of operating pressure (Fig. 2).
As rejection order was in accordance with MW or with Stokes diameter, the rejection of MEG (MW = 194) was higher than 95% and of glycerol (MW = 92) was lower than 40% (Ri = 1 – Ti), which was likely due to a predominant size exclusion effect. The rejection of MEG had almost no change while the transmission of glycerol declined slightly with increasing operating pressure (Fig. 2b), which indicated that as pressure was increased, the solvent (water) flux increased faster than solute (glycerol) flux, and thus rejections decreased (Nguyen et al. 2015).
As expected, the operational conditions provided the highest permeate flux and the highest MEG rejection simultaneously with the highest glycerol transmission. However, Fig. 2 illustrates that the two purposes were paradoxical as increasing operating pressure, so the authors chose 0.4 MPa as the better operating pressure for the balance of them.
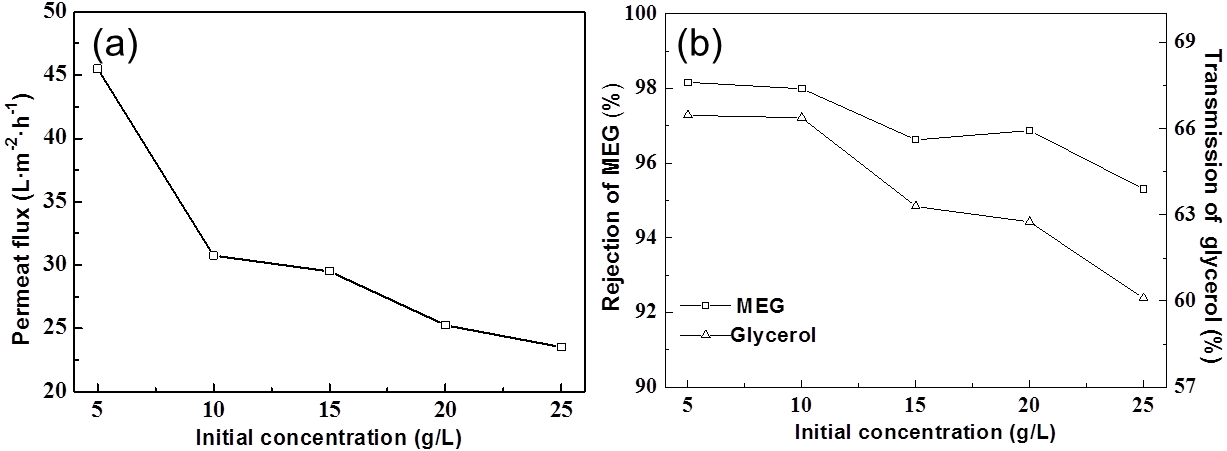
Fig. 3. (a) Effect of initial concentration on the permeate flux; (b) Effect of initial concentration on the MEG rejection ratio and the transmission of glycerol
Effect of initial concentration
The experiments were conducted at 0.4 MPa and 20 ºC (as shown in Fig. 3). It was observed that permeate flux is logarithmic with initial concentration, and these observations are consistent with the research of Nguyen et al. (2015). The change of rejection of MEG was not significant.
The transmission of glycerol decreased 6% when the initial concentration was enlarged 5 times (from 5 g/L to 25 g/L) due to ∆∏ increase hindering glycerol transport through the membrane. For the separation efficiency, a low initial concentration would be promising. However, as the initial concentration decreased, larger volume of the solution and more energy was required in the process, so 10 g/L was chosen as the suitable initial concentration.
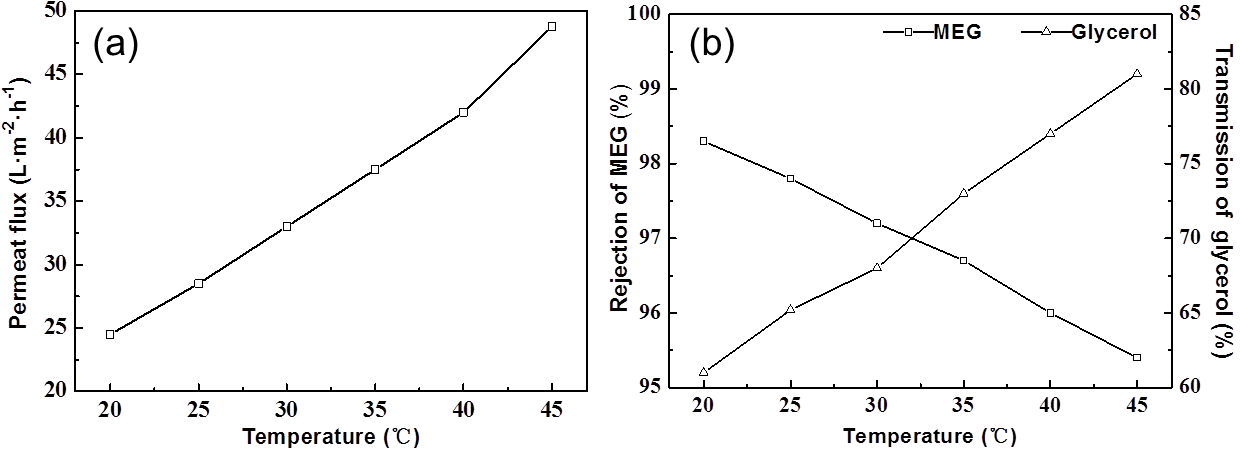
Fig. 4. (a) Effect of operating temperature on the permeate flux; (b) Effect of operating temperature on the MEG rejection ratio and the transmission of glycerol
Effect of temperature
The experiments were conducted with 10 g/L model solution at 0.4 MPa. The permeate flux was nearly a linear function of temperature (Fig. 4a). According to the solution-diffusion model, If ∆P (operating pressure) and ∆∏ (initial concentration) were constant, Aw was the only factor for permeate flux (Jp) and had linear relation with temperature.
The rejection of MEG and transmission of glycerol were noticeably linear with temperature, which indicated that solute permeability through membrane increased linearly with increasing temperature. This might be attributable to enhanced molecular movement or decreased viscosity of the solution and enlarged pore diameter in the membrane. The transmission of glycerol remarkably increased 20% when temperature increased from 20 ºC to 45 ºC, while the rejection of MEG decreased just 3%. Thus, high temperature provides the highest permeate flux and the highest MEG rejection with the highest glycerol transmission. Because the maximal tolerable temperature of NF400-600 was 45 ºC, then 40 ºC as operating temperature would be the optimum.
The optimum NF conditions were established by single factor tests: 0.4 MPa operating pressure, 10 g/L initial concentration, and 40 ºC operation temperature. Under the above conditions, the permeate flux was 42 L/(m2•h), the rejection ratio of MEG was 96%, and the transmission ratio of glycerol was 77%, as the best separation efficiency. The choice of operational conditions was also determined by the limitation of operating condition, energy-consuming economy. Thus, the optimum operating conditions should be selected according to the actual situation.
Effect of NF time
Maintaining the concentration of 10 g/L at room temperature, the permeate flux as a function of NF time under different operating pressures is shown in Fig. 5. As shown, the permeate flux declined from 0 to 1 h and then was stabilized under 0.5 and 0.6 MPa, while when the pressure was ≤ 0.4 MPa, the permeate flux was stable during all the NF time. The phenomenon of concentration polarization is the main cause of flux decrease at the beginning time under higher pressure (Bian et al. 2000; Geraldes et al. 2002).
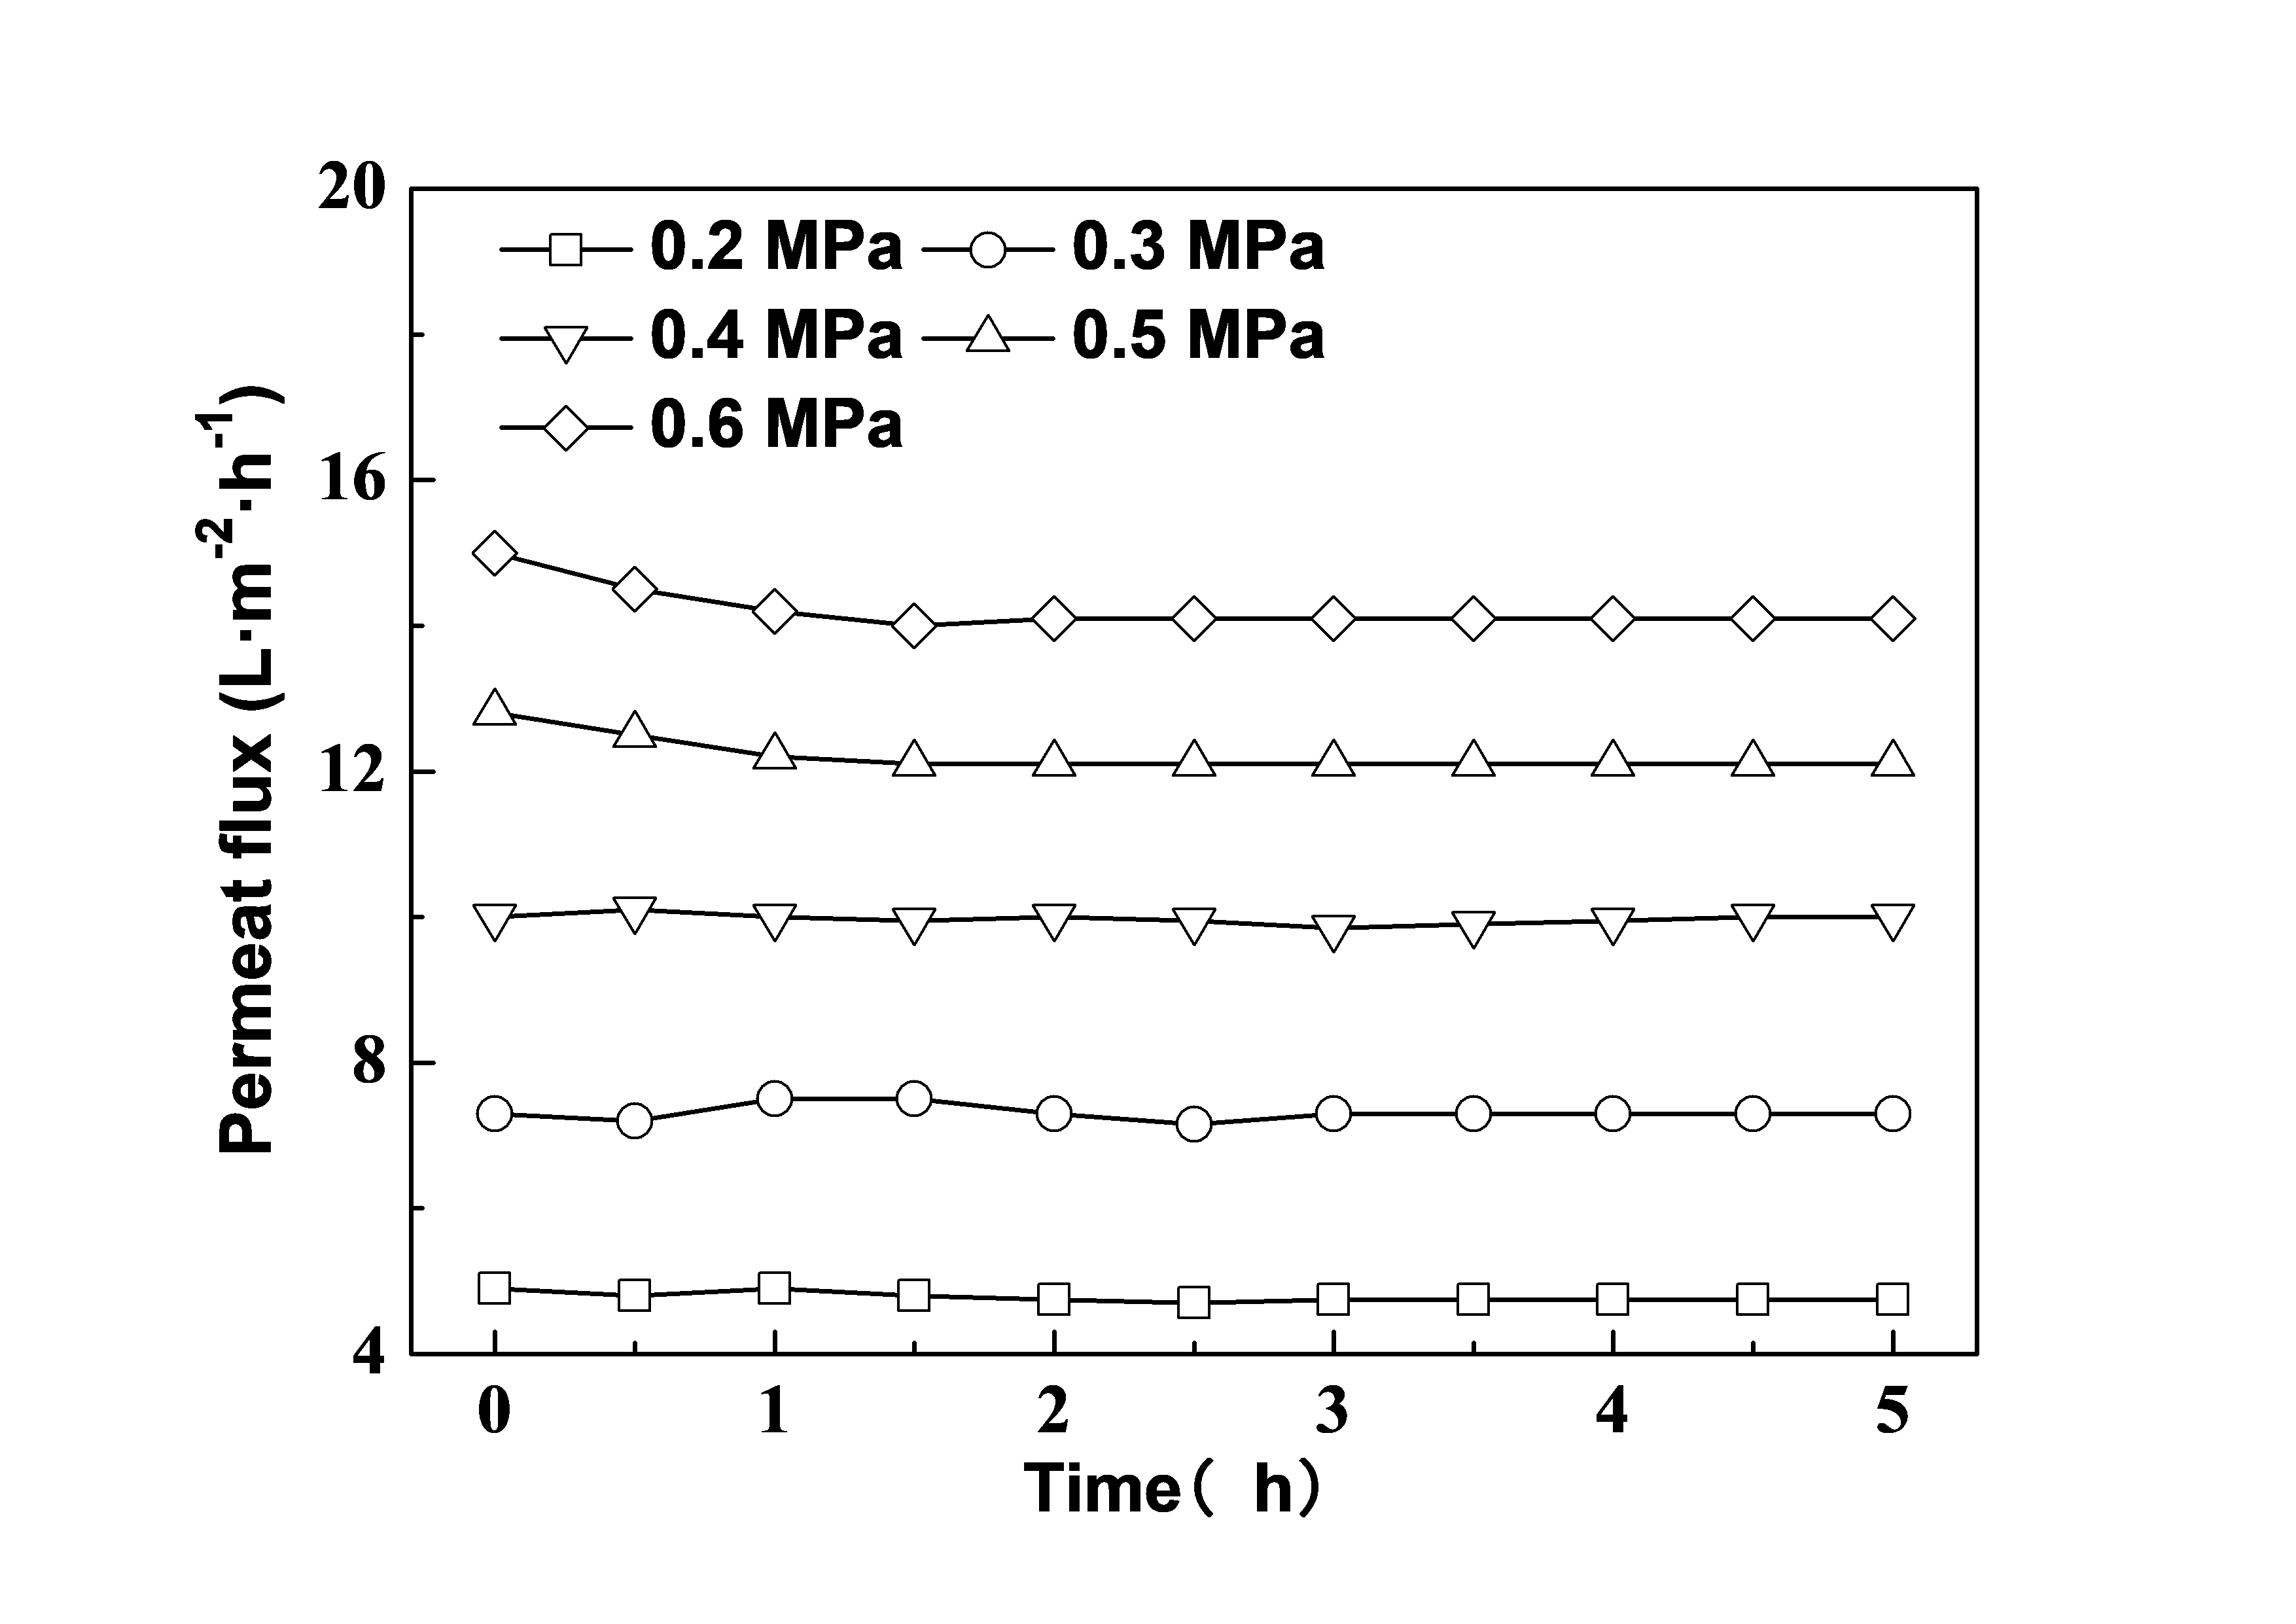
Fig. 5. Effect of nanofiltration time on the permeate flux
Effect of solute ratio
With a fixed MEG concentration of 10 g/L, Fig. 6 illustrates the impact of glycerol concentration on the nanofiltration process. The increasing glycerol concentration resulted in a slightly increasing of MEG rejection.
Meanwhile, the glycerol transmission was decreasing, which indicated that transmission through the film of MEG was slightly influenced by the changes of osmotic pressure caused by the different concentrations of glycerol. This phenomenon also demonstrated that the molecular interaction between MEG and glycerol was low (Laufenberg et al. 1996).
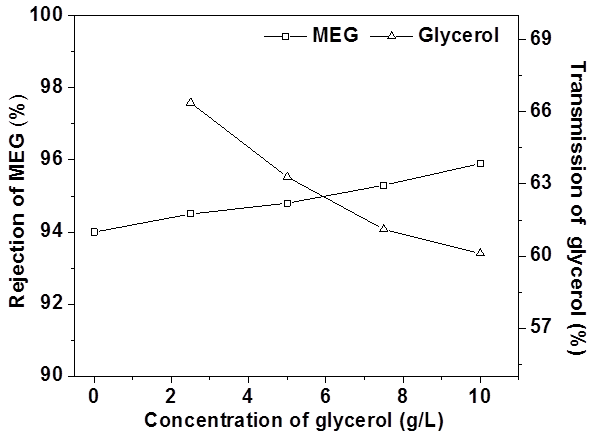
Fig. 6. Effect of concentration of glycerol on the MEG rejection and the transmission of glycerol
NF of AFMBO
Effect of pressure
Figure 7a shows that, compared with the model solution under the same conditions, the permeate flux of AFMBO was smaller, which indicated that the real situation of NF was more complex than analog. In contrast, a slope of pressure-flux (solute transmission coefficient) of AFMBO below 0.5 MPa was nearly the same as the model solution, but was remarkably decreased when the pressure was 0.5 MPa or more. According to the resistance model ( ![]() ), a high pressure resulted in high boundary layer resistance (Rp). Possible reasons of the two aspects shown in Fig. 7a were that AFMBO also contained additional substances other than MEG and glycerol, which led to an increase in osmotic pressure, formed settled layers, or clogged the membrane pores during the membrane filtration process.
), a high pressure resulted in high boundary layer resistance (Rp). Possible reasons of the two aspects shown in Fig. 7a were that AFMBO also contained additional substances other than MEG and glycerol, which led to an increase in osmotic pressure, formed settled layers, or clogged the membrane pores during the membrane filtration process.
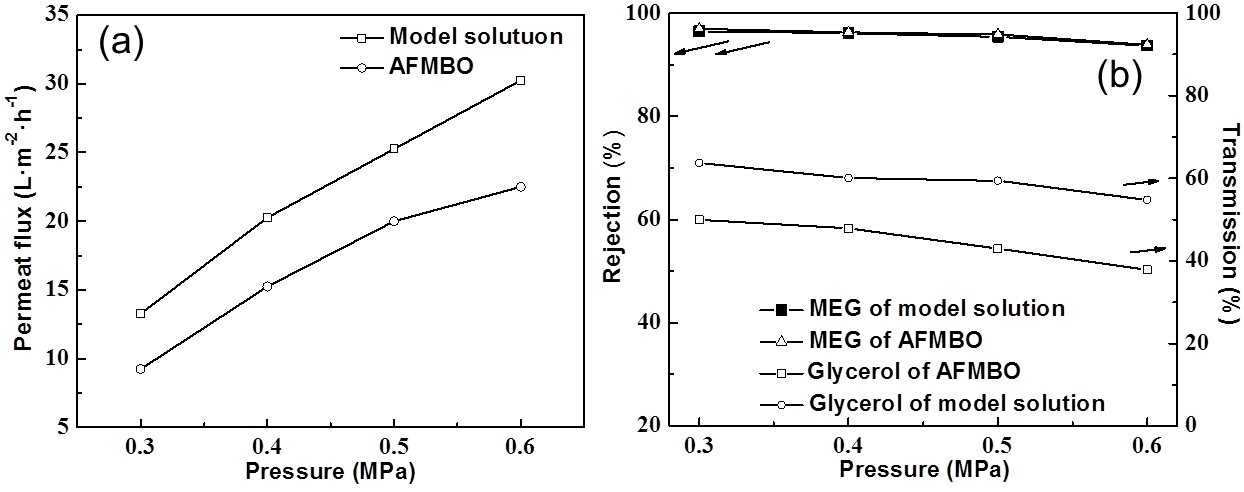
Fig. 7. (a) Effect of operating pressure on the permeate flux rejection ratio; (b) effect of operating pressure on the MEG and the transmission of glycerol
The transmission of glycerol in AFMBO was lower than that in the model solution shown in Fig. 4b, which might support the idea that partial small pores on the membrane were clogged or a more significant gel layer were formed. For rejection of MEG, the data for AFMBO and model solution under different operating pressures were almost equal, which implied that the effect of additional components for MEG was negligible.
The malonic acid content reached 6.6% of the solutes in AFMBO and was higher than any other solute except MEG and glycerol, so its separating performance was investigated in Fig. 8. The transmission of malonic acid was approximately 10% greater than glycerol under the same operating conditions according to comparisons with Fig. 7b, which implied beneficial separation with MEG but not glycerol during the filtration process. The other solutes, including phenolics, disaccharide, furans, etc., were investigated together due to close connectedness of their HPLC peaks. The same HPLC peak position of the other solutes implied a similar strong polar and molecular size as ligand-exchange and size exclusion effect with a liquid chromatographic column (SUGAR SC1011). The rejection of the other solutes increased remarkably from 76% to 88% with operating pressure due to their component complexity.

Fig. 8. Effect of operating pressure on the other solutes rejection ratio and transmission of malonic acid
For industrially relevant separation, a calculation was carried out for the pressure normalized net driving pressure (PNNDP) and pressure normalized rejection (PNR), as Table 4 shown. These findings precisely tell how the membranes are going to function at high flux that is industrially relevant and that information will be extremely useful for those who make cost calculations (Adhikari et al. 2017).
Table 4. Flux-Normalized Net Driving Pressure (FNNDP) and Flux Normalized Rejection (FNR) of the NF Membrane Screened Initially (normalized flux is 20 LMH)

These tests used feed solutions of model solution and AFMBO.
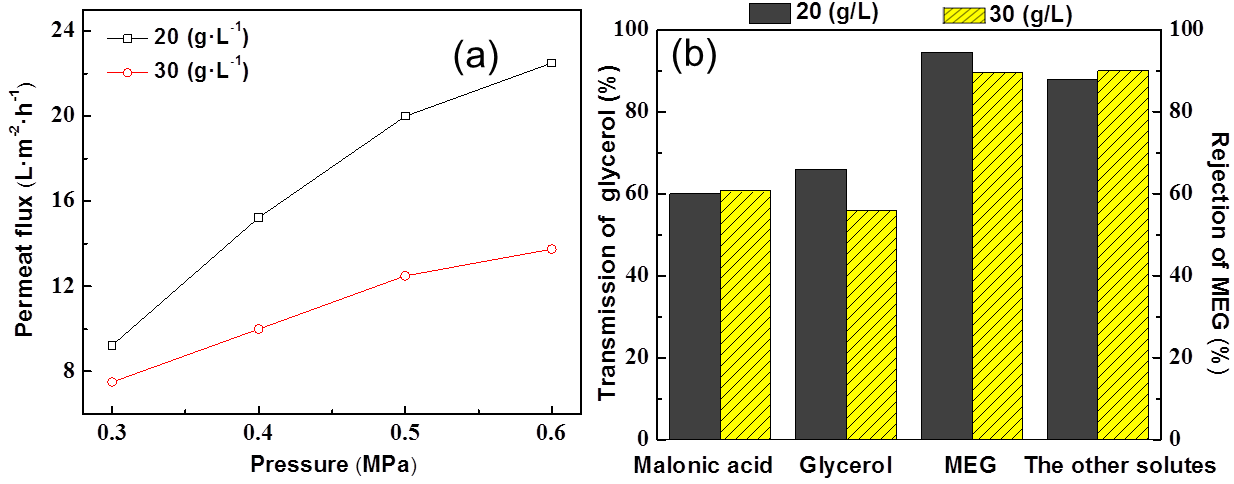
Fig. 9. (a) Effect of initial concentration on permeate flux under different pressure at 40 ºC; (b) Effect of initial concentration on rejection and the transmission under 0.4 MPa
Effect of concentration
Effect of initial concentration on permeate flux was remarkable when the operating pressure was high (the difference between permeate flux of 20 g/L and 30 g/L increased from 2 L/(m2·h) to 9 L/(m2·h) when the pressure increased from 0.3 MPa to 0.6MPa).
For the rejection of MEG/the other solutes and the transmission of molanic acid/glycerol are shown in Fig. 9b, where transmission of glycerol was most sensitive to initial concentration from 65% down to 55%. At the same time, the rejection of MEG slightly decreased, which was similar to the situation of the model solution. The transmission of malonic acid and rejection of the other solutes had almost no changes, probably due to their very low concentration.
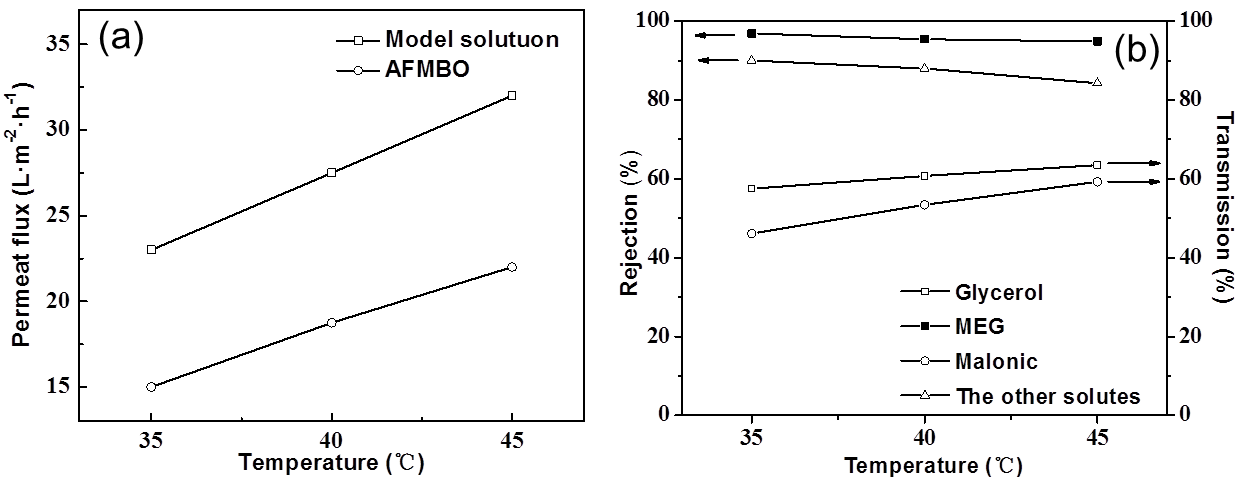
Fig. 10. (a) Effect of temperature on the permeate flux; (b) effect of temperature on rejection and transmission ratio
Effect of temperature
Experiments were conducted with 20 g/L AFMBO under 0.5 MPa to investigate the effect of temperature for the NF process (Fig. 10). Permeate flux of AFMBO increased linearly with temperature increasing, just like the model solution, but it was lower under the same temperature (Fig. 10a). This finding might be the evidence that the NF400-600 was influenced or fouled by AFMBO.
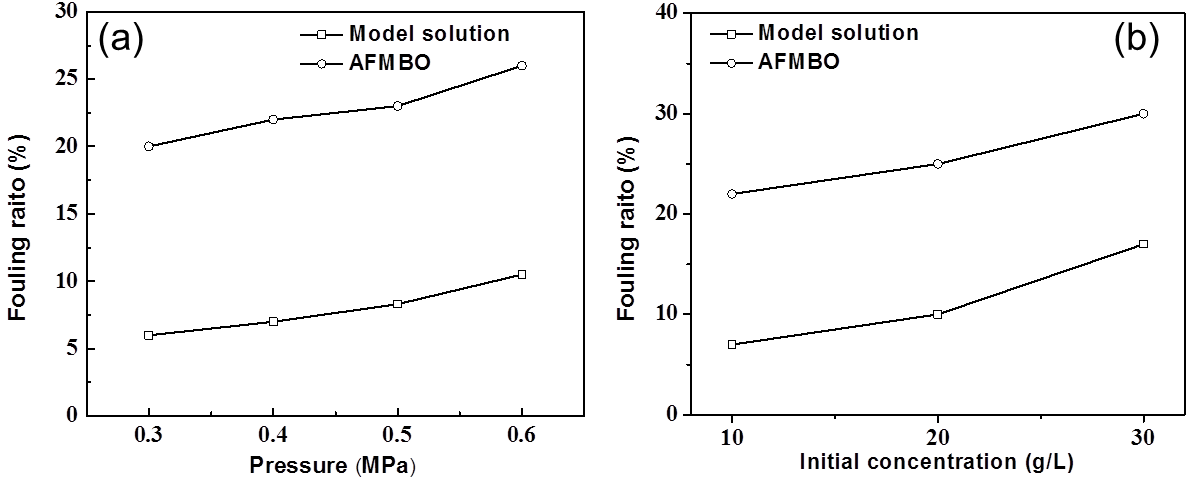
Fig. 11. (a) Effect of operating pressure on the fouling ratio; (b) effect of initial concentration on the fouling ratio
The transmission of glycerol in Fig. 10b had not changed remarkably compared with the model solution (Fig. 4b). Transmission of malonic acid noticeably increased with higher temperature. Such an increase is beneficial for malonic acid to penetrate the aromatic polyamide layer. The same situation was true for the other solutes.
Fouling and Cleaning Experiment of NF
Effect of operating condition for NF fouling
As shown in Figs. 11 and 12, for both of AFMBO and model solution, their membrane fouling rate increased with operating pressure, initial concentration, and operating temperature. Therefore, the selection of low operating pressure, concentration, and temperature was beneficial for relieving the degree of membrane fouling. The fouling rates of AFMBO were generally higher than that of the model solution under all the same operating conditions, and this fact supported the idea that the complex components of AFMBO clogging film pores led to a further decline in the permeate flux and separation performance.
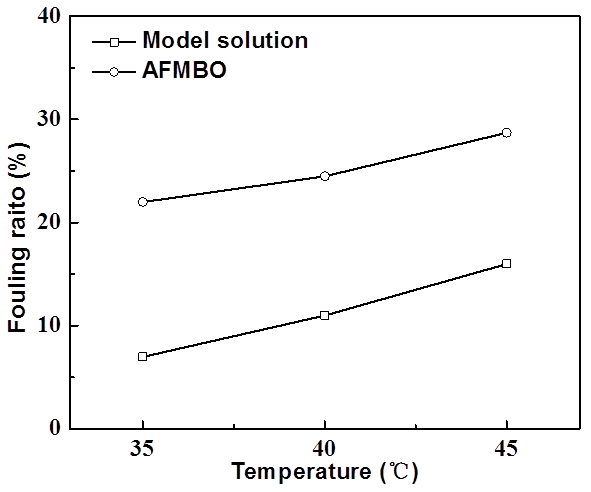
Fig. 12. Effect of operating temperature on membrane fouling ratio
Membrane cleaning experiment
Experiments were conducted with 20 g/L model solution and AFMBO to permeate NF400-600 for 30 min at operating conditions of 0.5 MPa and 35 ºC, respectively. The membrane module was cleaned by using pure water, 2 M HCl solution, 2 M NaOH solution, and detergent (2% sodium tripolyphosphate and 0.8% EDTA sodium), respectively. The results are shown in Fig. 13, which were calculated through Eq. 5.
Compared with the model solution, the WFR of AFMBO for all cleaning agents was lower, which implied that the complex components dissolved in AFMBO led to more serious, irreversible membrane fouling. Part of the evidence was that phenolics enriched on the membrane surface through concentration polarization of the filtration process formed dark yellow adsorbate due to their low solubility.
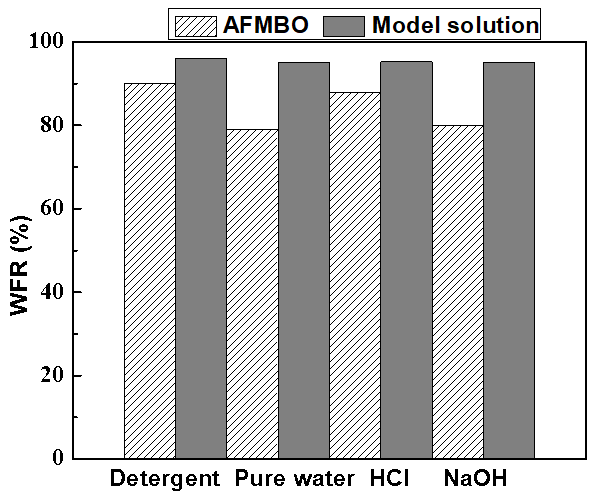
Fig. 13. Effect of cleaning agent concentration on the pH
As Fig. 13 reflects, in terms of the WFR, the model solution yielded a response to cleaning that was approximately 97% similar in response to different pH values of the cleaning agent. By contrast, the AFMBO WFR of HCl solution was especially higher than that of pure water and NaOH solution. The reason for this result might have been that the added calcium hydroxide to neutralize sulfuric acid that dissolved in the AFMBO was not removed completely though paper filter and microfiltration, and accumulation and precipitation of the forming calcium salt during the process of membrane filtration resulted in clogging pores, but a HCl solution could dissolve calcium salt and lead to higher AFMBO WFR. To verify the hypothesis, sodium tripolyphosphate and EDTA sodium, known as metal ions chelate agent, were introduced as the cleaning agent and obtained the same result as the HCl solution. Therefore, the presence of calcium ion also resulted in membrane fouling.
This experiment also indicated that the single microfiltration process before NF could not effectively prevent membrane fouling under complex circumstances. Adsorption, solution softening, flocculation, and extraction (Myint 2014) should be introduced into feed pretreatment. Further work should clarify which components caused membrane fouling and find appropriate methods to remove them.
CONCLUSIONS
Four kinds of spiral wound membrane module, which are close to actual industrial applications and suitable for large-scale production capacity, were studied in the NF experiments of model solution. The NF400-600 membrane was selected as the best membrane for the separation of MEG and glycerol from four kinds of commercially available aromatic polymeric membranes.
The best nanofiltration conditions of model solution from single factor test were with an operating pressure 0.4 MPa, an initial concentration 10 g/L, and an operation temperature 40 ºC. Under the above conditions, the permeate flux was 42 L·m-2·h-1, the methyl glucosides retention ratio was 96%, and the transmission ratio of glycerol was 77%. The result demonstrated that NF400-600 membrane has good separation performance under the above operating conditions.
The more complex constituents of AFMBO led to declines of NF400-600 permeability and separating performance compared with the model solution in the same operating conditions. Meanwhile, more serious and even irreversible membrane fouling occurred.
This research provided a reference for membrane separation industrial feasibility and application of AFMBO.
ACKNOWLEDGEMENTS
The authors gratefully acknowledge the financial support of the Taishan Scholar Program of Shandong (ts201511033), the National Natural Science Foundation of China (31670594), and the National Natural Science Foundation of Shandong Province (ZR2015BM007).
REFERENCES CITED
Adhikari, B., Jones, M. G., Orme, C. J., Wendt, D. S., and Wilson, A. D. (2017). “Compatibility study of nanofiltration and reverse osmosis membranes with 1-cyclohexylpiperidenium bicarbonate solutions,” J. Membrane Sci. 527(1), 228-235. DOI: 10.1016/j.memcsi.2016.12.017
Bellona, C., Drewes, J. E., Xu, P., and Amy, G. (2004). “Factors affecting the rejection of organic solutes during NF/RO treatment—A literature review,” Water Res. 38(12), 2795-2809. DOI: 10.1016/j.watres.2004.03.034
Bian, R., Yamamoto, K., and Watanabe, Y. (2000). “The effect of shear rate on controlling the concentration polarization and membrane fouling,” Desalination 131(1-3), 225-236. DOI: 10.1016/S0011-9164(00)90021-3
Dalwani, M., Benes, N. E., Bargeman, G., Stamatialis, D., and Wessling, M. (2011). “Effect of pH on the performance of polyamide/polyacrylonitrile based thin film composite membranes,” J. Membrane Sci. 372(1-2), 228-238. DOI: 10.1016/j.memsci.2011.02.012
Deng, W., Liu, M., Zhang, Q., Tan, X., and Wang, Y. (2010). “Acid-catalysed direct transformation of cellulose into methyl glucosides in methanol at moderate temperatures,” Chem. Commun. 46(15), 2668-2670. DOI: 10.1039/B925723C
Ducom, G., and Cabassud, C. (1999). “Interests and limitations of nanofiltration for the removal of volatile organic compounds in drinking water production,” Desalination 124(1-3), 115-123. DOI: 10.1016/S0011-9164(99)00095-8
Elliott, D. C., Hart, T. R., Neuenschwander, G. G., Rotness, L. J., and Zacher, A. H. (2009). “Catalytic hydroprocessing of biomass fast pyrolysis bio-oil to produce hydrocarbon products,” Environ. Prog. Sustain. 28(3), 441-449. DOI: 10.1002/ep.10384
El-Sukkary, M. M. A., Syed, N. A., Aiad, I., and El-Azab, W. I. M. (2008). “Synthesis and characterization of some alkyl polyglycosides surfactants,” J. Surfactants Deterg. 11(2), 129-137. DOI: 10.1007/s11743-008-1063-9
Feng, J., Jing, J., Xu, J., Wang, K., Su, Q., and Yang, Z. (2016). “Preparation of methyl-α-D-glucoside from fractionation of direct liquefied lignocellulosic biomass,” Chemistry and Industry of Forest Products 36(4), 23-30.
Geraldes, V., Semião, V., and De Pinho, M. (2002). “The effect of the ladder-type spacers configuration in NF spiral-wound modules on the concentration boundary layers disruption,” Desalination 146(1-3), 187-194. DOI: 10.1016/S0011-9164(02)00467-8
Han, I. S., and Cheryan, M. (1995). “Nanofiltration of model acetate solutions,” J. Membrane Sci. 107(1-2), 107-113. DOI: 10.1016/0376-7388(95)00107-N
Huang, H.-J., Ramaswamy, S., Tschirner, U. W., and Ramarao, B. V. (2008). “A review of separation technologies in current and future biorefineries,” Sep. Purif. Technol. 62(1), 1-21. DOI: 10.1016/j.seppur.2007.12.011
Huber, G., Cortright, R., and Dumesic, J. (2004). “Renewable alkanes by aqueous-phase reforming of biomass-derived oxygenates,” Angew. Chem. 43(12), 1549-1551. DOI: 10.1002/anie.200353050
Kamm, B. (2007). “Production of platform chemicals and synthesis gas from biomass,” Angew. Chem. 46(27), 5056-5058. DOI: 10.1002/anie.200604514
Laufenberg, G., Hausmanns, S., and Kunz, B. (1996). “The influence of intermolecular interactions on the selectivity of several organic acids in aqueous multicomponent systems during reverse osmosis,” J. Membrane Sci. 110(1), 59-68. DOI: 10.1016/0376-7388(95)00231-6
Maiti, S. K., Lukka Thuyavan, Y., Singh, S., Oberoi, H. S., and Agarwal, G. P. (2012). “Modeling of the separation of inhibitory components from pretreated rice straw hydrolysate by nanofiltration membranes,” Bioresource Technol. 114, 419-427. DOI: 10.1016/j.biortech.2012.03.029
Mussatto, S. I., and Roberto, I. C. (2004). “Alternatives for detoxification of diluted-acid lignocellulosic hydrolyzates for use in fermentative processes: A review,” Bioresource Technol. 93(1), 1-10. DOI: 10.1016/j.biortech.2003.10.005
Myint, M. T. (2014). “Using indigenous microalga species to reduce HCO3−, NH3N, NO3N, total P, Ca2+, SO42−, and Cl− from a high conductivity concentrate,” Desalination 350, 61-68. DOI: 10.1016/j.desal.2014.06.024
Nguyen, N., Fargues, C., Guiga, W., and Lameloise, M.-L. (2015). “Assessing nanofiltration and reverse osmosis for the detoxification of lignocellulosic hydrolysates,” J. Membrane Sci. 487, 40-50. DOI: 10.1016/j.memsci.2015.03.072
Pienkos, P. T., and Zhang, M. (2009). “Role of pretreatment and conditioning processes on toxicity of lignocellulosic biomass hydrolysates,” Cellulose 16(4), 743-762. DOI: 10.1007/s10570-009-9309-x
Rezaei, H., Sokhansanj, S., Bi, X., Jim Lim, C., and Lau, A. (2017). “A numerical and experimental study on fast pyrolysis of single woody biomass particles,” Appl. Energ. 198, 320-331. DOI: 10.1016/j.apenergy.2016.11.032
Teella, A., Huber, G. W., and Ford, D. M. (2011). “Separation of acetic acid from the aqueous fraction of fast pyrolysis bio-oils using nanofiltration and reverse osmosis membranes,” J. Membrane Sci. 378(1-2), 495-502. DOI: 10.1016/j.memsci.2011.05.036
Tsibranska, I. H., and Tylkowski, B. (2013). “Concentration of ethanolic extracts from Sideritis ssp. L. by nanofiltration: Comparison of dead-end and cross-flow modes,” Food Bioprod. Process. 91(2), 169-174. DOI: 10.1016/j.fbp.2012.09.004
Wang, X. L., and Nakao, S. (1988). “Permeation performation of nanofiltration membranes for systems of aqueous solution of neutral,” J. Nanjing Univ. Chem. Technol. 20, 36-40.
Watson, B. M., and Hornburg, C. D. (1989). “Low-energy membrane nanofiltration for removal of color, organics and hardness from drinking water supplies,” Desalination 72(1-2), 11-22. DOI: 10.1016/0011-9164(89)80024-4
Weng, Y.-H., Wei, H.-J., Tsai, T.-Y., Chen, W.-H., Wei, T.-Y., Hwang, W.-S., Wang, C.-P., and Huang, C.-P. (2009). “Separation of acetic acid from xylose by nanofiltration,” Sep. Purif. Technol. 67(1), 95-102. DOI: 10.1016/j.seppur.2009.03.030
Weng, Y.-H., Wei, H.-J., Tsai, T.-Y., Lin, T.-H., Wei, T.-Y., Guo, G. L., and Huang, C.-P. (2010). “Separation of furans and carboxylic acids from sugars in dilute acid rice straw hydrolyzates by nanofiltration,” Bioresource Technol. 101(13), 4889-4894. DOI: 10.1016/j.biortech.2009.11.090
Woźniak, M. J., and Prochaska, K. (2014). “Fumaric acid separation from fermentation broth using nanofiltration (NF) and bipolar electrodialysis (EDBM),” Sep. Purif. Technol. 125, 179-186. DOI: 10.1016/j.seppur.2014.01.051
Xu, J., Jiang, J., Chungyun, H., and Shupe, T. F. (2012). “Renewable chemical feedstocks from integrated liquefaction processing of lignocellulosic materials using microwave energy,” Green Chem. 14(10), 2821-2830. DOI: 10.1039/C2GC35805K
Xu, M., Li, L., Xu, J., and Wang, D. (2011). “Synthesis and characterization of alkyl polyglycoside intercalated layered double hydroxides,” J. Disper. Sci. Technol. 32(7), 1008-1013. DOI: 10.1080/01932691.2010.497458
Van der Bruggen, B., Schaep, J., Maes, W., Wilms, D., and Vandecasteele, C. (1998). “Nanofiltration as a treatment method for the removal of pesticides from ground waters,” Desalination 117(1-3), 139-147. DOI: 10.1016/S0011-9164(98)00081-2
Zellagui, S., Schönnenbeck, C., Zouaoui-Mahzoul, N., Leyssens, G., Authier, O., Thunin, E., Porcheron, L., and Brilhac, J.-F. (2016). “Pyrolysis of coal and woody biomass under N2, and CO2 atmospheres using a drop tube furnace – Experimental study and kinetic modeling,” Fuel Process. Technol. 148, 99-109. DOI: 10.1016/j.fuproc.2016.02.007
Zhao, H., Kwak, J. H., Wang, Y., Franz, J. A., White, J. M., and Holladay, J. E. (2006). “Effects of crystallinity on dilute acid hydrolysis of cellulose by cellulose ball-milling study,” Energ. Fuel. 20(2), 807-811. DOI: 10.1021/ef050319a
Article submitted: May 29, 2018; Peer review completed: August 25, 2018; Revised version received and accepted: September 20, 2018; Published: November 30, 2018.
DOI: 10.15376/biores.14.1.575-591