
Abstract
Different substrate characteristic analyses have been studied on rice and triticale straw pretreated with NMMO (N-methylmorpholine-N-oxide) prior to biogas production. Simons’ stain, water retention value (WRV), and enzymatic adsorption were used to measure the change in the accessible surface area of the lignocellulosic substrates. FTIR was used to measure the change in cellulosic crystallinity and Time-of-Flight-Secondary-Ion-Spectroscopy (ToF-SIMS) to measure the ratio of cellulose to lignin on the sample surface. All methods showed increased accessible surface area and a decrease in crystallinity after the pretreatments. These qualities were linked to improved biogas production. In the future, the tested methods could replace the time-consuming methane potential analysis to predict the methane production of lignocellulosic materials. Simons’ stain, enzymatic adsorption, and crystallinity measurement by FTIR can be regarded as the recommended methods for the prediction of the improved biogas production as a result of the pretreatment.
Download PDF
Full Article
SUBSTRATE CHARACTERISTIC ANALYSIS FOR ANAEROBIC DIGESTION: A STUDY ON RICE AND TRITICALE STRAW
Anna Teghammar,a,b,* Richard Chandra,c Jack N. Saddler,c Mohammad J. Taherzadeh,a and Ilona Sárvári Horváth a
Different substrate characteristic analyses have been studied on rice and triticale straw pretreated with NMMO (N-methylmorpholine-N-oxide) prior to biogas production. Simons’ stain, water retention value (WRV), and enzymatic adsorption were used to measure the change in the accessible surface area of the lignocellulosic substrates. FTIR was used to measure the change in cellulosic crystallinity and Time-of-Flight-Secondary-Ion-Spectroscopy (ToF-SIMS) to measure the ratio of cellulose to lignin on the sample surface. All methods showed increased accessible surface area and a decrease in crystallinity after the pretreatments. These qualities were linked to improved biogas production. In the future, the tested methods could replace the time-consuming methane potential analysis to predict the methane production of lignocellulosic materials. Simons’ stain, enzymatic adsorption, and crystallinity measurement by FTIR can be regarded as the recommended methods for the prediction of the improved biogas production as a result of the pretreatment.
Keywords: Lignocellulose; Straw; Accessible Surface Area; Simons’ Stain; Enzymatic Adsorption; FTIR Crystallinity; Anaerobic digestion; Biogas
Contact information: a: School of Engineering, University of Borås, Allégatan 1, 50190 Borås, Sweden; b: Department of Chemical and Biological Engineering, Chalmers University of Technology, 41296 Gothenburg, Sweden; c: Forest Products Biotechnology, Department of Wood Science, Main Mall 2424, University of British Colombia, Vancouver, B.C., Canada;
* Corresponding author: anna.teghammar@hb.se
INTRODUCTION
Lignocelluloses, as a possible source for biofuels, have received considerable attention in the last few decades. The focus has mainly been on ethanol production, while other biofuels such as biogas and higher alcohols have also been considered (Taherzadeh and Karimi 2008). Biogas is regarded as an energy-efficient fuel (Börjesson and Mattiasson 2008), and compared to bioethanol, biogas production from lignocelluloses could be an economically favored process, since no separate enzymatic hydrolysis is necessary. However, in order to get lignocelluloses degraded either toward ethanol or biogas production, the substrates need to be accessible to the hydrolyzing enzymes or bacteria. After pretreatment, prior to bioethanol production by Saccharomyces cerevisiae, free enzymes, such as cellulases and hemicellulases are added to hydrolyze the polymers to liberate the fermentable sugar molecules. In contrast, anaerobic digestion is performed by a complex microbiological system. The digestion starts with the degradation of these polymers by the hydrolyzing bacteria, while other bacteria and archaea in the culture ferment the liberated sugars to acetate, carbon dioxide, and hydrogen. These compounds are then converted to the end products, methane and carbon dioxide (Gerardi 2003). The hydrolyzing bacteria in anaerobic digestion do not use the free enzyme systems, but a more energy efficient cellulosome complex, which is attached to the bacterial cell wall for the hydrolysis of the polymers (Bayer et al. 2008). These cellulosome complexes are constituted of different hydrolyzing enzymes, such as cellulases, hemicellulases, as well as some ligninases and pectinases (Bayer et al. 2008) working in a synergistic manner. They attach to the cellulosic substrate with a cellulose-binding domain, while another part of the cellulosome is still attached to the bacterial cell wall. This results in a close proximity of the lignocellulosic substrate to the bacterial cells (Bayer et al. 1998, 2007, 2008).
Numerous pretreatment studies on lignocellulosic materials have been performed to improve the digestibility of the lignocelluloses (Hendriks and Zeeman 2009; Johnson and Elander 2008; Taherzadeh and Karimi 2008). Pretreatments can be mechanical, physical, chemical, biological, or a combination of these. In general, the aim of the pretreatments is to open up the structure and remove the lignin in order to improve the enzymatic accessibility (Johnson and Elander 2008) and thereby facilitate the subsequent anaerobic digestion process. Rice straw has previously been pretreated with sodium hydroxide (He et al. 2009), with a combination of hydrothermal pretreatment and sodium hydroxide (Chandra et al. 2012), and with acetic and propionic acid (Zhao et al. 2010). No study was found on the pretreatment of triticale straw prior to anaerobic digestion.
The organic solvent N-methylmorpholine-N-oxide (NMMO) was selected for the pretreatments in this study. NMMO can dissolve cellulose and decrease its crystallinity under the moderate temperatures of 90 to 130°C (Rosenau et al. 2003). NMMO has previously been shown to improve the biogas production from 0 to 30% of the theoretical yield on a cotton/polyester blend textile fibers (Jeihanipour et al. 2010). It can furthermore be recovered by more than 98%, with no chemical derivatization and no production of toxic waste pollutants (Adorjan et al. 2004). There is still, however, a lack of information on which substrate characteristics, as results of the different pretreatments, are the most important ones for improved enzymatic degradation (Mansfield et al. 1999). Several studies have been performed with the intention of correlating degradation by free enzymatic systems with different substrate characteristics after pretreatment (Chandra et al. 2007, 2009; Chang and Holtzapple 2000). The characteristics studied so far, for free enzymatic systems, were to investigate the changes in the structure as a result of the pretreatment. These are, among others, the increased surface area (Chang and Holtzapple 2000; Mansfield et al. 1999), and the decreased crystallinity. However, only one study was found in which the specific surface area was measured and related to biogas production; milling was used as the pretreatment method in this case (Palmowski and Müller 2003).
Simons’ Stain (SS) is a method that measures the pore size of the substrate by applying two different dyes: direct orange and direct blue. This technique was developed from a method used in the pulp and paper industry that measures the physical differences of the pulp fibers. The two different dyes have different particle sizes. The blue dye has a well-defined chemical formula and a diameter of 1 nm, while the orange dye is filtered to separate the large molecules from the small ones; the high weight molecular weight fraction, which is used in the analysis, has molecules with diameters of 5 to 36 nm (Yu and Atalla 1998). Moreover, the orange dye has a higher affinity for the cellulosic hydroxyl groups than the blue dye (Chandra et al. 2008; Yu and Atalla 1998). Depending on the pore sizes of the substrates, different amounts of the two dyes can be adsorbed onto the substrate. The small pores are populated with the blue dye and the large pores with the orange dye. An indication of the increased surface area of the substrate can hereby be measured (Yu et al. 1995). A modified SS method was developed (Chandra et al. 2008), which is easier to perform than the previous method; the method has shown a good correlation between the improved enzymatic hydrolysis and increased surface area (Chandra et al. 2009).
The second specific surface assessment, the Water Retention Value (WRV) is a measure of the water uptake or the swelling capacity of the substrate; thus, information on the pore characteristics can be found (Kongdee et al. 2004). Furthermore, Enzymatic Adsorption (EA) is another method that measures the amount of enzymes, that is, cellulases, which adsorb onto the substrate after a defined time. This method gives an indication on how easily accessible the material is to the enzymes; in addition, it has previously been studied as a hydrolysis indicator (Kumar and Wyman 2009; Piccolo et al. 2010). Moreover, the cellulose crystallinity has a great impact on the performance of the enzymatic hydrolysis and can be assessed with Fourier Transform Infrared Spectroscopy (FTIR) (Carrillo 2004; Jeihanipour et al. 2009; Nelson and O’Connor 1964). Cellulose crystallinity can also be measured by X-ray (Seo et al.2011) or preferably X-ray diffraction (Park et al. 2010), due to the overlap of crystalline peaks in X-ray measurements on lignocelluloses.
A new technology for structural investigations is Time-of-Flight Secondary Ion Mass Spectrometry (ToF-SIMS). ToF-SIMS measures the chemical composition on a surface not deeper than 1 nm (Vickerman and Briggs 2001). A primary ion beam ionizes the sample, followed by the release of secondary ions, which are analyzed by a high-resolution mass spectrophotometer. Only the first layer of molecules is influenced by the beam. By this method, one can study the chemical changes on the surface caused by the pretreatments.
The objective of this study was to examine whether there is the possibility to correlate the changes in the characteristics of the lignocellulosic substrates measured by any of these methods to the performance of anaerobic digestion of pretreated lignocelluloses. The chosen substrates for this study were rice and triticale straws, pretreated with the organic solvent N-methylmorpholine-N-oxide (NMMO). This is a continuation of our previous work (Teghammar et al. 2012), in which the pretreatments and the biochemical methane potential tests were performed. The results obtained by batch digestion experiments showed that depending on the pretreatment conditions, this treatment resulted in an increase in methane production by 400 to 1200% compared to that of the untreated material. Five different substrate analyses (SS, WRV, EA, FTIR, and ToF-SIMS) were performed in order to investigate the role of the substrate characteristics in the anaerobic digestion process.
EXPERIMENTAL
Materials
Two different raw materials were used: triticale straw (Triticale x Triticosecale), a hybrid of rye and wheat, obtained from a farmland nearby Borås (Sweden), and rice straw (Oryza sativa), obtained from rice fields in Yogyakarta (Indonesia). The straw substrates were cut to sizes less than 10 mm long before the pretreatments. The pretreatments were performed with 7.5 g triticale or rice straw in 100 g 85% NMMO at different conditions (130°C, 1 to 15 hours) as previously described by Teghammar et al. (2012). All substrates were freeze-dried after the pretreatment and before analysis.
The anaerobic batch digestions of treated versus untreated samples were run under thermophilic conditions for six weeks. The total volume inoculum in each flask was 40 mL, and the VS ratio was determined for each setup as two parts VS from the inoculum compared to one part VS from the substrate. All experimental setups were run in triplicate and blank reactors were run in parallel in order to determine the methane production from the inoculum. More details about the biochemical methane potential tests can be found in Teghammar et al. (2012).
Methods
Simons’ stain
Simons’ Stain (SS) analysis was performed with two dyes (Chandra et al. 2008): Direct Orange (Pomtamin Fast Orange 6RN) and Direct Blue (Pomtamin Fast Sky Blue 6BX), obtained from Pylam Products Co., (Garden City, NY, USA). In order to separate the molecules with a high molecular weight from the small molecules in the Direct Orange dye, a 100 K ultra-filter was used under nitrogen gas pressure, and the high molecular weight fraction was collected. Six samples, each corresponding to 100 mg dry weight per substrate, were weighed into six 15 mL falcon tubes. Then, 1.0 mL of phosphate-buffered saline solution (PBS) at pH 6 was added to each tube. Direct Orange and Direct Blue dyes were added from a 10 g/L stock solution in a series of increasing volumes (0.25, 0.5, 0.75, 1, 1.5, and 2 mL) from each color, respectively. This created a 1:1 mixture of Direct Orange and Direct Blue dyes with increasing volumes. Finally, distilled water was used to fill up to a total volume of 10 mL in each tube. The tubes were then incubated at 70 °C with shaking for 15 hours. After cooling down, the samples were centrifuged at 900×g for 5 minutes, and the supernatant was measured by a Varian Cary 50 UV-VIS spectrophotometer at 624 and 455 nm. The maximum adsorption was calculated using the Langmuir isotherm. The extinction coefficients were calculated from the standard curves to εO/455= 41.26, εO/624=0.36, εB/455=2.72, and εB/624=13.45 Lg-1cm-1, for orange and blue dye, respectively (Chandra et al. 2009).
Water Retention Value (WRV)
A modified version of the WRV analysis from TAPPI Useful Method UM 256 (TAPPI 1991) was performed. A sample comparable to 0.5 g oven-dried weight material was soaked in water for 72 hours prior to analysis. The samples were filtered and centrifuged at 900×g for 30 minutes, prior to drying at 105 °C (Kongdee et al. 2004). The water retention value is defined as the ratio of the weight of water retained in the sample after centrifugation to the oven-dried weight of the sample before soaking. All samples were analyzed in triplicates and standard deviations were calculated with Minitab 15® Software (Minitab, Inc., USA).
Crystallinity
An FTIR-apparatus (Nicolet iS10, Thermo Fisher Scientific, Denmark) was used to measure the cellulosic crystallinity. The crystallinity was determined using the absorption bands at 1422 and 898 cm−1 (Carrillo et al. 1964). These bands are assigned to the respective crystalline cellulose I and cellulose II, and their absorbance ratio (A1422/A898) gives the crystallinity or lateral order index (LOI). The spectra of the samples were obtained with an average of 60 scans and a resolution of 4 cm-1, from 600 to 4000 cm-1. All samples were analyzed in triplicates and standard deviations were calculated with Minitab 15® software (Minitab, Inc., USA).
Enzymatic adsorption
The enzymatic adsorption isotherms were determined after a 2 hour adsorption time at 4 oC, in 0.05 M citrate buffer at pH 4.8 and with constant shaking (Piccolo et al. 2010). A commercial cellulase mixture (Celluclast 1.5L, Novozymes, Denmark), with the enzymatic loading of 400 mg/g solid was used. The solid concentration of each sample was 50 mg in 5 mL buffer. After the 2 hour incubation time with the enzymes, the samples were centrifuged at 2000 x g for 5 minutes. Then, the concentrations of the enzymes left in the supernatant were measured (Bradford 1976), using a UV-visible spectrophotometer (UV-160A, SHMADZU Europe) at the wavelength of 595 nm. The
amount of enzymes adsorbed was calculated as the difference between the added amount of enzymes and the enzyme concentration left in the liquid after the adsorption. The experiments were run twice, and in each time in triplicates, and standard deviations were calculated with Minitab 15® software (Minitab, Inc., USA).
Time of Flight Secondary Ion Spectroscopy (ToF-SIMS)
A ToF-SIMS spectrometer (TOF-SIMS IV, IONTOF GmbH, Germany) was used to collect the secondary positive ion mass spectra. The 25 keV Bi3+ ions at a beam current of 0.11 pA and a pulse width of 150 µs were used as primary ions. The primary ion beam was rastered over a 30 x 30 µm to 150 x 150 µm area. The time for recording each spectrum was 75 seconds. Two ion masses were used for analysis of the relative intensity of lignin, at m/z 137 and 151 and two others for cellulose, at m/z 127 and 145 (Fardim and Durán 2003; Saito et al. 2006). Three pieces of straw were collected randomly from each sample, and on each piece three different spectra were collected, which resulted in a total of nine different spectra for each sample. The standard deviations were calculated relatively to the total ion intensity.
RESULTS
For improved understanding of the structural changes in triticale straw and rice straw as a result of pretreatment with NMMO, five different substrate characteristic analyses were performed. The executed analyses were Simons’ Stain (SS) in order to determine the surface and pore area, Water Retention Value (WRV) to study the increased water binding capacity, FTIR to quantify the change in cellulose crystallinity, Enzymatic Adsorption (EA) to measure the accessibility of the cellulases to the substrate, and finally ToF-SIMS to evaluate chemical changes on the surface. All analyses were performed on untreated and NMMO-pretreated triticale and rice straw samples. The results are summarized in Table 1 and Figs. 1 to 3.
Simons’ Stain
The first analysis performed on the two straw substrates was Simons’ stain. The orange dye was able to penetrate exclusively into the larger pores, while the blue dye with lower affinity for the cellulose, preferably penetrated into the smaller pores. The results shown in Fig. 1 are calculated from six different dilutions per dye and per sample, with a root mean square (Rsq) of between 0.99 and 0.92 for each dye curve and sample.
Triticale straw showed an increase of the total adsorbed dye after pretreatment compared to the untreated sample, as well as an increased total dye adsorption after longer pretreatment times (Fig. 1). The adsorption of the orange dye (with larger molecules) increased to a higher extent than the adsorption of the blue dye (with smaller molecules) after the pretreatment. The total dye adsorption after SS analysis on triticale straw increased by 30% after one hour of pretreatment, with no further improvement after 3 hours of pretreatment. However, the 15 hour pretreatment resulted in 86% increase in SS adsorption of total dye compared to the untreated material. The increase of the orange dye adsorption was the major factor for the increase of the total dye adsorption. An increase of 77, 80, and 161%, for to 1, 3, and 15 hours pretreatment times, respectively, was observed in the adsorption of the orange dye.
Table 1. A Summary of the Substrate Characteristic Analysis and Methane Production Results on Triticale and Rice Straw after NMMO Pretreatment
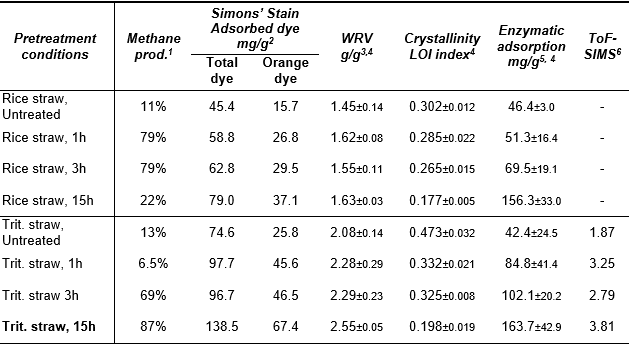
1The accumulated methane production as percentage of the theoretical potential, calculated on the basis of the initial concentration of carbohydrates in the samples, previously published in Teghammar et al. (2012). 2Adsorbed dye (mg dye/g straw) of total blue and orange dye, as well as adsorbed orange dye. For Rsq-values, see results chapter. 3g retained water/g dry sample. 4± one standard deviation is expressed with minor letters. 5 mg protein adsorbed/g solid. 6The fraction of the ion intensities of two cellulose peaks (m/z 127+145) divided by two lignin peaks (m/z 137+151); standard deviations can be seen in Fig. 3.

Fig. 1. Adsorbed dye, expressed as mg dye/g straw, from Simons’ Stain analysis on triticale and rice straw, untreated and after NMMO-pretreatment for 1 to 15 h. Grey, dotted bar shows the orange dye adsorption and black bar shows the blue dye adsorption. Trit unt – untreated triticale straw, Trit 1 h, Trit 3 h, and Trit 15 h – triticale straw after 1, 3, and 15 h treatment. Rice unt – untreated rice straw, Rice 1 h, Rice 3 h, and Rice 15 h – rice straw after 1, 3, and 15 h treatment.
Rice straw displayed the same SS pattern as triticale straw, where longer pretreatments resulted in higher total dye adsorptions. A 30, 38, and 74% increase in the total dye adsorption was obtained after 1, 3, and 15 hours of pretreatment, respectively, compared to the untreated straw. The orange dye was again responsible for the major part of the increase, with an increase of 71, 88, and 136% in adsorption after 1, 3, and 15 hours pretreatment, respectively (Fig. 1). The adsorption of the blue dye also increased for both of the straw substrates after the pretreatments; however, to a lesser extent than that of the orange dye (Fig. 1). In total, both the untreated and the pretreated triticale straw had a higher affinity for both the orange and the blue dye compared to the rice straw.
Water Retention Value
The ability of the substrate to retain water was evaluated based on the WRV, which was increased due to the pretreatment. However, the pretreatment did not cause a significant difference in the measured WRV (Table 1). Increasing treatment times of 1, 3, and 15 hours resulted in an increase in the WRV by 10, 10, and 20%, respectively, in the case of triticale straw, while rice straw showed a small increase of 10%, independent of the length of the treatment. Moreover, compared to triticale straw, rice straw displayed a 30 to 40% lower WRV both for the pretreated and untreated samples. The standard deviations indicate that the increase of water retention value is too low to be regarded as significant, with the exception of the results after 15 hours treatment compared to the untreated triticale straw (Table 1).
Crystallinity
The cellulosic crystallinity of the straw substrates was studied with FTIR. The spectra of untreated rice straw compared to NMMO-pretreated straw are presented in Fig. 2A, and the spectra of triticale straw, untreated compared to pretreated, are presented in Fig. 2B.
The LOI results in Table 1 show reduced crystallinity for both triticale and rice straw, after the pretreatments. Furthermore, it was found that the longer the pretreatment, the lower the crystallinity obtained. In the case of triticale straw, there was a decrease by 30% in the crystallinity after one hour pretreatment. Increasing the treatment time from one to three hours resulted in no further decrease in the crystallinity, while a drop in crystallinity by almost 60% was observed after the 15 hours long pretreatment compared to the untreated material.
The crystallinity changes of the rice straw samples due to NMMO-pretreatments showed a similar pattern as for the triticale straw, with reduced crystallinity after longer pretreatment times (Table 1, Figs. 2A and B). Compared with that of the untreated samples, a 5% reduction in crystallinity was obtained after 1 hour, about 15% reduction after 3 hours, and 40% reduction after the longest pretreatment for 15 hours. The total crystallinity of triticale straw cannot be compared with the total crystallinity of rice straw, since these two samples have different chemical compositions, and consequently, have different peak patterns (Figs. 2A and B).
Enzymatic Adsorption
The enzymatic adsorption is a measure of how much enzymes are adsorbed on the substrate, expressed as mg protein/g substrate (Table 1). The results show that the enzymatic adsorption on triticale straw increased due to the pretreatment, where longer pretreatment times resulted in higher enzyme adsorption values. One hour pretreatment resulted in an increase by 100%, the 3 hours by 140%, and finally, the 15 hours long pretreatment increased the enzymatic adsorption by 290%.
NMMO-pretreatment resulted in lower increase in the enzymatic adsorption values in the case of rice straw (Table 1). After pretreatment for 1 hour, an 11% increase in enzymatic adsorption was obtained, followed by 50% increase after 3 hours pretreatment, compared to that of the untreated straw. The 15 hours pretreatment resulted in an increase in enzymatic adsorption by 240%.

Fig. 2A: FTIR spectra from Rice Straw showing peak pattern for cellulose LOI crystallinity index. (a) – untreated rice straw, (b) – 1 h NMMO-pretreatment, (c) – 3 h pretreatment, and (d) – 15 h NMMO- pretreated rice straw. Fig. 2B: FTIR spectra from Triticale Straw showing peak pattern for cellulose LOI crystallinity index. (a) – untreated triticale straw, (b) – 1 h NMMO-pretreatment, (c) – 3 h pretreatment, and (d) – 15 h NMMO-pretreated triticale straw.
Time of Flight Secondary Ion Spectroscopy
The results of ToF-SIMS analysis show the differences in the chemical composition on the outer molecular layer of the straw samples caused by the pretreatment with NMMO (Fig. 3). The intensity of both lignin and cellulose peaks increased after the pretreatments. Moreover, the ratio of cellulose to lignin also increased due to the pretreatment, and the increase was larger for the longer treatment times (Table 1). The ratio of cellulose to lignin was calculated as the relative ion intensity of both cellulose peaks divided by the relative ion intensity of both lignin peaks, and this was increased by 74, 50, and 104% after 1, 3, and 15 hours long treatments, respectively, compared to that of the untreated samples. ToF-SIMS analysis that was performed in a similar way on the rice straw samples did not produce evaluable results. This is due to the different chemical composition of rice straw, with additional peaks in the rice straw spectra, interfering with the peaks of interest.

Fig. 3. Relative ion intensity from ToF-SIMS analysis on triticale straw after NMMO-pretreatment. Four different peaks were analyzed, m/z 127 and 145 for cellulose, 137 and 151 for lignin. Trit unt – untreated triticale straw, Trit 1 h, Trit 3 h, and Trit 15 h – triticale straw after 1, 3, and 15 h treatment. The error bars show ± one relative standard deviation.
DISCUSSION
In order to study the structural changes after pretreatment, different substrate analyses have been performed, and the results are summarized in Table 1. The methane production determined in our previous study (Teghammar et al. 2012), as a result of the pretreatment with NMMO on rice and triticale straw, is presented as a percentage of the theoretical maximum methane production per gram carbohydrates in Table 1. The increased methane production after the pretreatments can be explained by the fact that the organic solvent NMMO breaks the hydrogen bonds between the adjacent polysaccharide chains (Zhao et al. 2007), and the lignocellulosic structure becomes more open and more accessible to the bacterial enzymes. This is in line with the results corresponding to structural changes in the material investigated by different methods in this study. Each of these analyses indicates that the accessible surface area of the straw samples studied was increased after the pretreatment. Longer pretreatments generally generate higher methane yields; however, the 15 h treatment of rice straw resulted in a lower methane yield than the shorter pretreatments, although higher surface area was found. Longer NMMO pretreatments can, depending on the nature of the substrate, reduce the reactivity of lignocelluloses, with degradation of some parts of the cellulose and thermal runaway reactions as a consequence (Rosenau et al. 2001). These effects can have a negative impact on the biogas production.
Simons’ stain is an analysis that measures the inner and outer surface area of the substrate. The increased adsorption of the two dyes used indicates the existence of more and/or larger pores (Fig. 1). Since the orange dye has a bigger molecular size of 5 to 36 nm (Yu and Atalla 1998), compared to a typical bacterial cellulase of approximately 4 to 16 nm (Palmowski and Müller 2003), the enzyme can penetrate into a pore at all the places where the orange dye can. Accordingly, the adsorption of the orange dye gives us a good indication of how accessible the substrate is for the enzymes. The increased adsorbed orange dye after the pretreatment indicates an increase in the biodegradability of the substrate, which in turn will result in an increased biogas production (Table 1). A correlation between Simons’ stain and increased enzymatic hydrolysis after pretreatment on lodgepole pine has been found by Chandra et al.(2009). However no previous study on Simons’ stain prior to biogas production has been performed previously.
The increase in biodegradability can also be explained by a decrease in the crystallinity of cellulose fibers. This characteristic was measured by FTIR, and the lateral order index (LOI) at 1422/898 cm-1 was determined. LOI provides an indication on the transition from cellulose I to cellulose II within the regenerated cellulose after NMMO-treatments. The absorption band at 1422 cm-1 representing cellulose I was decreased after the pretreatment, while the band at 898 cm-1 representing cellulose II was increased (Figs. 2A and B). This decrease in cellulosic crystallinity after NMMO-pretreatment was previously found on pure cellulose, and it was correlated to an increase in enzymatic digestion (Jeihanipour et al. 2009). Since the cellulose binding module (CBM) of the cellulosome complex bind more effectively to amorphous than to crystalline cellulose (Bayer et al. 2008), the decrease of the crystallinity is of great value, as this could increase the binding of the cellulosome complex to the substrate, thereby increasing the anaerobic degradability.
The accessibility of the substrate for cellulose hydrolyzing enzymes was also measured by determining the enzymatic adsorption of added cellulases onto pretreated versus untreated lignocellulosic substrates. This method displays how easily the enzymes are adsorbed onto the substrate. Our results show that there is a link between the measured accessible surface area and the enzymatic adsorption. The total binding of the cellulases was increased after the pretreatment, which can be explained by an increase in the accessible surface areas on the substrates (Table 1). This is in line with the results of Piccolo et al. (2010) where surface area, enzymatic adsorption and enzymatic hydrolysis rate were connected. Furthermore, Kumar and Wyman (2009) found a correlation between increased enzymatic adsorption and glucan hydrolysis prior to ethanol production. This increased accessible surface area is a result of more and larger pores present in the structure and was determined by the Simons’ stain method (Fig. 1). The enzymatic accessibility is also influenced by the cellulosic crystallinity. Due to the treatment, the compact structure of the lignocellulosic substrate, wherein the lignin physically shields the cellulosic and hemicellulosic parts, becomes more open. Moreover, the degradation of lignin was confirmed by ToF-SIMS analysis, showing less lignin compared to cellulose on the surface of the pretreated straws (Fig. 3).
The ToF-SIMS analysis measures the chemical composition on the actual surface of the material. Higher cellulose content compared to lignin on the lignocellulosic surface supports higher enzymatic accessibility. It was previously reported that the lignin content of lignocelluloses affects the ability of enzymes to reach the substrate, while the crystallinity prolongs the degradation process (Chang and Holtzapple 2000). Both the degradation of lignin (Table 1, Fig. 3) and the decrease in crystallinity (Figs. 2A-B) were proved as results of the treatment by the analyses used, and both could be associated with an improved biogas production (Table 1).
The water retention value shows the ability of the substrate to swell. Water adsorption occurs mainly in amorphous regions (Kongdee et al. 2004), which makes WRV an indicator for changes of crystalline regions to more amorphous regions. The WRV results in this study show a slightly increased WRV on both straws after the treatments. The water absorption capacity also depends on pore volume, size, and surface area (Kongdee et al. 2004). We can, therefore, conclude that the results of WRV (Table 1) can also be associated with the results obtained by SS (Table 1, Fig. 1) on both straws.
All analysis methods demonstrated the enhancement of the accessible surface area after NMMO-pretreatment, leading to higher biogas production. However, there were differences in the behavior of the two straws. In general, triticale straw showed a larger accessible surface area compared to the rice straw, according to results obtained from Simons’ stain, water retention value, and enzymatic adsorption tests (Table 1). One explanation for this fact is that triticale has a lower ash content (3%) compared to rice straw (23%) (Teghammar et al. 2012). This high ash content could have a significant influence on the accessibility of the enzymes. Additionally to the higher ash content, rice straw has a high content of silica, which has shown a lower digestibility by animal rumen (Van Soest 2006). The silica has been found in a waxy, cuticular layer and is thought to limit the digestion of the tissue underneath. Both high ash content and high silica content could have an impact on the lower accessible surface area on rice straw compared to triticale straw. In contrast, cellulosic crystallinity measured by the LOI index displays higher crystallinity on rice straw compared to triticale straw.
In summary, anaerobic digestion by biogas bacteria is enhanced by a high accessible surface area in order for the hydrolytic enzymes to reach and degrade the lignocellulosic substrate. Simons’ stain is a promising method, which can analyze the pore size and distribution on the substrate and thereby give us useful information of the accessible surface area. The water retention value is a complementing method measuring the pore size and volume, however, with less sensitivity and being less informative than SS. Cellulosic crystallinity can provide useful information of the substrate characteristics and can easily be measured with FTIR. ToF-SIMS is an expensive and time-consuming analysis, which makes it less interesting. The last method, enzymatic adsorption, is influenced by the three factors cellulose crystallinity, lignin over cellulose ratio, and pore structure.
CONCLUSIONS
- An increase of the accessible surface area on lignocelluloses can be linked to improved biogas production.
- The accessible surface area can be measured by substrate characteristic analyses, such as Simons’ stain, enzymatic adsorption, cellulose crystallinity by FTIR, ToF-SIMS, and water retention value. The accessible surface area measured by the above mentioned methods proved to have an importance in biogas production.
- Simons’ stain, cellulose crystallinity by FTIR, and enzymatic adsorption were shown to be the most informative analysis methods.
- The substrate characteristic analyses could be alternatives in the future to the time-consuming methane potential analysis, in order to predict methane production from lignocellulosic-rich materials.
ACKNOWLEDGEMENTS
We thank Dr. Lena Brivé, SP Technical Research Institute of Sweden, Borås, for the experimental support of the ToF-SIMS measurements. This work was financially supported by the Swedish Excellence Centre Waste Refinery and the Post-Graduate School Polytechnic Waste Research in Sweden.
REFERENCES CITED
Adorjan, I., Sjöberg, J., Rosenau, T., Hofinger, A., and Kosma, P. (2004). “Kinetic and chemical studies on the isomerization of monosaccharides in N-methylmorpholine-N-oxide (NMMO) under Lyocell conditions,” Carbohydrate Research 339(11), 1899-1906.
Bayer, E. A., Chanzy, H., Lamed, R., and Shoham, Y. (1998). “Cellulose, cellulases and cellulosomes,” Current Opinion in Structural Biology 8(5), 548-557.
Bayer, E. A., Henrissat, B., and Lamed, R. (2008). “The cellulosome: A natural bacterial strategy to combat biomass recalcitrance,” Biomass Recalcitrance, Himmel, M. E. (ed.), Blackwell Publishing, 407-435.
Bayer, E. A., Lamed, R., and Himmel, M. E. (2007). “The potential of cellulases and cellulosomes for cellulosic waste management,” Current Opinion in Biotechnology 18(3), 237-245.
Bradford, M. M. (1976). “A rapid and sensitive method for the quantitation of microgram quantities of protein utilizing the principle of protein-dye binding,” Analytical Biochemistry 72, 248-254.
Börjesson, P., and Mattiasson, B. (2008). “Biogas as a resource-efficient vehicle fuel,” Trends in Biotechnology 26(1), 7-13.
Carrillo, F., Colom, X., Suñol, J. J., and Saurina, J. (2004). “Structural FTIR analysis and thermal characterization of lyocell and viscose-type fibres,” European Polymer Journal 40, 2229-2234.
Chandra, R., Ewanick, S., Hsieh, C., and Saddler, J. N. (2008). “The characterization of pretreated lignocellulosic substrates prior to enzymatic hydrolysis, Part 1: A modified Simons’ staining technique,” Biotechnology Progress 24(5), 1178-1185.
Chandra, R., Takeuchi, H., and Hasegawa, T. (2012). “Hydrothermal pretreatment of rice straw biomass: A potential and promising method for enhanced methane production,” Applied Energy 94, 129-140.
Chandra, R. P., Bura, R., Mabee, W. E., Berlin, A., Pan, X., and Saddler, J. N. (2007). “Substrate pretreatment: The key to effective enzymatic hydrolysis of lignocellulosics?” Adv Biochem Engin/Biotechnol 108, 67-93.
Chandra, R. P., Ewanick, S. M., Chung, P. A., Au-Yeung, K., Del Rio, L., Mabee, W., and Saddler, J. N. (2009). “Comparison of methods to assess the enzyme accessibility and hydrolysis of pretreated lignocellulosic substrates,” Biotechnology Letters 31(8), 1217-1222.
Chang, V. S., and Holtzapple, M. T. (2000). “Fundamental factors affecting biomass enzymatic reactivity,” Appl. Biochem. Biotechnol. 84-86, 5-37.
Fardim, P., and Durán, N. (2003). “Modification of fibre surfaces during pulping and refining as analysed by SEM, XPS and ToF-SIMS,” Colloids and Surfaces A: Physiochem. Eng. Aspects 223, 236-276.
Gerardi, M. H. (2003). The Microbiology of Anaerobic Digesters, John Wiley & Sons, Inc.
He, Y., Pang, Y., Li, X., Liu, Y., Li, R., and Zheng, M. (2009). “Investigation on the changes of main compostitions and extractives of rice straw pretreated with sodium hydroxide for biogas production,” Energy and Fuels 23, 2220-2224.
Hendriks, A. T. W. M., and Zeeman, G. (2009). “Pretreatments to enhance the digestibility of lignocellulosic biomass,” Bioresource Technology 100(1), 10-18.
Jeihanipour, A., Karimi, K., Niklasson, C., and Taherzadeh, M. J. (2010). “A novel process for ethanol or biogas production from cellulose in blended-fibers waste textiles,” Waste Management 30(12), 2504-2509.
Jeihanipour, A., Karimi, K., and Taherzadeh, M. J. (2009). “Enhancement of ethanol and biogas production from high-crystalline cellulose by different modes of NMO pretreatment,” Biotechnology and Bioengineering 105(3), 469-476.
Johnson, D. K., and Elander, R. T. (2008). “Pretreatments for enhanced digestability of feedstocks,” Biomass Recalcitrance, Himmel, M. E. (ed.), Blackwell Publishing, 436-453.
Kongdee, A., Bechtold, T., Burtscher, E., and Scheinecker, M. (2004). “The influence of wet/dry treatment on pore structure – the correlation of pore parameters, water retention and moisture regain values,” Carbohydrate Polymers 57, 39-44.
Kumar, R., and Wyman, C. E. (2009). “Cellulase adsorption and relationship to features of corn stover solids produced by leading pretreatments,” Biotechnology and Bioengineering103(2), 252-267.
Mansfield, S., Mooney, C., and Saddler, J. N. (1999). “Substrate and enzyme characteristics that limit cellulose hydrolysis,” Biotechnol. Prog. 15, 804-816.
Nelson, M. L., and O’Connor, R. T. (1964). “Relation of certain infrared bands to cellulose crystallinity and crystal lattice type. Part I. Spectra of lattice types I, II, III and amorphous cellulose,” Appl. Polym. Sci. 8, 1311-1324.
Palmowski, L., M., and Müller, J. A. (2003). “Anaerobic degradation of organic materials – significance of the substrate surface area,” Water Science and Technology 47(12), 231-238.
Park, S., Baker, J., Himmel, M., Parilla, P., and Johnson, D. (2010). “Cellulose crystallinity index: Measurement techniques and their impact on interpreting cellulase performance,” Biotechnology for Biofuels 3(1), 10.
Piccolo, C., Wiman, M., Bezzo, F., and Liden, G. (2010). “Enzyme adsorption on SO2 catalyzed steam-pretreated wheat and spruce material,” Enzyme and Microbial Technology 46, 159-169.
Rosenau, T., Hofinger, A., Potthast, A., and Kosma, P. (2003). “On the conformation of the cellulose solvent N-methylmorpholine-N-oxide (NMMO) in solution,” Polymer 44(20), 6153-6158.
Rosenau, T., Potthast, A., Sixta, H., and Kosma, P. (2001). “The chemistry of side reactions and byproduct formation in the system NMMO/cellulose (Lyocell process),” Progress in Polymer Science 26(9), 1763-1837.
Saito, K., Kato, T., Takamori, H., Kishimoto, T., Yamamoto, A., and Fukushima, K. (2006). “A new analysis of the depolymerized fragments of lignin polymer in the plant cell wall using ToF-SIMS,” Applied Surface Science 252, 6734-6737.
Seo, D.-J., Fujita, H., and Sakoda, A. (2011). “Structural changes of lignocelluloses by a nonionic surfactant, Tween 20, and their effects on cellulase adsorption and saccharification,” Bioresource Technology 102(20), 9605-9612.
Taherzadeh, M. J., and Karimi, K. (2008). “Pretreatment of lignocellulosic wastes to improve ethanol and biogas production: A review,” Int. J. Mol. Sci. 9(9), 1621-1651. Epub 2008 Sep 1621.
TAPPI (1991). “Water Retention Value – Useful Method 256.” http://www.tappi.org/zziMIS-Data/Products/Water-retention-value-WRV.aspx.
Teghammar, A., Karimi, K., Sárvári Horváth, I., and Taherzadeh, M. J. (2012). “Enhanced biogas production from rice straw, triticale straw and softwood spruce by NMMO pretreatment,” Biomass and Bioenergy 36(0), 116-120.
Van Soest, P. J. (2006). “Rice straw, the role of silica and treatments to improve quality,” Animal Feed Science and Technology 130(3-4), 137-171.
Vickerman, J. C., and Briggs, D. (2001). “ToF-SIMS: Surface analysis by mass spectrometry,” IM Publications and SurfaceSpectra Limited.
Yu, X., and Atalla, R. H. (1998). “A staining technique for evaluating the pore structure variations of microcrystalline cellulose powders,” Powder Technology 98, 135-138.
Yu, X., Minor, J. L., and Atalla, R. H. (1995). “Mechanism of action of Simons’ stains,” TAPPI Journal 78(6), 175-180.
Zhao, H., Kwak, J. H., Wang, Y., Franz, J. A., White, J. M., and Holladay, J. E. (2007). “Interactions between cellulose and N-methylmorpholine-N-oxide,” Carbohydrate Polymers 67(1), 97-103.
Zhao, R., Zhang, Z., Zhang, R., Li, M., Lei, Z., Utsumi, M., and Sugiura, N. (2010). “Methane production from rice straw pretreated by a mixture of acetic–propionic acid,” Bioresource Technology 101(3), 990-994.
Article submitted: May 3, 2012; Peer review completed: June 26, 2012; Revised version received and accepted: July 5, 2012; Published: July 10, 2012.