
Abstract
Surface and dynamic viscoelastic properties of the reproduction cork from Quercus variabilis were studied in detail. There were 16 chemical elements in the Q. variabilis cork determined by the energy dispersive spectrometric (EDS) spectrum, and the contents of C and O were the highest. The mean colorimetric parameters L*, a*, and b* were 60.8, 14.0, and 30.6, respectively. The surface contact angles of Quercus variabilis cork were measured using an automatic contact angle meter. Three different types of liquid media (distilled water, formamide, and diiodomethane) were respectively dropped on the surface of corks using a microsyringe. The initial contact angles of water, formamide, and diiodomethane on the cork surface were 112.0°, 85.1°, and 75.2°, and the corresponding values decreased to 102.1°, 30.7°, and 72.1° when the liquids permeated the cork surface for 10 s. The moisture content values were 4.3%, 6.0%, and 9.0% when the dry cork samples were placed in the relative humidity conditions of 45%, 65%, and 85%, respectively, for 30 days. FT-IR spectra indicated the content of suberin in the sclereids and lenticels was much less than the content found in the pure corks. In the dynamic mechanical analysis (DMA) spectrum, three obvious relaxation processes could be observed in the tan δ curve.
Download PDF
Full Article
Surface and Dynamic Viscoelastic Properties of Cork from Quercus variabilis
Jingjing Li,a Junjie Bi,a Xiaozhou Song,a Wencheng Qu,b and Dongmei Liu *,c
Surface and dynamic viscoelastic properties of the reproduction cork from Quercus variabilis were studied in detail. There were 16 chemical elements in the Q. variabilis cork determined by the energy dispersive spectrometric (EDS) spectrum, and the contents of C and O were the highest. The mean colorimetric parameters L*, a*, and b* were 60.8, 14.0, and 30.6, respectively. The surface contact angles of Quercus variabilis cork were measured using an automatic contact angle meter. Three different types of liquid media (distilled water, formamide, and diiodomethane) were respectively dropped on the surface of corks using a microsyringe. The initial contact angles of water, formamide, and diiodomethane on the cork surface were 112.0°, 85.1°, and 75.2°, and the corresponding values decreased to 102.1°, 30.7°, and 72.1° when the liquids permeated the cork surface for 10 s. The moisture content values were 4.3%, 6.0%, and 9.0% when the dry cork samples were placed in the relative humidity conditions of 45%, 65%, and 85%, respectively, for 30 days. FT-IR spectra indicated the content of suberin in the sclereids and lenticels was much less than the content found in the pure corks. In the dynamic mechanical analysis (DMA) spectrum, three obvious relaxation processes could be observed in the tan δ curve.
Keywords: Quercus variabilis; Cork; Surface properties; Viscoelasticity
Contact information: a: College of Forestry, Northwest A&F University, Yangling, 712100, China; b: State-owned Houzhenzi Ecological Experimental Forest Farm of Zhouzhi County, Zhouzhi, 710409, China; c: College of Humanities & Social Development, Northwest A&F University, Yangling, 712100, China; *Corresponding author: liudongmeirenwen@126.com
INTRODUCTION
Cork, or the phellem, is found in the periderm of oak trees. It is generated by the activity of phellogen, a secondary meristem, which produces phellem on the outside and the phelloderm on the inside of the outer bark of cork trees (Pereira et al. 1987). Cork is a natural and closed-cell biological material with a set of excellent properties, such as low density and low permeability to gases and liquids, admirable insulation, wear-resistance, durability, and chemical stability (Silva et al. 2005; Pereira 2015).
Cork is most commonly obtained from Quercus suber (Q. suber) in western Mediterranean coastal countries, especially in Portugal, where the output of cork amounted to ca. 100,000 tons in 2015 (Knapic et al. 2016). In China, however, cork is mainly obtained from Quercus variabilis Blume (Q. variabilis), which is a wide-spread oak tree of the family Fagaceae. The horizontal distribution of Q. variabilis in China is mainly in the area between 22 and 42°N latitude and 99 and 122°E longitude. The annual output of Chinese cork is ca. 50,000 tons (Lei et al. 2013; Song and Zhao 2017a,b).
In recent years, there have been a number of studies on Q. variabilis cork. Lei et al. (2012) and Miranda et al. (2013) investigated the main chemical components and monomer compositions of Q. variabilis cork. Song et al. (2017a,b) analyzed the characteristics of the cellular structure of cork and morphological distribution of plasmodesma, and tested the mechanical properties of the cell wall of cork by nano-indentation. Song et al. (2018) determined the influence of different steam treatments on the main physical properties of Q. variabilis cork. However, compared with Q. suber cork, some properties of Q. variabilis cork have not been completely characterized and need further investigation.
To utilize cork materials more efficiently, it is critical to understand their surface properties, which significantly impact bonding, dyeing, and other modification processes. In addition, the viscoelastic and rheological properties of cork can be determined by dynamic mechanical analysis (DMA) in different conditions such as temperature, frequency, and pressure applications, and the application of cork can be broadened by understanding these performances. Mano (2002) studied the dynamic viscoelasticity of Q. suber cork in the temperature range from -40 °C to 120 °C by DMA. Paiva and Magalhães (2017) conducted DMA tensile testing of Q. suber cork in the axial and radial directions, showing that there was a broad phase transition in the temperature range from 10 °C to 25 °C, dependent on the direction of tensional testing. However, there have been no reports on the examination of Q. variabilis cork by DMA technology.
In this study, the surface properties and the dynamic viscoelasticity of cork from Q. variabilis were studied in detail. The objectives of this work were to contribute to the characteristic knowledge of Chinese cork for industrial processing and to provide basic data to promote its potential application in China.
EXPERIMENTAL
Materials
Reproduction cork from Q. variabilis was obtained from Qinba Mountain, located in the southwest region of the Shaanxi province of China. The cork specimens were collected in August 2015. They were air-dried in the laboratory until their moisture content was approximately 6%. The number of growth rings for the Q. variabilis cork was 15 to 20. The average thickness of the cork planks was 18 mm, and the average density was 0.28 g/cm3.
The samples were cut from 30 planks of reproduction cork and trimmed into cubes with edges parallel to the three principal directions in the tree (Leite and Pereira 2017). The dark and hard layer on the surface of cork was removed. The three sections of samples were ground until they were flat and cleaned with compressed air.
Methods
Surface element testing
The cork materials were processed into cubes with side lengths of 5 mm to 8 mm. The cubic samples were cut with a sharp knife to obtain a planar surface. Thin sections (120 μm) were dried and coated with 200 Å of gold palladium (Hitachi MC1000, Tokyo, Japan). The cork cell structure of the transverse section was observed using the FE-SEM (Hitachi S-4800) and the surface elements of the cork samples were analyzed using X-ray energy dispersive spectrometric analysis (EDS, EDAX Apollo XL, Mahwah, NJ, USA), which was the accessory equipment of FE-SEM.
Surface color determination
The surface color of the Q. variabilis cork was measured with an SC-80C Automatic Differential Colorimeter (SC-80C, Kang guang Inc., Beijing, China), and the color data was characterized according to the Commission Internationale ed I’ Eclairage L*a*b* color space. The lightness index (L*), red-green index (a*), yellow-blue index (b*), saturation (c*), and hue value (h) were recorded. For each colorimetric parameter of a sample, three points were measured on the tangential section and the average value was chosen as the final result. The size of the sample for color test was 30 mm × 30 mm × > 6 mm (axial × tangential × radial). The color parameter tests were repeated 30 times.
Surface contact angle measurement
Impurity-free cork samples with dimensions of 16 mm × 16 mm × 8 mm were chosen to conduct surface contact angle testing using a CA-W automatic contact angle meter (Kyowa Interface Science Co., Saitama, Japan). Under the ambient temperature of 20 ± 2 °C, three different types of liquid media (distilled water, formamide, and diiodomethane) were respectively dropped on the surface of samples using a microsyringe. The surface tension values of distilled water, formamide, and diiodomethane are 72.8 mN/m, 58.0 mN/m, and 50.8 mN/m, respectively. The spread of the droplet was video recorded and screen captured based on the theory of optical imaging. Images of the contact angle from 0 s to 10 s were recorded and the contact angles were measured and calculated using the ring method.
Moisture absorption testing
Cork samples were dried in an oven at the temperature of 103 ℃ until the weight change of the samples before and after drying was less than 0.05%. Then the cork samples were separately placed into a conditioning chamber at a temperature of 20 ± 2 °C and relative humidities of 45%, 65%, and 85%. The moisture absorption of the cork samples was measured at regular intervals. The size of the sample for moisture absorption test was 20 mm × 20 mm × 8 mm. Each test was repeated 30 times. The moisture absorption was calculated by Eq. 1,
M = (M1 – M0)/M0 ×100% (1)
where M is the moisture content (%), M0 is the mass of dry cork sample (g), and M1 is the mass of the cork sample after moisture absorption at different times (g).
FT-IR
Pure cork and its impurities, including lenticels tissues and sclereids, were obtained by manual operation. The samples were ground and dried at 103 °C for 24 h before the pellet preparation. The 2.5 mg samples were mixed and ground with 250 mg KBr and dried for 24 h in a vacuum over anhydrous P2O5. The mixture was used to prepare pellets, which were analyzed in the absorption mode FT-IR with a resolution of 4 cm-1 and 64 scans accumulation. The FT-IR spectra of pure cork and its lenticel tissues and sclereids were recorded.
Dynamic viscoelasticity testing
The viscoelastic properties of cork were determined using a dynamic mechanical analyzer (DMA, Mettler Toledo DMA 1, TA Instrument, New Castle, DE, USA). The tangential samples were tested in tensile mode. Air dried samples had a rectangular shape with typical dimensions of 10 mm × 5.0 mm × 2.0 mm (tangential× radial × axial). Experiments samples were tested at a fixed frequency of 1 Hz and maximum amplitude of 15 µm. The samples were scanned in the temperature range from -100 °C to 300 °C with a heating rate of 5 °C/min under a nitrogen atmosphere. The viscoelastic behaviors of cork were investigated by following the evolution of the storage modulus (E’) and the loss factor (tan δ) as functions of temperature.
RESULTS AND DISCUSSION
Macroscopic Surface Characterization of Q. variabilis Cork
The appearance of the Q. variabilis cork is shown in Fig. 1. The surface of virgin cork (Fig. 1b) was uneven, and there were some deep and wide cracks along the longitudinal direction. On the contrary, the surface of the reproduction cork (Fig. 1a) was even and the cracks on the surface were much shallower and more consistent. Some impurities, including lenticels tissues and sclereids, were observed in the tangential section (Fig. 1c) after the removal of the dark and hard layer on the surface of reproduction cork. Lenticels, which are generated by phellogen, consist of loose cells with large spaces between each other. In the transverse section of reproduction cork (Fig. 1e), lenticels appeared as stripy channels, most of which travelled along the entire thickness of cork. Those stripy channels were loose and filled in by dark brown tissues. The sclereid is hard and looks like sandstone. Its density is high and its distribution is random. The white irregular spots in the radial (Fig. 1d) and tangential (Fig. 1c) sections were sclereids.
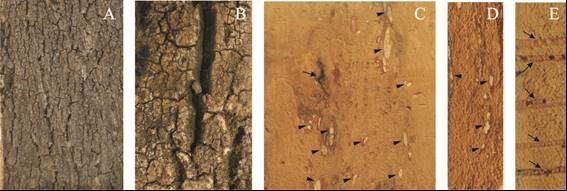
Fig. 1. The appearance of the Q. variabilis corks, (A) the reproduction cork, (B) the virgin cork (control sample), (C) the tangential section of the reproduction cork, (D) the radial section of the reproduction cork, (E) the transverse section of the reproduction cork, arrowhead: sclereid, arrow: lenticel tissues
Lenticels can form holes during cork processing and affect the quality of cork products. Sclereids can affect the mechanical machining of cork and cause damage to machining tools. Although the content of impurities in reproduction Q. variabilis cork is less than that of virgin cork, the impurities can have a negative effect on the processing and application of cork. Therefore, impurities, whether in reproduction cork or virgin cork from Q. variabilis, should be removed as much as possible (Zhao et al. 2015).
Compared with Q. suber cork, the Q. variabilis cork is also a typical heterogeneous cellular material. However, some differences in chemical composition and cellular structure between the two materials can be found. The content of impurities in Q. variabilis cork is higher than that in Q. suber cork, and the average thickness of cork stripped from the Q. variabilis tree is much smaller (Ferreira et al. 2016).
The Analysis of Surface Element
The cellular structure of Q. variabilis cork is similar to that of Q. suber cork. The tangential section displays a honeycomb-like structure and the transverse and radial sections display a brick wall-type structure with a regular radial alignment of the cells in parallel rows (Pereira 1988). The chemical elements from the transverse section of the reproduction cork determined by the EDS spectrum are shown in Table 1. There were 16 different chemical elements on the surface of the Q. variabilis cork, including C, O, P, N, Ca, Si, Cu, Fe, K, etc. (the H element cannot be tested).
Table 1. The Elements Analysis of the Reproduction Q. variabilis Cork
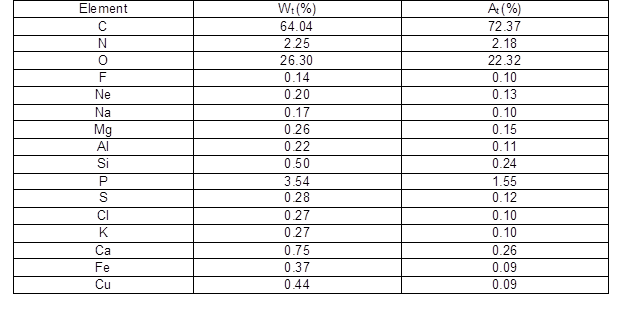
The main chemical component of the cork is suberin, followed by lignin and holocellulose in lower concentrations (Lei et al. 2012). Suberin is a macromolecule formed by the ester coupling of fatty alcohols, fatty acids and diacids, hydroxy fatty acids and glycerol, and ferulic acid and other phenolic components (Graça and Pereira 1997). Hence, the elements C and O were found in greater amounts than the others. The weight percentage and atomicity percentages of carbon were 64.0% and 72.4%, respectively. Oxygen was the second most abundant element with corresponding weight percentages and atomicity percentages of 26.3% and 22.3%. The weight contents of the elements P and N were 3.54% and 2.25%, and the atomicity percentages were 1.55% and 2.18%, respectively. In addition, there were 7 metal elements detected in the cork samples, including Fe, Na, Mg, Al, K, Ca, and Cu. The total weight percentage of the metal elements was 2.48%. The Ca content in the cork materials was the highest of metal elements, which was in accordance with the previous report performed by Ponte-e-Sousa and Neto-Vaz (2011). Cu is an essential trace element during the growth period of plants, but large amounts of Cu can be toxic to plants (Soares et al. 1993). The Mg element is interpreted as a dislocation of the metal for active vegetal zones when suberization starts, and the Na element is an acid neutralizer used for the transformation in suberin of corks (Ponte-e-Sousa and Neto-Vaz 2011).
The Analysis of Surface Color
The color of the cork can be specified in terms of the three parameters lightness (L*), red-green index (a*), and yellow-blue index (b*). The colorimetric parameters of the reproduction cork from Q. variabilis are listed in Table 2. Among the color coordinates, the L* was in the range of 57.6 to 66.8, and the mean value was 60.8. This indicated the L* was relatively high due to the strong reflection of visible light on the cork surface after removal of the dark and hard layer. The a* and b* were in the range of 10.6 to 16.0 and 27.7 to 32.8. The mean values of a* and b* were 14.0 and 30.6, respectively. The positive values of a* and b* reflected a small proportion of red radiation (650 nm) and a huge proportion of yellow radiation (580 nm) in the reflectance spectrum (Dubey et al. 2011). In addition, the mean values of saturation (c*) and hue (h) were 33.7 and 65.4, respectively.
Table 2. The Colorimetric Parameters of the Reproduction Cork from Q. variabilis

Surface Contact Angle
The surface contact angle can quantify the wettability, spread, and adhesion of the cork surface by a liquid. Only when the surface tension of the liquid is equal to or less than the surface free energy of cork can liquids spread completely on cork surface. The contact angle is relatively small at this time. The contact angles of three types of liquids (distilled water, formamide, and diiodomethane) on the cork surface were measured from 0 s to10 s to analyze the wettability of the cork surface, and the results are shown in Fig. 2.
At the very beginning stage of droplet formation, the cork surface could be considered to be in a stable thermodynamic state. However, the contact angle changed with time due to the influence of the surrounding environment. According to Fig. 2, the initial contact angles of distilled water, formamide, and diiodomethane on the cork surface were 112.0°, 85.1°, and 75.2°, respectively. These liquids presented different surface tensions and contact angles, since water is polar, formamide is semi-polar, and diiodomethane is nonpolar. In this study, the initial contact angles of all three liquids were large, which indicated that none of them were able to wet cork easily.
The initial contact angle of water on the cork surface was the largest. After 10 s, the contact angles of all three liquids decreased, and the contact angle of formamide decreased more quickly than that of distilled water and diiodomethane. The surface contact angles of distilled water, formamide, and diiodomethane at 10 s were 91.2%, 36.1%, and 95.9% of their initial contact angles at 0 s, respectively.
The measurement of the contact angles of the cork surface may be affected by several factors: impurities in the cork can affect the contact angle; liquid should not be dropped on the lenticel of cork surface, otherwise the droplet will spread quickly and penetrate the cork; liquid should not be dropped on the area where sclereids accumulate, otherwise the droplet will not be able to spread and wet the cork surface.
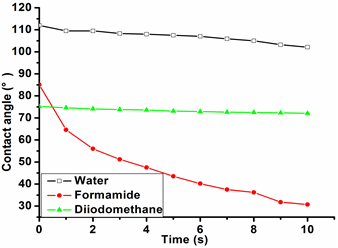
Fig. 2. The contact angles of three liquids on the cork surface from Q. variabilis as a function of time
The Analysis of Moisture Absorption
The surface contact angle results showed that water did not easily wet the cork surface. In order to further verify the relationship between cork and water, the hygroscopic property of cork was investigated in this study. The moisture content of cork is one of the most important parameters for technological processing. It is often associated with temperature and relative humidity (RH). Figure 3 shows the variation of cork moisture content in different humidity conditions as a function of time (with a stationary temperature of 20 °C). The moisture absorption levels of the cork gradually increased with the increase of time and the relative humidity of the ambient. The moisture content values were 2.44%, 3.15%, and 4.54% when the dry cork samples were placed in the RH conditions of 45%, 65%, and 85% for just 1 day. After 30 days, the moisture content values were 4.28%, 6.05%, and 8.97%, respectively. As expected, the moisture absorption of cork samples increased very slowly with the increase of time.
The main components of cork cell wall are suberin (33% to 50%), lignin (20% to 25%), polysaccharide (12% to 20%), and extractives (14% to 18%)(Song et al. 2017b). The suberin and paraffin contribute to the good hydrophobicity of corks (Rosa et al. 1990). Therefore, the moisture absorption of cork under different humidity conditions is a very slow process, and this process is mainly related to the physical adsorption of moisture. Some lenticels exist in the cork as lenticular channels through the transverse section. These channels are filled with loosely attached cells and allow water to penetrate into the cork. Therefore, the content and pore diameter of lenticels will affect the hygroscopicity of cork significantly. In addition, the hygroscopicity of cork is also affected by the polysaccharide component, since the hydrophilic groups, such as hydroxy and methoxy groups, can bond with water molecules through the hydrogen bonds.
In addition to environmental humidity, temperature is also an important factor which impacts the hygroscopicity of cork. The effect of temperature on the hygroscopicity, together with the hysteresis between adsorption and desorption of cork, need to be further investigated.
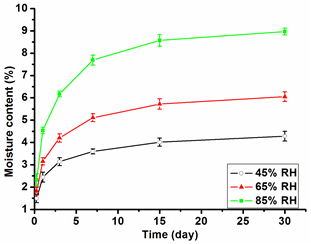
Fig. 3. The variation of cork moisture content in different humidity conditions under 20 °C
FT-IR Spectra Analysis
The FT-IR spectra of pure cork and its lenticel tissues and sclereids are shown in Fig. 4. The spectrum of pure cork was different from those of the sclereids and lenticel tissues due to the differences in structure and chemical composition. The prominent peaks at 2914 cm-1 and 2847 cm-1 were attributed to the asymmetric and symmetric vibrations of the C-H group, and the peak at 1731 cm-1 was ascribed to the vibration of the C=O group from aliphatic fatty esters. All these strong peaks were the characteristics of the suberin composition in the pure cork material. However, these three peaks were relatively weak in the spectra of sclereids and lenticel tissues. This indicated that the content of suberin in the impurities was much less than that in the pure corks. This result was consistent with reports by Zhao et al. (2013). According to their works, the contents of suberin in the sclereids, lenticel tissues, and pure corks were 1.65%, 2.20%, and 38.93%, respectively (Zhao et al. 2013).
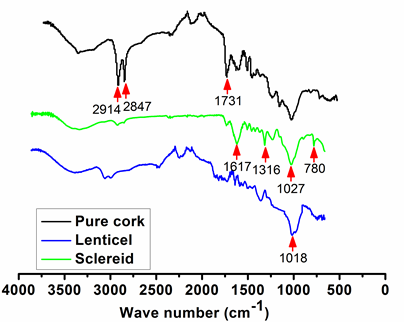
Fig. 4. The FT-IR spectra of the pure cork, sclereid, and lenticel
For the FT-IR spectrum of the sclereids, the peaks at 1617 cm-1, 1316 cm-1, and 780 cm-1 were assigned to the O-H stretching vibration of calcium oxalate monohydrate. This inorganic crystal is widely distributed in plants, including bark tissues (Trockenbrodt 1995; D’Antonio et al. 2009; Șen et al. 2012). In addition, the absorption peaks at 1027 cm-1 and 1018 cm-1, which corresponded to the C-O stretching vibration of polysaccharides, were strong in the corks with sclereids and lenticel tissues.
The properties of lenticels and sclereids are different from the pure cork due to the differences in chemical composition, cell arrangement, cell size, intercellular gap, and intracellular contents. Hence, the efficient removal of these impurities in the Chinese cork industry needs more research.
DMA Analysis of Cork
The study of the relaxation process observed in the DMA spectra may be important in the understanding of the impact resistance, sound-absorption, and frictional properties of cork (Anjos et al. 2011). The tensile DMA results of the reproduction cork samples are shown in Fig. 5, displaying the storage modulus (E’) and the loss factor (tan δ) as functions of temperature. Figure 5a showed that the storage modulus decreased with the increase of temperature due to the softening of cork material. In the early stage (ca. -100 °C to 20 °C), a strong decrease in E’ could be detected. In addition, it should be noticed that there was a slight increase in E’ in the vicinity of 100 °C, which was likely because of the desorption of water molecules. Three relaxation peaks were found in the tan δ curve. A low temperature relaxation was observed at ca. -20 °C. This transition could be attributed to the motion of the side chains of cork polymers. The second relaxation process was observed at ca. 75 °C, which was likely due to the melting of cork’s component. Maybe it also could be attributed to the presence of water molecules. Silva et. al (2005) attributed this peak in tan δ to the melting of waxes present in cork. Because of the complex structure and chemical composition of cork cells, it was difficult to attribute this relaxation process to a well-identified polymeric fraction in cork material. The third relaxation process was detected at ca. 250 ℃, and this transition could be ascribed to the microbrownian motion of the amorphous substances or polymers in cork cell wall (Sugiyama et al. 1998). Furthermore, it could be seen that the tan δ value at 250 °C was much higher than the value found at other temperatures. It indicated that the polysaccharide composition of cork was thermally decomposed in this temperature range, with more energy dissipating.
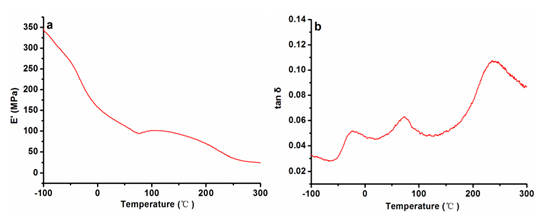
Fig. 5. The storage modulus (E’) and loss factor (tan δ) of the reproduction cork from Q. variabilis as functions of temperature
The tension DMA results of natural cork from Q. suber showed a broad transition between 10 °C and 25 °C (Paiva and Magalhães 2017). In this study, no remarkable peak was observed within this temperature range. More research in Q. variabilis cork should be carried out in order to confirm this relaxation process.
CONCLUSIONS
1. There were 16 chemical elements in the Q. variabilis cork determined by the energy dispersive spectrometric analysis (EDS) spectrum, and the contents of C and O were the highest. The mean colorimetric values of L*, a*, and b* of the Q. variabilis cork were 60.8, 14.0, and 30.6, respectively.
2. The initial contact angles of water, formamide, and diiodomethane on the cork surface were 112.0°, 85.1°, and 75.2°, and the related values decreased to 102.1°, 30.7°, and 72.1° when the liquids permeated the cork surface for 10 s. The moisture content values were 4.3%, 6.0%, and 9.0% when the dry cork samples were placed in the relative humidity conditions of 45%, 65%, and 85% for 30 days. These results demonstrated that the cork was a hydrophobic material.
3. Reproduction cork from Q. variabilis had some impurities. Fourier transform infrared (FT-IR) spectra indicated the content of suberin in the sclereids and lenticels was much less than the content of suberin found in the pure corks.
4. In the dynamic mechanical analysis (DMA) spectrum, three obvious peaks could be detected in the tan δ curve. The transition at -20 °C was attributed to the motion of the side chains of cork polymers. The peak at 75 °C was probably due to the melting of cork’s component, and the peak at 250 °C was due to the microbrownian motion of the amorphous substances or polymers in cork cell wall.
ACKNOWLEDGMENTS
This research was financially supported by the National Natural Science Foundation of China, Grant No. 31470583. The authors also acknowledge International Scientific and Technological Cooperation Seed Foundation of Northwest A&F University.
REFERENCES CITED
Anjos, O., Pereira, H., and Rosa, M. E. (2011). “Tensile properties of cork in axial stress and influence of porosity, density, quality and radial position in the plank,” European Journal of Wood and Wood Products 69(1), 85-91. DOI: 10.1007/s00107-009-0407-0
D’Antonio, M. C., Wladimirsky, A., Palacios, D., Coggiolaa, L., González-Baró, A. C., Baran, E. J., and Mercader, R. C. (2009). “Spectroscopic investigations of iron(II) and iron(III) oxalates,” Journal of the Brazilian Chemical Society 20(3), 445-450. DOI: 10.1590/S0103-50532009000300006
Dubey, M. K., Pang, S. S., and Walker, J. (2011). “Effect of oil heating age on colour and dimensional stability of heat treated Pinus radiata,” European Journal of Wood and Wood Products 69(2), 255-262. DOI: 10.1007/s00107-010-0431-0
Ferreira, J., Miranda, I., Sḛn, U., and Pereira, H. (2016). “Chemical and cellular features of virgin and reproduction cork from Quercus variabilis,” Industrial Crops and Products 94, 638-648. DOI: 10.1016/j.indcrop.2016.09.038
Graça, J., and Pereira, H. (1997). “Cork suberin: A glyceryl based polyester,” Holzforschung 51(3), 225-234. DOI: 10.1515/hfsg.1997.51.3.225
Knapic, S., Oliveira, V., Machado, J. S., and Pereira, H. (2016). “Cork as a building material: A review,” European Journal of Wood and Wood Products 74(6), 775-791. DOI: 10.1007/s00107-016-1076-4
Lei, J. P., Xiao, W. F., and Liu, J. F. (2013). “Distribution of Quercus variabilis Blume and its ecological research in China,” World Forestry Research 26(4), 57-62.
Lei, Y. F., Jia, T., and Song, X. Z. (2012). “Chemical composition of cork from Quercus variabilis,” Wood and Fiber Science 44(2), 214-219.
Leite, C., and Pereira, H. (2017). “Cork-containing barks – A review,” Frontiers in Materials 3, 63. DOI: 10.3389/fmats.2016.00063.
Mano, J. F. (2002). “The viscoelastic properties of cork,” Journal of Materials Science 37(2), 257-263. DOI: 10.1023/A:1013635809035
Miranda, I., Gominho, J., and Pereira, H. (2013). “Cellular structure and chemical composition of cork from the Chinese cork oak (Quercus variabilis),” Journal of Wood Science 59(1), 1-9. DOI: 10.1007/s10086-012-1300-8
Paiva, D., and Magalhães, F. D. (2017). “Dynamic mechanical analysis and creep-recovery behavior of agglomerated cork,” European Journal of Wood and Wood Products 76(1), 133-141. DOI: 10.1007/s00107-017-1158-y
Pereira, H. (1988). “Chemical composition and variability of cork from Quercus suber L.,” Wood Science and Technology 22(3), 211-218. DOI: 10.1007/BF00386015
Pereira, H. (2015). “The rationale behind cork properties: A review of structure and chemistry,” BioResources 10(3), 6207-6229. DOI: 10.15376/10.3.6207-6229
Pereira, H., Rosa, M. E., and Fortes, M. A. (1987). “The cellular structure of cork from Quercus suber L,” IAWA Journal 8(3), 213-218. DOI: 10.1163/22941932-90001048
Ponte-e-Sousa, J. C. A. A. A., and Neto-Vaz, A. M. (2011). “Cork and metals: a review,” Wood Science and Technology 45(1), 183-202. DOI: 10.1007/s00226-009-0288-8
Rosa, M. E., Pereira, H., and Fortes, M. A. (1990). “Effects of hot water treatment on the structure and properties of cork,” Wood and Fiber Science 22(2), 149-164.
Șen, A., Marques, A., V., Gominho, J., and Pereira, H. (2012). “Study of thermochemical treatments of cork in the 150–400 ℃ range using colour analysis and FTIR spectroscopy,” Industrial Crops and Products 38, 132-138. DOI: 10.1016/j.indcrop. 2012 .01.018
Silva, S. P., Sabino, M. A., Fernandes, E. M., Correlo, V. M., Boesel, L. F., and Reis, R. L. (2005). “Cork: Properties, capabilities and applications,” International Materials Reviews 50(6), 345-365. DOI: 10.1179/174328005X41168
Soares, M. E., Bastos, M. L., and Ferreira, M. A. (1993). “Determination of copper, iron, aluminium, lead and cadmium in cork stoppers by electrothermal atomic absorption spectrometry,” Journal of Analytical Atomic Spectrometry 8(4), 655-657. DOI: 10.1039/ja9930800655
Song, X. Z., Shangguan, W. W., Zhang, L., Yuan, Y. D., and Lei, Y. F. (2018). “Effect of different boiling treatments on physical properties of cork from Quercus variabilis,” BioResources 13(2), 2411-2423. DOI: 10.15376/biores.13.2.2411-2423
Song, X. Z., and Zhao, J. F. (2017a). “Ultrastructural study of plasmodesmata in cork cells from Quercus variabilis Blume (Fagaceae),” Industrial Crops and Products 97, 275-280. DOI: 10.1016/j.indcrop.2016.12.027
Song, X. Z., Zhu, L. Y., Wu, S. Q., and Lei, Y. F. (2017b). “Structural and mechanical properties of cork cell walls from Quercus variabilis Blume (Fagaceae),” Wood Research 62(6), 873-882.
Sugiyama, M., Obataya, E., and Norimoto, M. (1998). “Viscoelastic properties of the matrix substance of chemically treated wood,” Journal of Materials Science 33(14), 3505-3510. DOI: 10.1023/A:1004678506822
Trockenbrodt, M. (1995). “Calcium oxalate crystals in the bark of Quercus robur, Ulmus glabra, Populus tremula and Betula pendula,” Annals of Botany 75(3), 281-284. DOI: 10.1006/anbo.1995.1022
Zhao, J. F., Feng, D. J., Lei, Y. F., Zhang, W. H., and Zhang, Y. J. (2013). “Cell structure and chemical components of sclereids and lenticels from Quercus variabilis cork,” Journal of Northwestern A&F University (Natural Science Edition) 41(7), 119-124. DOI: 10.13207/j.cnki.jnwafu.2013.07.005
Zhao, J. F., Song, X. Z., Feng, D. J., Lei, Y. F., and Zhang, Y. J. (2015). “Expansion and impurity removal technology for Quercus variabilis cork,” Journal of Northwestern A&F University (Natural Science Edition) 43(5), 87-92. DOI: 10.13207/j.cnki.jnwafu.2015.05.001
Article submitted: July 17, 2018; Peer review completed: October 28, 2018; Revised version received and accepted: November 24, 2018; Published: November 30, 2018.
DOI: 10.15376/biores.14.1.607-618