
Abstract
Surface properties include both surface roughness and friction. With a stylus-type contact method, it is necessary to obtain either a surface roughness profile or a friction profile that is affected by stylus shape and size, its contact force on the sample, the scan speed, and the data acquisition rate. As a new surface parameter, the mean absolute deviation (MAD) from an average property has been introduced. It represents the deviation from either the roughness average (Ra) and the average coefficient of friction (COF), respectively. While Ra or average COF depends on the instrument and its operating conditions, the MAD should not depend on them because it represents the variations within the sample.
Download PDF
Full Article
Surface Characterization of Paper Products via a Stylus-type Contact Method
Na Young Park,a Young Chan Ko,a Hyoung Jin Kim,a,* and Byoung Geun Moon b
Surface properties include both surface roughness and friction. With a stylus-type contact method, it is necessary to obtain either a surface roughness profile or a friction profile that is affected by stylus shape and size, its contact force on the sample, the scan speed, and the data acquisition rate. As a new surface parameter, the mean absolute deviation (MAD) from an average property has been introduced. It represents the deviation from either the roughness average (Ra) and the average coefficient of friction (COF), respectively. While Ra or average COF depends on the instrument and its operating conditions, the MAD should not depend on them because it represents the variations within the sample.
Keywords: Surface roughness; Friction; Surface profile; Stylus; Mean absolute deviation; MAD; R-MAD; F-MAD; Paper products
Contact information: a: Department of Forest Products and Biotechnology, Kookmin University, 77 Jeongneung-ro, Seongbuk-gu, Seoul 02707 Republic of Korea; b: Consumer Product Division Packaging Technology Center, Korea Conformity Laboratories, 199, Gasan Digital 1-ro, Geumcheon-gu, Seoul, 08503, Republic of Korea; *Corresponding author: hyjikim@kookmin.ac.kr
GRAPHICAL ABSTRACT
INTRODUCTION
Surface characterization is important and has many applications in the paper industry. As such, surface characterization is necessary in developing a papermaking process, e.g., wet-end chemistry, drying, coating, printing, embossing, and laminating (Pino et al. 2010; Samyn et al. 2011; Schlegel et al. 2011). All these processes involve contact between at least two surfaces; therefore, their surface characterization is important. Surface characterization is also necessary to improve the qualities of a product, e.g., the bulk, strength, printability, adhesion, and wettability (Ko et al. 1981; Hollmark 1983a, 1983b; Hodgson and Berg 1988; Ampulski et al. 1991; Modaressi and Garnier 2002; van Kuilenburg et al. 2013; Wang et al. 2018; Ko et al. 2019).
Surface properties include both roughness, and friction. The former is static and topographical and describes the geometry of the surface (ISO 13565-1 1996; ISO 3274 1996; ISO 4287 1997).
In determining the surface roughness of paper and paperboard, three types of the methods are currently available: non-contact type, indirect type, and contact type (Jeong et al. 2019). Meanwhile, only a contact type may be used to determine surface friction.
The optical-profiler or laser-profiler method belongs to this group (Léger et al. 1975; Hladnik and Lazar 2016). These methods do not touch the surface of a sample, so they are non-destructive. In addition, the highest magnified image can be obtained via this method. Thus, this method can characterize the surface roughness even to the smallest scale, i.e., nano- to submicron (Xie et al. 2006). However, a trade-off exists that it can only characterize a minute sample area.
The air-leak methods belong to this type. The Bendtsen (ISO 8791-2 2013); Sheffield (ISO 8791-3 2017); Print-surf (Parker 1971; ISO 8791-4 2007); and the Oken methods (ISO 8791-5 2020) have been established as ISO standard methods. For these methods, however, the surface roughness is not measured directly; rather, it is estimated indirectly via comparison with a reference sample. Accordingly, the corresponding values of a reference sample may be necessary to interpret the results. For these methods, the air-leaks are assumed to occur only due to the surface roughness. This may not be necessarily true because the potential of structural parameters, e.g., the pore size and distributions, influencing the air-flow are not taken into consideration.
Meanwhile, a direct contact method between a stylus (probe) and a sample surface should be preferable for paper and paperboard because a papermaking process as well as an evaluation of the quality of a product requires the contact between the product and the instrument used for testing (Yokura et al. 2004; Persson 2007; Beuther et al. 2012; Goedecke et al. 2013; Ko et al. 2019). Therefore, as direct contact method, a stylus-type contact method has been widely used. In this method, a stylus contacts the sample surface and scans along a predetermined direction.
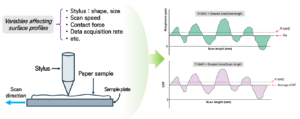
At present, no clear relationship between the roughness and friction of paper has been established (Ko et al. 2019). One of the main reasons is presumably due to a lack of an instrument that can generate both profiles at the same time using the same stylus. However, recently, Kato Tech Company in Osaka, Japan has introduced a surface tester capable of generating such profiles (Kato Tech Co. 2018a,b). Figure 1 shows the surface roughness profile and friction profile of a printing and writing (P&W) paper as an illustration obtained using the Kato surface tester. In this method, a stylus shape and size, a contact force of the stylus to the surface, the scan speed, and the data collection speed have been identified as the key parameters responsible for obtaining such a profile (Kawabata 1980; Yokura et al. 2004; Beuther et al. 2012; Hanaor et al. 2013; Zhai et al. 2016; Zhai et al. 2017; Ko et al. 2019).

Fig. 1. Surface profile of P&W paper (a: roughness profile; b: friction profile)
Determination of surface roughness
As a surface roughness parameter, the roughness average (Ra) has been widely used (Kawabata 1980; Leach 2010).
The Ra can be calculated according to Eq. 1,
 (1)
(1)
where Ra is the roughness average (), Ri is the roughness (um) at a point i and N is the number of data points in the scan length.
In the present study, the roughness mean absolute deviation (R-MAD) from the roughness average, Ra, was calculated according to Eq. 2,
 (2)
(2)
Figure 2 is a graphical representation of Ri, Ra, and R-MAD. In the figure, R-MAD is calculated from dividing the shaded area by the scan length and it is shown as the dotted lines. It is noted that R-MAD should not be the same as Ra.

Fig. 2. A graphical representation of surface roughness parameters
Determination of friction
As a surface friction parameter, a coefficient of friction (COF) is generally determined by measuring the drag force when the stylus moves horizontally on the sample surface under the contact force, namely:
COF = drag force/contact force (3)
At present, most of the commercial surface friction testers measure the COFs on several locations on the sample surface, then calculate the average value of COF with the standard deviation. Accordingly, they are also referred to as COF testers.
In the present study, however, in determining the surface friction, the authors have used the sample principles as those used for determining the surface roughness from a surface roughness profile. The average coefficient of friction is calculated according to Eq. 4. Then, F-MAD from the average COF has been calculated according to Eqs. 4 and 5,
 (4)
(4)
 (5)
(5)
where  is the average COF, N is number of data points from the scan length, μi is the COF at point i, and F-MAD is the mean absolute deviation from the average COF.
Figure 3 is a graphical representation of COF, average COF and F-MAD. In the same way of determining R-MAD, F-MAD is calculated by dividing the shaded area by the scan length and it is shown as the dotted lines.

Fig. 3. A graphical representation of friction parameters
The objective of this study was to examine the relations between surface roughness and friction by stylus contact method. It was also to examine the parameters responsible for generating surface profiles. Lastly, it was to introduce the MAD, as determined from the average values, as a surface characterization parameter of paper products; the R-MAD for the surface roughness and the F-MAD for the surface friction, respectively.
EXPERIMENTAL
Materials
Seven paper samples with different grades were conditioned for longer than 48 h at a temperature of 23 °C ± 1 °C and a relative humidity (RH) of 50% ± 2%, according to ISO standard 187 (1990). Table 1 shows a list of the samples, as well as their basis weight, thickness, and density.
Table 1. Physical Properties of Samples

Methods
The surface tester (KES-SESRU, Kato Tech Co., Ltd., Kyoto, Japan) was used. Using the same stylus both the surface roughness and the friction profiles were obtained at the same time. The stylus was made from a stainless steel (NAK 80). Its shape is conical whose tip diameter (d2) is shown in Fig. 4. Figure 4 also shows that the sample plate, not the stylus, moves in the scan direction.
Table 2 shows the test conditions used for determining surface roughness and friction of the samples. For each sample, 10 measurements were taken in the machine direction (MD) and the cross-direction (CD), respectively. The testing was performed at 23 °C ± 1 °C and at a RH of 50% ± 2%.

Fig. 4. Configuration of the surface tester and geometry of conical type stylus
Table 2. Test Conditions for Surface Characterization

RESULTS AND DISCUSSION
Effects of Variables Affecting Surface Profiles
Stylus size
The tip diameter of 0.5 mm (d2) in Fig. 4 was unsuccessful for testing the samples except for R1 and R2 at the contact force of 3 gf or 5 gf. This result is similar to behavior of the truncated pyramid as reported by Jeong et al. (2019). Meanwhile, the tip diameter of 1.0 mm (d2) was successful for testing all samples.
Data acquisition rate and spacing distance
Spacing distance (SD) is defined as the distance between two adjacent points on the X-axis of a surface profile. It is determined according to Eq. 6,
SD = L/N (6)
where SD is the spacing distance (mm), L is the scan length (mm), and N is the number of data points in L (mm). N is determined according to Eq. 7,
N = dar x L/V (7)
where dar is the data acquisition rate (Hz (or points/s)) and V is the scan speed (mm/s). Substituting Eq. 7 into Eq. 6 yields Eq. 8:
SD = (L x V)/(V/dar) = V/dar (8)
Spacing distance may be interpreted as the resolution of the X-axis in a surface profile and as such, a higher resolution indicates a shorter spacing distance (Hanaor et al. 2013). In Eq. 9, it is noted that the stylus size is not involved in determining the SD. Rather, it indicates that a shorter SD can be obtained by increasing the data acquisition rate. For example, the SD would be 0.1 mm (100 microns) at a dar of 10 Hz (points/s) and 0.01 mm (10 microns) at a dar of 100 Hz, with a scan speed of 1 mm/s.
Among these three dars of 10 Hz, 100 Hz, and 1000 Hz, a dar of 100 Hz, corresponding to a spacing distance of 10 microns provided the most stable, reproducible surface profiles.
Contact force
Generally speaking, if a contact force was too high, the sample tended to be damaged or torn off. If the contact force was too low, the stylus did not touch the sample surface, making it impossible to collect data.
Figure 5 shows the plots of average COF vs. contact forces of the three samples (R1, R5, R7) in Table 1, it seems that a contact force of 5 gf provided the most reproducible results. Consequently, a contact force of 5 gf was used to determine the surface properties in the present study.

Fig. 5. Effect of contact force on surface friction (a: R1, b: R5, c: R7)
Determination of Surface Roughness
The Ra and R-MAD were calculated using Eqs. 1 and 2, respectively. The coefficient of variation (COV) in percentage was determined from 10 measurements for each sample. Both the MD and the CD were determined. Table 3 shows the testing results.
Surface roughness parameters: R-MAD vs. Ra
Figure 6 shows the plots of the R-MAD vs. the Ra in the MD and the CD, respectively. In Fig. 8, the regression equations are also shown, which indicated a high correlation, with an R2 value equaling almost 1.0. Meanwhile, the slopes were drastically less than one, which indicated that the R-MAD should be less sensitive to the changes in the Ra values.
This may be explained by the fact that while Ra is influenced by the instrument and its operating conditions employed in a stylus-type contact method, R-MAD should be independent of them, representing the variation within the sample. Thus, R-MAD may be interpreted by the absolute variation of the surface roughness profile of the sample.
Table 3. Testing Results for Roughness


Fig. 6. R-MAD vs. Ra (a: machine direction; b: cross direction)
Determination of Friction
The average COF and F-MAD were calculated using Eqs. 4 and 5, respectively. The COV in percentage was determined from 10 measurements for each sample. Both the MD and the CD were determined. Table 4 shows the testing results.
Friction parameters: F-MAD vs. average COF
Figure 7 shows the plots of the F-MAD vs. the average COF of the samples in the MD and CD, respectively. In contrast to R-MAD vs. Ra, the correlation between the F-MAD and the average COF was poor, with an R2 value of about 0.3, in both the MD and the CD. This strongly suggests that the F-MAD should be independent of the COF because the former measures the friction between the stylus and the sample surface, which depends on the instrument including its testing conditions. Meanwhile, it is noted that the F-MAD indicates the deviation from the average COF, which represents a variation for a sample, and it should not depend on the test conditions. Thus, F-MAD may be interpreted by the absolute variation of the friction profile of the sample.
Table 4. Testing Results for Friction


Fig. 7. F-MAD vs. average COF (a: machine direction; b: cross direction)

Fig. 8. Average COF vs. Ra (a: machine direction; b: cross direction)
Friction vs. Surface Roughness
Average COF vs. Ra
Figure 8 shows the correlation between the average COF and the Ra in the MD and the CD, respectively. The correlation between the two values was extremely poor with an R2 value of almost zero in both cases (MD and CD). This suggested that the roughness and the friction should be independent of each other, as previously mentioned.
F-MAD vs. R-MAD
Figure 9 shows the correlation between the F-MAD and the R-MAD in both the MD and the CD, respectively. The correlation was rather low, especially the fives samples circled in the figure which show practically no correlation at all. This again supports the argument that the surface roughness and friction should be independent of each other

Fig. 9. R-MAD vs. F-MAD (a: machine direction; b: cross direction)
CONCLUSIONS
In a stylus-type contact method, a conical-type stylus whose tip diameter of 1.0 mm at a contact force of 5 gf and a data acquisition rate of 100 Hz was found to provide the most stable and reliable profiles of surface roughness and friction for paper products.
Correlation between the roughness and friction was very low, with practically no correlation between the two. This suggests that the two should be independent of each other. Accordingly, determining both surface roughness and friction is required for the surface characterization of paper products.
As a new surface characterization parameter, the mean absolute deviation (MAD) was introduced: the R-MAD for the surface roughness and the F-MAD for the surface friction. R-MAD represents the deviation from the roughness average and F-MAD represents the average COF. While Ra or average COF depends on the instrument and its operating conditions, R-MAD or F-MAD should not depend on them because the latter represents the variations within the sample.
ACKNOWLEDGMENTS
This study was carried out with the support of the Korea Evaluation Institute of Industrial Technology, the Ministry of Trade, Industry and Energy, Republic of Korea (Project No. 20002396, Paper and Paperboard Determination of Surface Roughness and ISO Standardization), and the R&D Program for Forest Science Technology (Project No. FTIS 2019150A00-2023-0301), which was provided by the Korea Forest Service (Korea Forestry Promotion Institute).
REFERENCES CITED
Ampulski, R. S., Sawdai, A. H., Spendel, W., and Weinstein, B. (1991). “Methods for the measurement of the mechanical properties of tissue paper,” in: Proceedings of the International Paper Physics Conference, Kailua Kona, HI, USA, pp. 19-30.
Beuther, P. D., Ko, Y., Pawar, P., Raynor, Jr., W. J., Rekoske, M. J., and Ries, T. D. (2012). “Molded wet-pressed tissue,” U. S. Patent No. US8257551B2.
Goedecke, A., Jackson, R. L., and Mock, R. (2013). “A fractal expansion of a three dimensional elastic–plastic multi-scale rough surface contact model,” Tribology International 59, 230-239. DOI: 10.1016/j.triboint.2012.02.004
Hanaor, D. A. H., Gan, Y., and Einav, I. (2013). “Effects of surface structure deformation on static friction at fractal interfaces,” Géotechnique Letters 3(2), 52-58. DOI: 10.1680/geolett.13.016
Hladnik, A., and Lazar, M. (2016). “Paper and board surface roughness characterization using laser profilometry and gray level cooccurrence matrix,” Nordic Pulp & Paper Research Journal 26(1), 99-105. DOI: 10.3183/npprj-2011-26-01-p099-105
Hodgson, K. T., and Berg, J. C. (1988). “Dynamic wettability properties of single wood pulp fibers and their absorbency,” Wood and Fiber Science 20(1), 3-17.
Hollmark, H. (1983a). “Mechanical properties of tissue,” in: Handbook of Physical and Mechanical Testing of Paper and Paperboard, Vol. 1, R. E. Mark (ed.), Marcel Dekker Inc., New York, NY, USA, pp. 497-521.
Hollmark, H. (1983b). “Evaluation of tissue paper softness,” TAPPI Journal 66(2), 97-99.
ISO 187 (1990). “Paper, board and pulps — Standard atmosphere for conditioning and testing and procedure for monitoring the atmosphere and conditioning of samples,” International Organization for Standardization, Geneva, Switzerland.
ISO 3274 (1996). “Geometrical product specifications (GPS) – Surface texture: Profile method – Nominal characteristics of contact (stylus) instruments,” International Organization for Standardization, Geneva, Switzerland.
ISO 4287 (1997). “Geometrical product specifications (GPS) – Surface texture: Profile method – Terms, definitions and surface texture parameter,” International Organization for Standardization, Geneva, Switzerland.
ISO 8791-2 (2013). “Paper and board – Determination of roughness/smoothness (air leak method) – Part 2: Bendtsen method,” International Organization for Standardization, Geneva, Switzerland.
ISO 8791-3 (2017). “Paper and board – Determination of roughness/smoothness (air leak method) – Part 3: Sheffield method,” International Organization for Standardization, Geneva, Switzerland.
ISO 8791-4 (2007). “Paper and board – Determination of roughness/smoothness (air leak methods) – Part 4: Print-surf method,” International Organization for Standardization, Geneva, Switzerland.
ISO 8791-5 (2020). “Paper and board – Determination of roughness/smoothness (air leak methods) – Part 5: Oken method,” International Organization for Standardization, Geneva, Switzerland.
ISO 13565-1 (1996). “Geometrical product specifications (GPS) — Surface texture: Profile method; Surfaces having stratified functional properties — Part 1: Filtering and general measurement conditions,” International Organization for Standardization, Geneva, Switzerland.
Jeong, H. S., Ko, Y. C., and Kim, H.-J. (2019). “Effects of a stylus on the surface roughness determination in a contact method for paper and paperboard,” Nordic Pulp & Paper Research Journal 34(4), 442-452. DOI: 10.1515/npprj-2019-0011
Kawabata, S. (1980). The Standardization and Analysis of Hand Evaluation 2nd Edition, Textile Machinery Society of Japan, Osaka, Japan.
Kato Tech Co. (2018a). Roughness Tester, KS-SRU-KR, Operation Manual, ver. 1.03, Kato Tech Co., Ltd., Kyoto, Japan.
Kato Tech Co. (2018b). Friction Tester, KW-SRU-KF, Operation Manual, ver. 1.03, Kato Tech Co., Ltd., Kyoto, Japan.
Ko, Y. C., Melani, L., Park, N. Y., and Kim, H. J. (2020). “Surface characterization of paper and paperboard using a stylus contact method,” Nordic Pulp & Paper Research Journal 35(1), 78-88. DOI: 10.1515/npprj-2019-0005
Ko, Y. C., Park, J. Y., Melani, L., Park, N. Y., and Kim, H. J. (2019). “Principles of developing physical test methods for disposable consumer products,” Nordic Pulp & Paper Research Journal 34(1), 75-87. DOI: 10.1515/npprj-2018-0029
Ko, Y. C., Ratner, B. D., and Hoffman, A. S. (1981). “Characterization of hydrophilic—hydrophobic polymeric surfaces by contact angle measurements,” Journal of Colloid Interface Science 82(1), 25-37. DOI: 10.1016/0021-9797(81)90120-X
Leach, R. K. (2010) “Surface topography characterization,” in: Fundamental Principles of Engineering Nanometrology, Elsevier, Amsterdam, Netherlands, pp. 211-262. DOI: 10.1016/B978-0-08-096454-6.10008-9
Léger, D., Mathieu, E., and Perrin, J. C. (1975). “Optical surface roughness determination using speckle correlation technique,” Applied Optics 14(4), 872-877. DOI: 10.1364/AO.14.000872
Modaressi, H., and Garnier, G. (2002). “Mechanism of wetting and absorption of water droplets on sized paper: Effects of chemical and physical heterogeneity,” Langmuir 18(3), 642-649. DOI: 10.1021/la0104931
Parker, J. R. (1971). “Development and application of a novel roughness tester,” TAPPI Journal 54(6), 943-949.
Persson, B. N. J. (2007). “Relation between interfacial separation and load: A general theory of contact mechanics,” Physical Review Letters 99(12), Article ID 125502. DOI: 10.1103/PhysRevLett.99.125502
Pino, A. O., Pladellorens, J., and Colom, J. F. (2010). “Method of measure of roughness of paper based in the analysis of the texture of speckle pattern,” in: Proceedings Volume 7387, Speckle 2010: Optical Metrology, Florianapolis, Brazil, pp. 1-7. DOI: 10.1117/12.869655
Samyn, P., Erps, J. V., Thienpont, H., and Schoukens, G. (2011). “Paper coatings with multi-scale roughness evaluated at different sampling size,” Applied Surface Science 257(13), 5613-5625. DOI: 10.1016/j.apsusc.2011.01.059
Schlegel, D., Folea, M., Roman, A., and Nardin, P. (2011). “Surface analysis of machine fiber glass composite material,” in: Recent Research in Manufacturing Engineering, N. Mastorakis, V. Mladenov, B. Lepadatescu, H. R. Karimi, and C. G. Helmis (eds.), WSEAS Press, Athens, Greece, pp. 152-155.
TAPPI T575 om-07 (2012). “Roughness of paper and paperboard, stylus (Emveco-type) method,” TAPPI Press, Atlanta, GA, USA.
van Kuilenburg, J., Masen, M. A., and van der Heide, E. (2013). “Contact modelling of human skin: What value to use for the modulus of elasticity?,” Proceedings of the Institution of Mechanical Engineers, Part J: Journal of Engineering Tribology 227(4), 349-361. DOI: 10.1177/1350650112463307
Wang, Y., Assis, T. D., Zambrano, F., Pal, L., Venditti, R. A., Dasmohapatra, S., Pawlak, J., and Gonzalez, R. W. (2018). “Relationship between human perception of softness and instrument measurements,” BioResources 14(1), 780-795. DOI: 10.15376/biores.14.1.780-795
Xie, X. N., Chung, H. J., Sow, C. H., and Wee, A. T. S. (2006). “Nanoscale materials patterning and engineering by atomic force microscopy nanolithography,” Material Science and Engineering: R: Reports 54(1-2), 1-48. DOI: 10.1016/j.mser.2006.10.001
Yokura, H., Kohono, S., and Iwasaki, M. (2004). “Objective hand measurement of toilet paper,” Journal of Textile Engineering 50(1), 1-5. DOI: 10.4188/jte.50.1
Zhai, C., Gan, Y., Hanaor, D. A. H., Proust, G., and Retraint, D. (2016). “The role of surface structure in normal contact stiffness,” Experimental Mechanics 56(3), 359-368. DOI: 10.1007/s11340-015-0107-0
Zhai, C., Hanaor, D., and Gan, Y. (2017). “Contact stiffness of multiscale surfaces by truncation analysis,” International Journal of Mechanical Science 131-132, 305-316. DOI: 10.1016/j.ijmecsci.2017.07.018
Article submitted: November 24, 2020; Peer review completed: April 17, 2021; Revised version received and accepted: June 22, 2021; Published: June 25, 2021.
DOI: 10.15376/biores.16.3.5667-5678