
Abstract
Poplar (Populus tomentosa Carr.) solid wood was surface densified in the tangential direction, and the vertical density profile (VDP) and hardness of the treated and untreated samples were measured. The effects of the process parameters on the VDP and hardness were investigated. To explicitly describe the VDP of the surface densified wood, five indices (AD, ADx, PD, PDi, and DTh) were used. The compressing temperature and closing speed influenced the formation and shape of the VDP. A higher temperature yielded a greater PD and Pdi, and a faster closing speed yielded a higher PD, but smaller PDi and DTh. Increasing the compression ratio increased the AD, ADx, and maximum load, and the poplar wood was compressed in the overall thickness as the compression ratio exceeded a certain degree. The Janka hardness of the poplar wood was significantly improved after surface densification; a higher temperature resulting in a higher surface hardness was explained by the higher PD. The closing speed and compression ratio affected the hardness by impacting the VDP, specifically the PD and DTh indices. When the PD and DTh were greater the surface hardness was greater. By this study, a compressing temperature of 140 to 160 °C and the closing speed of 10 mm/min is recommended, and to prevent the deformation of unheated side of the wood samples and obtain a higher surface hardness, the compression ratio is restricted to 20%.
Download PDF
Full Article
Surface Densification of Poplar Solid Wood: Effects of the Process Parameters on the Density Profile and Hardness
Qiaofang Zhou, Chuanfu Chen, Dengyun Tu,* Zhipeng Zhu, and Kaifu Li
Poplar (Populus tomentosa Carr.) solid wood was surface densified in the tangential direction, and the vertical density profile (VDP) and hardness of the treated and untreated samples were measured. The effects of the process parameters on the VDP and hardness were investigated. To explicitly describe the VDP of the surface densified wood, five indices (AD, ADx, PD, PDi, and DTh) were used. The compressing temperature and closing speed influenced the formation and shape of the VDP. A higher temperature yielded a greater PD and Pdi, and a faster closing speed yielded a higher PD, but smaller PDi and DTh. Increasing the compression ratio increased the AD, ADx, and maximum load, and the poplar wood was compressed in the overall thickness as the compression ratio exceeded a certain degree. The Janka hardness of the poplar wood was significantly improved after surface densification; a higher temperature resulting in a higher surface hardness was explained by the higher PD. The closing speed and compression ratio affected the hardness by impacting the VDP, specifically the PD and DTh indices. When the PD and DTh were greater the surface hardness was greater. By this study, a compressing temperature of 140 to 160 °C and the closing speed of 10 mm/min is recommended, and to prevent the deformation of unheated side of the wood samples and obtain a higher surface hardness, the compression ratio is restricted to 20%.
Keywords: Surface densification; Process parameters; Vertical density profile; Hardness; Characterizing index; Thermo-hydro-mechanical
Contact information: Department of Wood Science and Engineering, College of Materials and Energy, South China Agricultural University, Guangzhou, 510642;
*Corresponding author: tudengyun@scau.edu.cn
INTRODUCTION
It is well known that wood properties generally correlate positively with the density; therefore, wood species with a higher density are usually more desirable than other species (Laine et al. 2016). As a porous material, wood can be compressed until its density reaches that of the cell wall substance, which has been determined to be approximately 1500 kg/m3 (Rautkari et al. 2011).Wood can be softened to a rubbery state as the temperature exceeds the glass transition temperature, which highly depends on the moisture content, and compressed to a certain extent without cracking the cell walls. This wood compression process combining heat, moisture, and mechanical action is called thermo-hydro-mechanical (THM) treatment (Sandberg and Navi 2007; Navi and Sandberg 2012; Kutnar et al. 2015). The THM treatment can increase the density of fast-growing and low-density wood species and impart the so-called densified wood with excellent mechanical properties (Gong et al. 2010; Tu et al. 2012; Gao et al. 2016). With a global decrease in the supply of high-quality hardwoods, densified wood is a potential substitute that has attracted increasing attention in the woodworking industry.
The THM treatment has three main stages. The first stage consists of softening (plasticizing) the wood substance in the region that is to be compressed. The second stage is transverse compression of the softened wood structure to a degree that corresponds to the target density, which is normally approximately 1000 kg/m3. The final stage is stress relaxation and/or locking of the deformed structure to prevent it from returning to its original shape (i.e., to prevent set-recovery) when subjected to moisture variations (Sadatnezhad et al. 2017). In some THM treatments, the solid wood is densified throughout the whole cross section and bulk densified wood is obtained. Bulk densified wood has a high density and mechanical properties, but this result is achieved at the expense of the wood volume, which is greatly reduced. This may be a disadvantage in situations where, for example, the main aim is to improve the surface hardness (e.g., flooring applications), but where it is beneficial to retain the thickness to resist bending (Rautkari et al. 2013; Laine et al. 2014). In such situations, surface densification by THM treatment is appropriate. Because of its low thermal conductivity and heat transfer rate, wood can be heated and compressed only a few millimeters beneath the surface by carefully controlling the process parameters, such as the compressing temperature, closing speed, and compression ratio.
Surface densification of solid wood has been extensively researched (Inoue et al. 1990; Wang and Cooper 2005a,b; Lamason and Gong 2007; Rautkari et al. 2011; Tu et al. 2012; Laine et al. 2014; Zhan et al. 2015; Zhan and Avramidis 2016). Inoue et al. (1990) surface densified sugi (Cryptomeria japonica D. Don), hinoki (Chamaecyparis obtusa Endl.), and western hemlock (Tsuga heterophylla Sarg.) wood using a new technique that softened the water-soaked wood surface by microwave irradiation and then compressed it in the radial direction. Increases of 40% to 50% in the abrasion resistance and 120% to 150% in the surface hardness were reported. Wang and Cooper(2005a) studied the vertical density profiles (VDP) of thermally compressed balsam fir (Abies balsamea) and black spruce (Picea mariana) with different grain orientations. The balsam fir was more easily compressed than the black spruce, and the VDP depended greatly on the preheating and closing times, wood initial moisture content, and grain orientation. Lamason and Gong (2007) optimized the pressing parameters for surface densified low-density aspen (Populus tremuloides Michx.) wood, and the optimum pressing conditions were a compression ratio of 24%, temperature of 145 °C, and closing time of 7 min. Compared with undensified aspen wood, the hardness, modulus of elasticity (MOE), and nail withdrawal resistance of surface densified wood were improved by an average of 140%, 23%, and 132%, respectively. Rautkari et al. (2011) surface densified Scots pine (Pinus sylvestris L.) sapwood using a specially designed heated press tool fitted to a universal testing machine, and parameters including the moisture content, compression ratio, temperature, closing time, and holding time were considered in their study. All of the parameters were found to affect the shape of the VDP, and it was determined that the interacting effects should not be neglected. A broader range of research on wood densification and compressibility has also been conducted (Navi and Girardet 2000; Wolcott and Shutler 2003; Kutnar et al. 2008; Welzbacher et al. 2008; Fang et al. 2012; Tu et al. 2014; Bekhta et al. 2016; Esteves et al. 2017).
The THM densification of solid wood is analogous to the manufacture of wood-based panels, such as medium density fiberboard and particleboard. For these composites, the VDP is very important because it reflects the special structures of the materials that affect the physical and mechanical properties of the products. Generally, the formation of the VDP of wood-based panels is attributed to the combined actions of the temperature, moisture, compaction pressure, gas pressure, and resin curing, as well as the densification and stress relaxation of wood during hot pressing and after press opening (Wang and Cooper 2005a). Similarly, the formation of the VDP of solid wood is affected by those factors, except resin curing. To fully optimize the mechanical properties of surface-compressed solid wood, it is important to understand the impact of the process parameters on the density through the thickness of the modified wood (Rautkari et al. 2011; Laskowska 2017).
The compressing temperature, closing speed, and compression ratio are the three most important processing parameters for wood densification since they determine the formation of the VDP. To date, there are few comprehensive reports about their effect on VDP (Rautkari et al. 2011; Tu et al. 2014). Therefore, it is meaningful to study the effect of temperature, closing speed and compression ratio on the VDP. In this study, the specific indices to characterize the VDP of surface-compressed wood were proposed and the effects of the process parameters on the VDP were determined. The hardness was also analyzed because it is the most relevant property when surface densified wood is applied as flooring boards and worktops.
EXPERIMENTAL
Materials
Poplar (Populus tomentosa Carr.) plain sawn lumber (1050 mm ×150 mm ×30 mm) obtained from Hebei province in China with an average oven-dried density of 450 kg/m3 was used in the experiment. The lumber was conditioned to an approximately 12% moisture content at 20 °C and a 65% relative humidity for three months prior to treatment. The VDP and hardness were measured after surface densification. For the VDP measurements, samples were machined to the dimensions 50 mm (longitudinal) × 50 mm (radial) × 30 mm/26 mm/23 mm (tangential). For the hardness measurements, samples were machined to the dimensions 70 mm (longitudinal) × 50 mm (radial) × 30 mm/26 mm/23 mm (tangential).
To minimize the inhomogeneity of the physical and micro-morphological properties of the poplar wood, the samples for each thickness obtained from adjacent positions along the fiber direction were grouped together for surface densification with the different treatment conditions (two temperatures and three closing speeds). There were six groups of samples that were treated for the VDP measurements and 12 groups of samples that were treated for the hardness measurements. Untreated samples for comparison were also prepared, and they were obtained adjacent to the treated ones (Fig. 1).
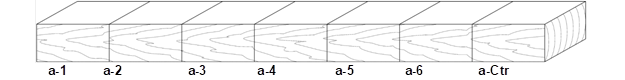
Fig. 1. Preparation pattern of the samples for the VDP and hardness measurements; groups were named in alphabetical order (a, b, c…), with Ctr denoting the uncompressed sample.
Methods
Surface densification process
Surface densification was performed using a specially designed device similar to the one Rautkari et al. (2011) used, except that there was no water-cooling system. The THM densification of solid wood can be employed in industries, provided that cooling under load is not needed. Poplar wood samples were densified in the tangential direction and from the same wood surface (marked with an arrow) using an open system at two different temperatures, which were 100 °C and 180 °C. The sample was attached to the upper platen (unheated). When the sample was pressed close to the lower platen (heated), it was densified at once with three different closing speeds, which were 2.5 mm/min, 5 mm/min, and 10 mm/min. One sample was surface densified at a time. The initial thicknesses of the samples were 30 mm, 26 mm, and 23 mm, and they were all compressed to 20 mm. This resulted in the three different compression ratios (Laine et al. 2016) 33.3%, 23.1%, and 13.0%, which were labelled D30, D26, and D23, respectively. Once the target thickness (20 mm) was reached, the press stopped moving automatically and remained closed with the heated platen for 5 min. After this holding time, the sample was taken out without cooling. The thicknesses of the samples were measured before and after densification, and the immediate spring-back after opening was determined using Eq.1 (Kariz et al. 2017),
Immediate Spring-back = [(tic – tt)/(ti – tt)] ×100% (1)
where tic is the thickness immediately after compression (mm), tt is the target thickness (20 mm, set by the universal testing machine) (mm), and ti is the initial uncompressed thickness of the sample (mm).
The actual level of achieved densification was defined as the densification ratio (Laine et al. 2016). Unlike Rautkari et al. (2011), mechanical stops were not used; the maximum load was read using the universal testing machine. The process parameters used in this study are summarized in Table 1.
Table 1. Summary of the Process Parameters Used in this Study

Density profile measurements
After compression, the samples for the VDP measurements were dried in a furnace by increasing the temperature from 60 °C to 103 °C for 8 h to remove the moisture. During surface densification, the moisture migrated from the heated surface to the center of the sample and redistributed across the thickness. If the treated samples were conditioned, the densified zone (dried zone) would absorb moisture and partly recover its initial shape, which might affect the accuracy of the VDP measurement. To eliminate this negative effect, the samples were oven-dried immediately after densification by a mild procedure as mentioned previously to avoid cracks or deformation.
The density profile of each sample was scanned in the tangential (thickness) direction using a commercial X-ray scanner (DPX 300 LTE, iMAL, Modena, Italy). The density was measured at intervals of 0.05 mm and scanned from the densified surface towards the undensified surface. All of the testing samples were stored in plastic bags after oven-drying to avoid moisture absorption while awaiting the VDP measurement. The samples were removed one at a time from the bags and immediately measured in the X-ray scanner.
To characterize the VDP of the surface densified samples, five indices were proposed to describe the curve. They were the average density (AD), average density of the sample excluding the peak area (ADx), peak density (PD), distance from the densified surface to the position of the peak density (PDi), and thickness of the densified zone, where the density was greater than 80% of the peak density (DTh) (Fig. 2). The DTh index, for which there is a lack of published information, was used to evaluate the ability to resist pressure or impact bending on the face of the densified wood. The DTh is a part of the peak base (Pb), which was mentioned by Belt et al. (2013), who decided to not use the Pb as one of the five indices because the DTh was not greater than the Pb in many cases. The ADx index was also used for the first time in this study. Wood compressed only in the surface or overall thickness can be judged by this index, which combines the AD result for undensified wood.

Fig. 2. An example showing the density profile characterization indexes
Hardness measurements
The Janka hardness of the samples was measured according to ISO 13061-12 (2017). For this method, a hemispherical ball with a radius of 5.64 mm was forced into the sample to a depth of 5.64 mm or 2.82 mm, and the maximum force was recorded during the test. Considering that the poplar sample was densified just a few millimeters beneath the wood surface and the surface hardness was of interest, a penetration depth of 2.82 mm was used.
The hardness was measured using a SUNS UTM 5504 (SUNS Company, Shenzhen city, China) equipped with an MTS control system and 50-kN load cell. Four spots on the densified surface of each sample were measured. The Janka hardness was calculated using Eq. 2,
HW=K×F (2)
where F is the maximum load during the penetration of the plunger into the test piece to a depth of 2.82 mm (N), and K is the coefficient equal to 4/3 in the case of penetration of the plunger to a depth of 2.82 mm.
For all parameters, all multiple comparisons were first subjected to an analysis of variance (ANOVA), and significant differences between mean values of control and treated samples were determined using Duncan’s multiple range test (SPSS Statistics, version 22.0, IBM, USA).
RESULTS AND DISCUSSION
The VDP, which reflects the density through the thickness of densified wood, is an important parameter, as it affects both the physical and mechanical properties. As a nondestructive testing method, the VDP is expected to evaluate the mechanical properties of wood-based composite materials, including densified wood material. Hardness is also an important property when the surface of the wood material is exposed to use, such as when used as flooring, wall paneling, and worktops. The process parameters were found to affect the formation of the VDP, and thus the surface hardness of densified wood. Intensive study into this effect may result in optimization of wood surface densification.
Densification Ratio
In this study, poplar wood samples with the three initial thicknesses 30mm, 26 mm, and 23 mm were compressed to 20 mm in the tangential direction, which resulted in compression ratios of 33.3%, 23.1%, and 13.0%, respectively. Because of the immediate spring-back (Kariz et al. 2017) of the surface densified samples after press opening, the densification ratio was lower than the compression ratio and dependent on the pressing temperature and closing speed (Table 2). For example, the densification ratios of the samples surface densified at 180 °C were approximately 27%, 20%, and 11% for D30, D26, and D22, which were 6%, 3%, and 2% lower than the compression ratios, respectively. As the temperature was increased from 100 °C to 180 °C, the densification ratios increased, and this was explained by two factors. First, the heat transfer was accelerated at higher temperatures, and the wood substance near the surface could be fully softened and compressed more easily. Second, higher temperatures were advantageous to plasticizing the densified zone and reduced the immediate spring-back to some extent. According to the statistical analysis (multiple range tests), the influence of the closing speed on the densification ratios was not significant. The immediate spring-back was affected by the temperature and compression ratio. A reduction in the immediate spring-back was observed with greater compression ratios. The immediate spring-back was approximately 12% for D30 at 180 °C, and this value increased to 20% for D23, although the absolute thickness of D23 was lower than that of D30 after press opening. This finding was not in agreement with Kariz et al. (2017), who reported that the immediate spring-back of surface densified spruce increased as the compression ratio increased. This difference might have been because of the water-cooling procedure they used for reducing the compression recovery.
Table 2.Densification Ratios and Immediate Spring-back of the Surface Densified Poplar Wood Samples (%)

Vertical Density Profile
The typical density distribution through the thickness (tangential direction) of the poplar wood samples was chosen and plotted for each treatment condition, and the VDPs are shown in Figs. 3, 4, and 5. The characterizing indices of the VDP and the maximum loads are shown in Table 3. In this study, the heated platen temperatures used were 100and 180 °C, and the closing speeds were 2.5, 5, and 10 mm/min. Figures 3, 4, and 5 show that the peak of the density curve was closer to the surface of the sample at a lower temperature, and the peak density shifted further away from the wood surface and deeper into the center of the sample at a higher temperature. For example, the PDi was 0.43 mm at 100 °C for D30 with a speed of 2.5 mm/min, and this value increased to 2.30 mm at 180 °C (Table 3). The PDi is an important index for surface densified wood materials because the hardest surface needs to be exposed when in use. A reasonable range of PDi may be between 0.2 mm to 1.0 mm, considering that sanding or planning occur afterwards during manufacturing. In fact, using the densified zone near the surface as the machining allowance, which has a density that is not as high, is advantageous in woodworking machinery. The PD also increased notably as the temperature increased. For example, the PD was greater than 1000 kg/m3 for D26 at 180 °C, but it was only approximately 870 kg/m3 for D26 at 100 °C. Wood cannot be softened adequately at 100 °C, which accounts for the lower PD at that temperature. Therefore, it was strongly suggested that a higher temperature, 140 °C for example, would be more suitable for wood surface densification. Higher temperatures heat up the wood surface quickly and remove moisture, and the dried area is hard to deform; thus, the peak density shifts towards the central portion. However, a temperature that is too high also leads to irregular shrinking or bubbling on the wood surface because of the rapidly rising steam pressure, such defects occurred for poplar wood samples when the pressing temperature was greater than 185 °C. Therefore, the temperature must be carefully chosen for surface densification for a higher PD and reasonable PDi, and to avoid such defects.
The closing speed was also an important process parameter that affected the VDP of the poplar wood samples. Figures 3, 4, and 5 show that the density peak shifted towards the central portion as the closing speed decreased. For example, the PDi of D23 was 0.68 mm with a speed of 10 mm/min at 180 °C, but this value increased to 1.70 mm with a speed of 2.5 mm/min. The closing speed was inversely related to the closing time, i.e., when the closing speed was higher, the closing time was lower. Shorter closing times probably resulted in limited heat transfer, and thus softening of the wood was limited, with only the surface being compressed to any great extent. In addition to the PDi, the shape of the density peak, PD, and DTh were affected by the closing speed. With a faster closing speed, the density peak was sharper and higher. For example, the PD of D23 was 865 kg/m3 at180 °C with a speed of 2.5 mm/min, but this value increased to 926 kg/m3with a speed of 10 mm/min (Table 3). As the closing speed decreased, not only would there be greater heat transfer, but there would be greater opportunity for the wood below the surface to deform viscoelastically, thereby broadening the density peak. The DTh is an index proposed to characterize the shape of the density peak. A higher and sharper density peak may result in a smaller DTh, and a lower and broader density peak results in a greater DTh, assuming that the compression ratio is almost the same. Table 3 shows that the DTh of D26 was 2.40 mm with a speed of 10 mm/min at 180 °C, but this value increased to 3.15 mm with a speed of 2.5 mm/min. The DTh of D23 was 1.74 mm with a speed of 10 mm/min at 180 °C, but this value increased to 2.53 mm with a speed of 2.5 mm/min. To resist pressure or impact bending, the DTh of surface densified wood should be sufficiently high. A reasonable range is between 2 mm and 6 mm, depending on the application of the final products.
In summary, higher temperatures yielded a greater PD and PDi, and faster closing speeds yielded a greater PD, but a smaller DTh and PDi. Consequently, the interactive effects of the temperature and closing speed on the PD, PDi, and DTh should be taken into consideration when designing surface-densified wood.
Among the five indices, the AD was only determined by the densification ratio (or compression ratio). Greater densification ratios yielded a greater AD. For the surface densification condition of 180 °C and 2.5 mm/min, the AD of D30, D26, and D23 was 622, 566, and 550 kg/m3, respectively (Table 3). As the temperature was decreased to 100 °C, the AD showed a minor decrease, but this result was attributed to the reduction in the densification ratios of the solid wood samples at lower temperatures. Mechanical properties, such as the MOE and modulus of rupture, are greater when the wood material has a greater AD. However, for the surface hardness of densified wood, a greater AD maybe a drawback because the surface hardness is not correspondingly improved, even though a greater volume of wood is exhausted for compression. The DTh was highly dependent on the densification ratio. For example, it was 3.58 mm, 2.40 mm, and 1.74 mm for D30, D26, and D23, respectively, at 180 °C and 10 mm/min. This phenomenon was also easily determined through the VDP. When the wood sample was densified at a greater densification ratio with the same closing speed (10 mm/min), the needed closing time was greater and the deformation was greater. Thus, the compressed load was greater. This could have prompted heat transfer and wood softening, and resulted in a thicker densified zone (DTh). The DTh is related to the densification ratio, and the increase in the densification ratio produced a greater DTh. However, the PD did not always increase with the densification ratio. Table 3 shows that the PD of D30, D26, and D23 was 963, 1036, and 926 kg/m3, respectively, at 180 °C and 10 mm/min. According to the statistical analysis (one-way analysis of variance), the influence of the densification ratio on the PD was not significant between the D30 and D26. The PD increased as the densification ratio varied from 11% (D23) to 20% (D26), but it remained unchanged after that, at approximately 1000 kg/m3. A difference in the closing speed may have resulted in a difference in the PD, as was mentioned previously.
The ADx index is used to tell to what extent the solid wood is compressed over the through thickness during surface densification. The differences between the ADx of the densified wood samples and the AD of the undensified wood samples was manifested as gaps between the densified and control VDPs, as is shown in Figs. 3, 4, and 5. With a greater ADx, the wood sample was more compressed in the unheated side, so that the gap was larger. In surface densification, the most desirable state is when the solid wood is only densified near the surface, approximately several millimeters deep, and the surface hardness of the densified zone is great enough to resist impact or abrasion during application. This ideal state is hard to realize at higher densification ratios. As the densification ratio varied from 11% to 27% at 180 °C and 2.5 mm/min, the ADx values were 541, 487, and 479 kg/m3 for D30, D26, and D23, and the differences between the ADx and AD of the controls were about 90 kg/m3, 60 kg/m3, and 30 kg/m3, respectively. The influences of the temperature and closing speed on the ADx were not significant at a 0.05 confidence level.
In this study, the maximum loads when surface densifying the poplar wood samples were recorded with the universal testing machine. Table 3 shows that the maximum load decreased with an increasing temperature, but it increased with an increasing closing speed and densification ratio. A higher temperature heated up the wood surface quickly and softened it adequately, and the softened wood area was compressed with a lower mechanical force. A faster closing speed, which left the densified wood sample limited time to buffer, also increased the maximum load. The deformation increased as the densification ratio increased; therefore, the maximum load increased linearly. The maximum load was approximately 10000 N (corresponding to 4 MPa for the 50-mm × 50-mmVDP sample) as the poplar wood sample was densified at room temperature. This meant that the unheated side of the sample would be densified as the compressing load exceeded the critical value (10000 N). In surface densification, the heat and moisture transfers from the surface to the center, and the softened area is compressed gradually. The formation of the densified zone increases the mechanical load during densification. When the mechanical load is significantly higher than the critical value, the unheated side of the sample would then be densified, instead of the heated side. Table 3 shows that the maximum loads of densification of D30 and D26 at 180 °C were greater than 13000 N, which was 30% greater than the critical value. This may have caused the tremendous, but undesirable deformation of the unheated side of the poplar wood samples. For densification of D23 at 180 °C, the maximum load was approximately 10000 N, which meant that the unheated side of the sample would not be compressed significantly. This inference was confirmed by the ADx. Increasing the maximum load may have deformed the unheated side of the sample, but it also increased the PD and broadened the densified zone, which increased the DTh. Fortunately, the PD of D23 was 926 kg/m3 at 180 °C and 10 mm/min, though the DTh was only 1.74 mm. Therefore, for so-called ideal surface densification, a higher PD and suitable DTh and PDi can be obtained by further optimizing the process parameters with more research.

Fig. 3. VDPs of the surface densified and undensified (control) D30 poplar wood samples with different closing speeds and at different temperatures: (a) 100 °C and (b) 180 °C

Fig. 4. VDPs of the surface densified and undensified (control) D26 poplar wood samples with different closing speeds and at different temperatures: (a) 100 °C and (b) 180 °C

Fig. 5. VDPs of the surface densified and undensified (control) D23 poplar wood samples with different closing speeds and at different temperatures: (a) 100 °C and (b) 180 °C
Table 3.Characterizing Indices of the VDP of the Surface Densified Samples and the Maximum Load in Densification

Hardness
The hardness values of the surface densified and undensified (control) poplar wood samples are shown in Fig. 6. The hardness was 1885 N for the control. After surface densification, the hardness improved greatly. For example, the hardness of the D30 surface densified wood at 180 °C and 5 mm/min was 3932 N, which was 108% greater than that of the control. The differences in the hardness of the surface densified woods for different treatment conditions can be clearly seen in Fig. 6. As the temperature increased from 100 °C to 180 °C, the hardness of the surface densified wood increased from approximately 3000 to 3500 N, which was an increase of 16.7%. The densification ratio also affected the hardness. As it increased, the hardness of the surface densified wood also increased, but the hardness values of D26 and D30 were nearly the same. It is well known that the density of wood correlates with its mechanical properties. Therefore, the increased density in the surface layer was expected to increase the hardness of the surface densified wood, with a greater density being associated with a greater hardness. Moreover, the thickness of the densified zone also plays an important role in the hardness because the penetration of the ball was 2.82 mm in the hardness measurement. Therefore, it was concluded that among the five characterizing indices, the PD and DTh are the most relevant to the measured hardness of the densified wood, and a greater PD and DTh may result ina greater surface hardness. A higher temperature generated a higher PD. As a result, the hardness of the surface densified wood at 180 °C was greater than that of the wood densified at 100 °C. Considering the indentation of the hardness measurement was 2.82 mm, if the DTh was much lower than this value, the hardness would be negatively affected. The measured hardness of D23 at 180 °C and 10 mm/min showed that this was the case, even though it had a higher PD.
The hardness of red oak wood, which is often used as a flooring material, was measured using ISO 13061-12 (2017). A value of approximately 3400 N was recorded. The hardness of the surface densified poplar wood in this study was slightly higher than that of red oak wood. Therefore, it was concluded that it is feasible to use surface densified poplar wood as a flooring material and replace expensive and rare red oak wood in the future.

Fig. 6.Hardness of the surface densified and undensified (control) poplar wood samples
CONCLUSIONS
The purpose of this study was to investigate the surface densification of poplar solid wood by the thermo-hydro-mechanical (THM) method and the effects of the process parameters on the vertical density profile (VDP) and hardness. Different process parameters were obtained by changing the compressing temperature, closing speed, and compression ratio. The correlation of the surface hardness and the VDP index was analyzed as well. Conclusions can be drawn as follows:
- The compressing temperature influenced the formation and shape of the VDP. When compressed at 100 °C, the surface of the wood sample could not be softened adequately; thus, the peak density (PD) was lower. A higher temperature (180 °C) resulted in a greater PD, but the distance from the densified surface to the position of the peak density (PDi) was also greater, which made the densified zone shift away from the surface. Therefore, the compressing temperature had to be carefully selected to produce a higher PD and reasonable PDi during surface densification.
- The closing speed also had an effect on the VDP.A faster closing speed yielded a greater PD and a smaller PDi and thickness of the densified zone, where the density was greater than 80% of the peak density (DTh). Therefore, a faster closing speed would be more appropriate.
- Increasing the compression ratio could have increased the AD, ADx, and DTh, which meant that the wood is deformed over the overall thickness. However, the PD already reached its maximum as the compression increased to a certain extent. Therefore, a reasonable compression ratio had to be determined, as it may result in a successful VDP, where the deformation mainly takes place on the surface of the wood sample.
- The Janka hardness of the poplar wood was significantly improved after surface densification. A higher temperature resulted in a higher surface hardness. This result was explained by the higher PD produced during surface densification. The closing speed and compression ratio affected the hardness by affecting the VDP, specifically the PD and DTh indices. Greater PD and DTh indices corresponded with a greater surface hardness. Therefore, the surface hardness can be targeted for improvement by optimizing the process parameters that determine the formation of the VDP of solid wood.
By this study, a compressing temperature within the range 140 to 160 ℃ and a closing speed of 10 mm/min is recommended, and to prevent the deformation of unheated side of the wood samples and obtain a higher surface hardness, the compression ratio is restricted to 20%.
ACKNOWLEDGMENTS
The authors are grateful for the support of the National Natural Science Foundation of China (Grant No. 31770601 and No. 31700494) and the S&T Project of Guangdong Province of China (Grant No. 2017A050501030).
REFERENCES CITED
Bekhta, P., Mamoňová, M., Sedliačik, J., and Novák, I. (2016). “Anatomical study of short-term thermo-mechanically densified alder wood veneer with low moisture content,” Eur. J. Wood Wood Prod. 74(5), 643-652. DOI: 10.1007/s00107-016-1033-2
Belt, T., Rautkari, L., Laine, K., and Hill, C. A. S. (2013). “Cupping behaviour of surface densified Scots pine wood: The effect of process parameters and correlation with density profile characteristics,” J. Mater. Sci. 48(18), 6426-6430. DOI: 10.1007/s10853-013-7443-1
Esteves, B., Ribeiro, F., Cruz-Lopes, L., Ferreira, J. V., Domingos, I., Duarte, M., Duarte, S., and Nunes, L. (2017). “Densification and heat treatment of maritime pine wood,” Wood Res.–Slovakia 62(3), 373-388.
Fang, C.-H., Mariotti, N., Cloutier, A., Koubaa, A., and Blanchet, P. (2012). “Densification of wood veneers by compression combined with heat and steam,”Eur. J. Wood Wood Prod.70(1-3), 155-163. DOI: 10.1007/s00107-011-0524-4
Gao, Z., Huang, R., Lu, J., Chen, Z., Guo, F., and Zhan, T. (2016). “Sandwich compression of wood: Control of creating density gradient on lumber thickness and properties of compressed wood,” Wood Sci. Technol. 50(4), 833-844. DOI: 10.1007/s00226-016-0824-2
Gong, M., Lamason, C., and Li, L. (2010).“Interactive effect of surface densification and post-heat-treatment on aspen wood,” J. Mater. Process. Tech. 210(2), 293-296. DOI: 10.1016/j.jmatprotec.2009.09.013
Inoue, M., Norimoto, M., Otsuka, Y., and Yamada, T. (1990). “Surface compression of coniferous wood lumber I. A new technique to compress the surface layer,” Mokuzai Gakkaishi 36(11), 969-975.
ISO 13061-12 (2017). “Physical and mechanical properties of wood—Test methods for small clear wood specimens—Part 12: Determination of static hardness,” International Organization for Standardization, Geneva, Switzerland.
Kariz, M., Kuzman, M. K., Sernek, M., Hughes, M., Rautkari, L., Kamke, F. A., and Kutnar, A. (2017). “Influence of temperature of thermal treatment on surface densification of spruce,” Eur. J. Wood Wood Prod. 75(1), 113-123. DOI: 10.1007/s00107-016-1052-z
Kutnar, A., Kamke, F. A., and Sernek, M. (2008). “The mechanical properties of densified VTC wood relevant for structural composites,” HolzRoh.Werkst. 66(6), 439-446. DOI: 10.1007/s00107-008-0259-z
Kutnar, A., Sandberg, D., and Haller, P. (2015). “Compressed and moulded wood from processing to products,” Holzforschung 69(7), 885-897. DOI: 10.1515/hf-2014-0187
Laine, K., Segerholm, K., Wålinder, M., Rautkari, L., and Hughes, M. (2016). “Wood densification and thermal modification: Hardness, set-recovery and micromorphology,” Wood. Sci. Technol. 50(5), 883-894. DOI: 10.1007/s00226-016-0835-z
Laine, K., Segerholm, K., Wålinder, M., Rautkari, L., Ormondroyd, G., Hughes, M., and Jones, D. (2014). “Micromorphological studies of surface densified wood,” J. Mater. Sci. 49(5), 2027-2034. DOI: 10.1007/s10853-013-7890-8
Lamason, C., and Gong, M. (2007). “Optimization of pressing parameters for mechanically surface-densified aspen,” Forest Prod. J. 57(10), 64-68.
Laskowska, A. (2017). “The influence of process parameters on the density profile and hardness of surface-densified birch wood (Betula pendula Roth),”BioResources 12(3),6011-6023. DOI: 10.15376/biores.12.3.6011-6023
Navi, P., and Girardet, F. (2000). “Effects of thermo-hydro-mechanical treatment on the structure and properties of wood,” Holzforschung 54(3), 287-293. DOI: 10.1515/hf.2000.048
Navi, P. and Sandberg, D. (2012). Thermo-hydro-mechanical Processing of Wood, CPC-Press, Boca Raton, p 360
Sandberg, D., and Navi, P. (2007). “Introduction to thermo-hydro-mechanical (THM)
wood processing,” School of Technology and Design Reports, No. 30, Växjö University, Växjö, Sweden.
Rautkari, L., Laine, K., Kutnar, A., Medved, S., and Hughes, M. (2013). “Hardness and density profile of surface densified and thermally modified Scots pine in relation to degree of densification,” J. Mater. Sci. 48(6), 2370-2375. DOI: 10.1007/s10853-012-7019-5
Rautkari, L., Laine, K., Laflin, N., and Hughes, M. (2011). “Surface modification of Scots pine: The effect of process parameters on the through thickness density profile,” J. Mater. Sci. 46(14), 4780-4786. DOI: 10.1007/s10853-011-5388-9
Sadatnezhad, S. H., Khazaeian, A., Sandberg, D., and Tabarsa, T. (2017). “Continuous surface densification of wood: A new concept for large-scale industrial processing,” BioResources12(2), 3122-3132. DOI: 10.15376/biores.12.2.3122-3132
Tu, D. Y., Du, C., Zhou, Q. F., Yang, S. S., Lao, Y. M., and Dong, H. (2012). “Poplar wood flooring surface densification,” China Wood Industry 26(4), 46-48.
Tu, D., Su, X., Zhang, T., Fan, W., and Zhou, Q. (2014). “Thermo-mechanical densification of Populus tomentosa var. tomentosa with low moisture content,” BioResources 9(3), 3846-3856. DOI: 10.15376/biores.9.3.3846-3856
Wang, J. Y., and Cooper, P.A. (2005a). Effect of grain orientation and surface wetting on vertical density profiles of thermally compressed fir and spruce,” HolzRoh. Werkst. 63(6), 397-402. DOI: 10.1007/s00107-005-0034-3
Wang, J. Y., and Cooper, P. A. (2005b). “Vertical density profiles in thermally compressed balsam fir wood,” Forest Prod. J. 55(5), 65-68.
Welzbacher, C. R., Wehsener, J., Rapp, A. O., and Haller, P. (2008).“Thermo-mechanical densification combined with thermal modification of Norway spruce (Picea abies Karst) in industrial scale – Dimensional stability and durability aspects,”Holz Roh. Werkst.66, 39-49. DOI: 10.1007/s00107-007-0198-0
Wolcott, M. P, and Shutler, Jr., E. L. (2003).“Temperature and moisture influence on compression-recovery behavior of wood,” Wood Fiber Sci. 35(4), 540-551.
Zhan, J., and Avramidis, S. (2016). “Needle fir wood modified by surface densification and thermal post-treatment: Hygroscopicity and swelling behavior,”Eur. J. Wood Wood Prod. 74(1), 49-56. DOI: 10.1007/s00107-015-0969-y
Zhan, J., Cao, J., Gu, J., Zhang, X., Chen, W., Liu, Z., Liu, B., and Ma, H. (2015). “Surface densification and high temperature hydrothermal post treatment of the Abies nephrolepislumber,” Journal of Nanjing Forestry University (Natural Science Edition) 39(3), 119-124. DOI: 10.3969/j.issn.1000-2006.2015.03.022
Article submitted: December 10, 2018; Peer review completed: March 8, 2019; Revisions accepted: April 26, 2019; Published: April 30, 2019.
DOI: 10.15376/biores.14.2.4814-4831