
Abstract
Cotton is a natural fiber that takes up carbon dioxide from the environment when grown; however, it requires various resources to be cultivated in a financially viable way. Resources such as fertilizer, pesticides, herbicides, and irrigation water can create environmental impacts as well as present significant costs to the grower. Understanding the efficacy of technologies and grower practices is an important aspect of developing best practices and guiding future research. To better understand the grower needs, practices, and resource use efficiency, a survey was conducted in 2015 with 925 U.S. cotton grower respondents. This survey gathered data on field performance, pest pressures, growing practices, and other parameters that were used to examine the resources used per pound of cotton lint as well as estimate the greenhouse gas emissions and energy use from cotton cultivation. In general, growers who used various precision agricultural technologies reported higher performing fields with higher resource use efficiencies than non-precision technology adopters.
Download PDF
Full Article
Sustainability Trends and Natural Resource Use in U.S. Cotton Production
Jesse S. Daystar,a Edward Barnes,b,* Kater Hake,b and Ryan Kurtz b
Cotton is a natural fiber that takes up carbon dioxide from the environment when grown; however, it requires various resources to be cultivated in a financially viable way. Resources such as fertilizer, pesticides, herbicides, and irrigation water can create environmental impacts as well as present significant costs to the grower. Understanding the efficacy of technologies and grower practices is an important aspect of developing best practices and guiding future research. To better understand the grower needs, practices, and resource use efficiency, a survey was conducted in 2015 with 925 U.S. cotton grower respondents. This survey gathered data on field performance, pest pressures, growing practices, and other parameters that were used to examine the resources used per pound of cotton lint as well as estimate the greenhouse gas emissions and energy use from cotton cultivation. In general, growers who used various precision agricultural technologies reported higher performing fields with higher resource use efficiencies than non-precision technology adopters.
Keywords: Cotton; Nitrogen use; Precision agriculture; Greenhouse gas; Survey; Integrated pest management; Water use; Energy
Contact information: a: Department of Earth and Ocean Sciences, Duke University, 9 Circuit Drive Box 90328, Durham, NC 27708; b: Cotton Incorporated, 6399 Weston Pkwy, Cary, NC 27513;
* Corresponding author: ebarnes@cottoninc.com
INTRODUCTION
Cotton Sustainability
Cotton cultivation requires a wide range of material inputs from nature, and the use of manmade substances often provides measurable improvements in productivity. These material inputs and the outputs for cotton cultivation often carry environmental burdens. There has been a movement to increase responsible cotton growth through the means of certification programs, integrated pest management implementation, and precision agriculture technology. Efforts to increase resource use efficiency have been largely successful in the USA and have increased yields approximately 55% when comparing 1980 to 2011 (Field To Market 2012). On a per pound of lint basis, the following resource use metrics have decreased from 1980 to 2011: land use 30%, soil erosion 68%, irrigation water applied 75%, energy use 31%, and greenhouse gasses 22% (Field To Market 2012). Much of the increased yields and resource use efficiencies have been possible due to: research and advances made to eradicate pests, implementation of precision agriculture technologies, creation of higher performing cotton varieties, and development of integrated pest management strategies.
Increased resource use efficiency can also lead to reduced environmental impacts. In recent years, textile consumers as well as the general public have become more aware of the environmental impacts of products and often place a higher value on products with perceived lower environmental impacts. Out of the three major types of fibers, cotton, polyester, and rayon, consumers reported cotton as “safe for the environment” to a higher degree than any other fiber type (Cotton Life Style Monitor 2016). Specifically, in the USA, 89% of the respondent’s survey indicated cotton to be safe for the environment, while only 54% and 46% indicated polyester and rayon to be safe, respectively. The surveyed consumers do perceive cotton to be more environmentally friendly than other fiber sources; however, cotton production does create environmental impacts and often requires the use of scarce resources. Additionally, the production of cotton often uses pesticides, herbicides, irrigation, and fertilizers that all carry some environmental burden, but also play an important role in increasing cotton yields per acres. There should be an optimization of managing inputs to increase yields and profits, which may correspond to minimizing inputs per pound of cotton lint.
The cotton and textiles industries have acknowledged the demand for more sustainable textiles and have responded to the perceived value of products with lower environmental impacts by creating a variety of nonprofit and consortium-based industry groups. The Sustainable Apparel Coalition, developed a metric labeled the Higg Index that “empowers brands, retailers, and facilities of all sizes, at every stage in their sustainability journey, to measure their environmental, social, labor impacts, and identify areas for improvement” (Sustainable Apparel Coalition 2016). The Higg Index incorporates more than environmental sustainability, including both social and labor impacts throughout the brand and product life cycle. The Higg Index and similar tools can play an important role in designing sustainable and responsibly produced products as well as a way to benchmark brand performance and track improvements through time.
Other brands and organizations have taken a more focused approach to understanding environmental sustainability and have performed rigorous ISO14000 certified studies examining the environmental impacts of their products. Levi Strauss, for instance, performed a life cycle assessment (LCA) of their jeans, which led to some interesting discoveries as well as provided the world with quantitative data surrounding the environmental impacts of jeans (Levi Straus & Co. 2015). The study determined that the consumer use phase is a major hotspot for several impact categories because of high energy use in heating water and drying clothes with a conventional dryer. The study also indicated that the cotton fiber production had significant impacts in the land use, eutrophication (water quality), and water use impact categories.
Cotton Incorporated also performed an ISO 14000 (ISO 2007) compliant LCA study examining the environmental impacts of cotton based garments for both knit and woven textiles (Cotton Incorporated 2012). This study incorporated the full life garment life cycle from fiber cultivation, product manufacturing, use, and end of life (landfill) impacts. The results of this study were similar to the Levi Strauss analysis in that the consumer use phase was found to be a major contribution for several impact categories and that the cotton fiber cultivation contributed the most to the land use, eutrophication, and water consumption impact categories.
Because of the role in which cotton cultivation plays in the overall cotton garment life cycle impacts, there is a need to better understand the driving factors behind grower performance and whether the adoption of precision agriculture and other technologies are increasing crop productivity. Additionally, there is a need for current agricultural data surrounding crop performance and resource use to update outdated LCA data. There is also a need to understand grower concerns and priorities that can further guide research and development to both increase grower profits and reduce environmental impacts.
Natural Resource Survey
In 2008, a natural resource survey was conducted of U.S. cotton producers to self-assess cotton’s impact on the environment and to collect data to support a global life cycle assessment project (Reed et al. 2009). The 2008 results were released in a white paper and used in life cycle inventory data sets such as those used by Gabi and SimaPro. Updated agriculture and natural resource data are needed to understand the efficacy of certain education initiatives, technology adoptions, and current trends in farming practices. Survey data generated within this study will be the most current and comprehensive dataset surrounding natural resource use and examines the relationships between farming practices and reported yields, resource use efficiency, and other measures surrounding the performance of agriculture systems.
The explicit goals of the 2015 survey were to:
- Provide additional data to support Cotton LEADSTM.
- Facilitate participation in the Field to Market Field Print CalculatorTM by collecting data used by the calculator, which could allow future exports of the data in order to build the calculator’s cotton database.
- Support data needs related to U.S. production systems by updating the cotton global LCA data set.
- Maintain an accurate understanding of growers’ research needs.
Some of these goals are addressed within this document; however, others involve data not released, but rather integrated into current agriculture models and calculators, and integrated in other studies. The goals of this document are to:
- Provide a summary of the natural resource survey results.
- Determine changes in survey results from the 2008 to the 2015 survey years.
- Provide insights into the implications of the adoption of agricultural technologies.
- Provide documentation of the U.S. cotton production data supplied to the global LCA.
- Provide grower’s insight into what practices they are adopting that appear to have a positive impact on resource use efficiency, productivity, or both.
Surveying growers from all regions as well as getting a proportional survey response to region production was important, allowing for more meaningful analysis and conclusions. Additionally, by examining independent variables such as growing practices and technology adoption, relationships between dependent variables such as field productivity (yield), resource use efficiency (Nitrogen use efficiency and water use efficiency), and perceived concerns can be established (Fig. 1). These relationships, however, should be interpreted carefully, as there are many variables and conditions that each farmer experiences that can affect the field performance. As such, trends and the possible relationships between independent growing variables and dependent field performance variables are acknowledged. These relationships are carefully stated to demonstrate a possible link without stating the causal nature of the relationship. This work will fill the knowledge gap between the connection of farming practices and their implications at the national level for all growing regions in the U.S., and could help guide further research and outreach efforts.
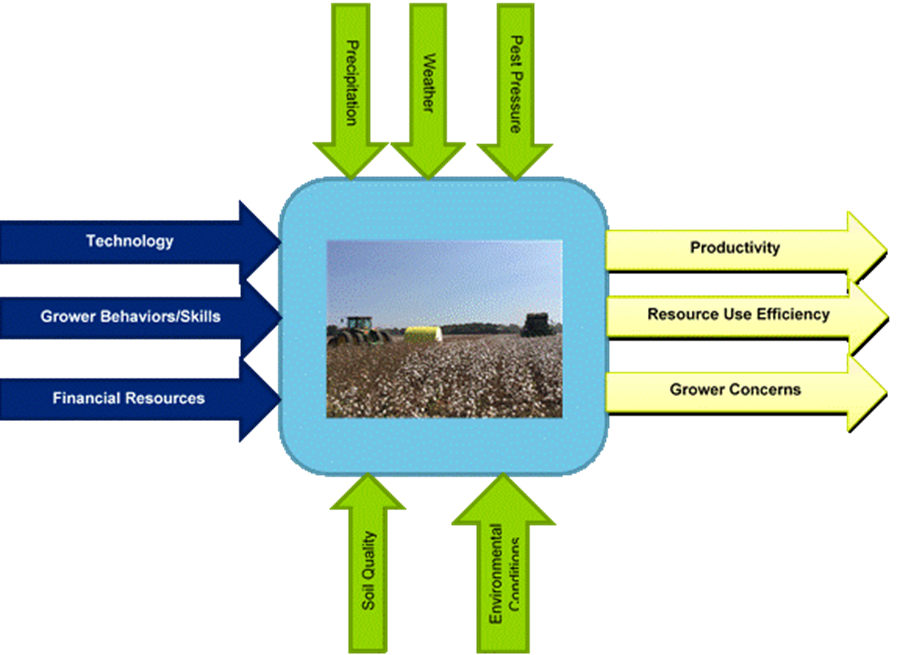
Fig. 1. Cotton growing production-system simplified model with independent variables labeled in blue (under the grower’s control) and green (out of grower’s control) and the corresponding dependent variables represented in the yellow arrows.
METHODS
Cotton Growth Regions
Cotton is grown all over the world in different climates and with different technologies. This report focuses on the U.S. cotton production, which involves roughly 13% of the world production from 2010 to 2014 (USDA 2015). U.S cotton is commonly divided into four distinct regions due to weather patterns, climate, soil type, and other factors influencing cotton cultivation methods and plant productivity. The following are the regions commonly used to group cotton growing states:
- Southeast: Virginia, North Carolina, South Carolina, Georgia, Alabama, and Florida
- Mid-south: Mississippi, Louisiana, Tennessee, Missouri, and Arkansas
- Southwest: Texas, Oklahoma, and Kansas
- Far West: California, Arizona, and New Mexico
To further highlight the difference between these regions, Fig. 2 shows precipitation and Fig. 3 soil types throughout the U.S. In examining these images, it is clear that the Southeast and Mid-south receive more precipitation than the Southwest and Far West. Additionally, farming practices are influenced by the dominant soil types that are generally found in each region: Southeast- Ultisols; Mid-south- Alfisol; Southwest- Mollisols; and Far West- Aridisols.
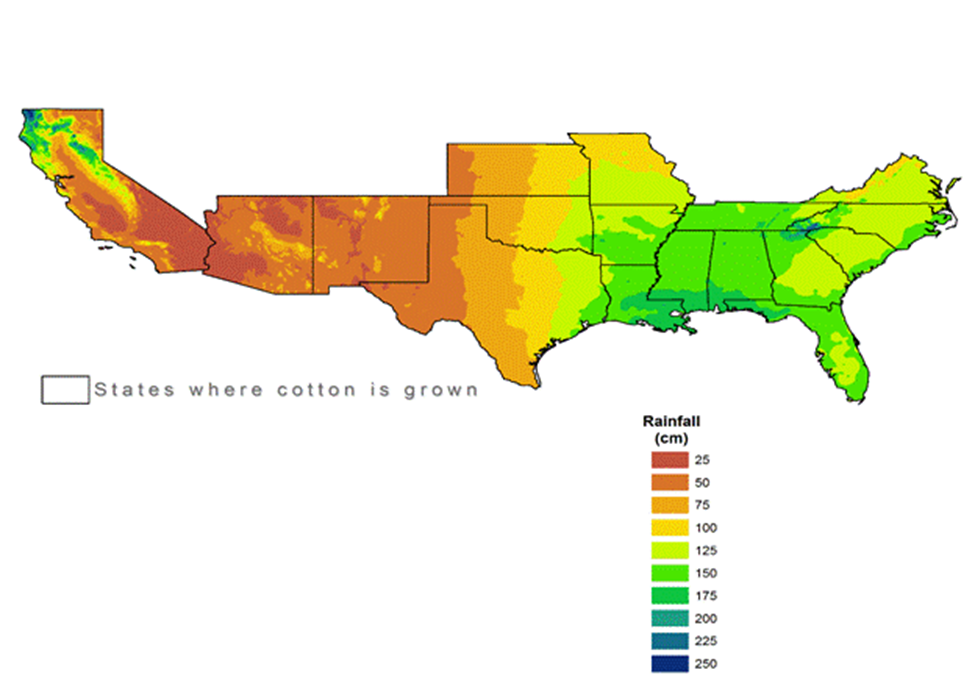
Fig. 2. 30-year average rainfall from 1971 to 2000 in cotton producing states (rainfall data from USDA 2010)
Survey Method
A market research firm, Bellomy Research, assisted in the execution of the 2015 survey. Twelve-thousand postcards were mailed by the Cotton Board to all the farmers that produced cotton in 2014. Postcards were mailed on the dates of March 6, April 6, and May 25 of 2015. In addition to postcards, 1,800 emails were sent to cotton producers just prior to the postcard mailing on March 5 and June 3. A total of 4,300 emails were sent soliciting a survey response. As a way to track communication channels, different survey links were provided in the postcard and emails.
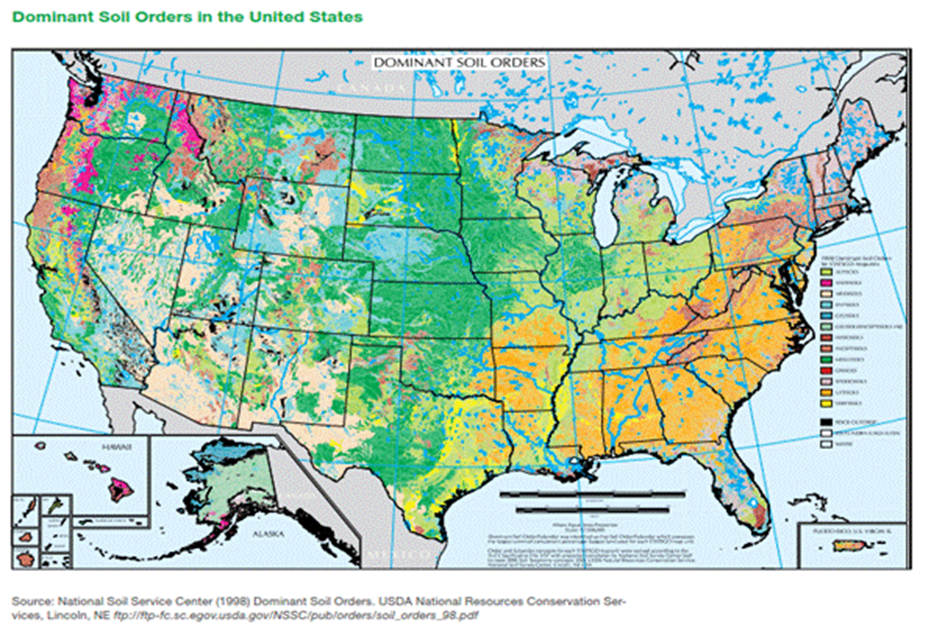
Fig. 3. Dominant soil orders for the U.S. (USDA National Resources Conservation Services 1998)
To avoid extraneous responses, no external links to the survey were made available from a public website – the links were only provided through the postcard or email. In Fig. 4, responses were tracked based on the date submitted. Three distinct slope changes can be observed that correspond with the different communication dates.
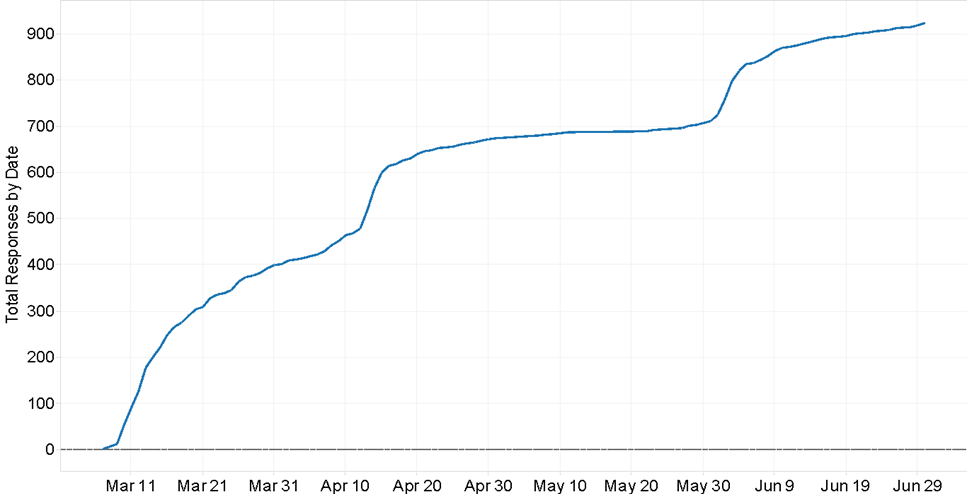
Fig. 4. Cumulative number of responses by date
The survey asked 66 questions in total, some of which had multiple parts. These survey questions gathered information on farmer demographics, general grower practices, grower concerns, and average field level growth and management data. In the results analysis, the average field data was used to find correlations between general growing practices and field performance. The full survey is provided in the appendix. A very similar survey was conducted of U.S. cotton producers in 2008 (Reed et al. 2009); therefore, some responses in this report are compared to the 2008 results.
Respondent Demographics and Data Representativeness
In total, 925 responses were recorded, of which 88% came from those who entered the web address provided on the postcard. Responses from the cotton growing states were proportional to the cotton growing area of the states, with the highest concentration of respondents in Texas and Georgia, as seen in Fig. 5 and 6.
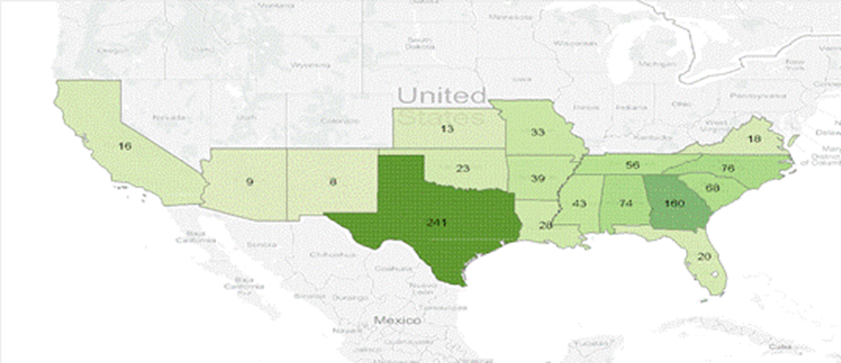
Fig. 5. Respondents by state for the 2015 survey
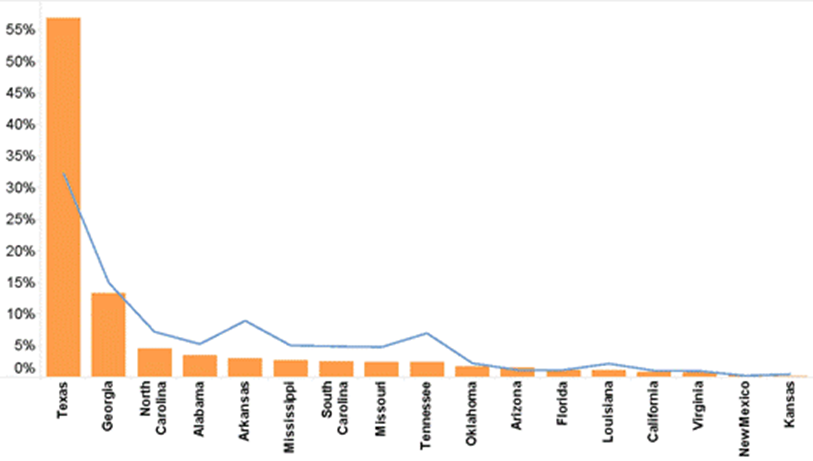
Fig. 6. Percent of U.S. acres grown in each state during 2013/2014 and the percentage of acres by state from survey participants
Most of those participating were experienced cotton growers, with 91% having more than five years growing cotton, and more than half (54%) having grown cotton at least 21 years. A majority of respondents (79%) had some post high school education, and 46% had at least a bachelor degree. There was a fairly uniform distribution of ages for respondents with the exception of those 20 to 30 years old at 9%, 31 to 40: 20%; 41 to 50: 17%; 51 to 60: 33% and greater than 60: 21%.
Data Analysis
The results as received from Bellomy Research were analyzed using Microsoft Excel, Tableau 9 by Tableau, and SPSS by IBM. Tableau enabled many conditional comparisons between demographics, farming practices, region, and the resulting field productivity, and efficiencies. Before performing the analysis in Tableau, data formatting and cleaning was required to enable the program to analyze the data correctly. Using an advanced data visualization program such as Tableau added depth and rigor to the analysis provided herein. SPSS provided insight into the statistical relevance of results, and to make some additional comparisons.
Energy Use and Greenhouse Gas (GHG) Emission Calculations
The energy usage and GHG emissions for cotton production were calculated on a cradle to gin gate basis as illustrated in Fig. 7. Both energy and GHG emissions were examined using a functional unit of one pound of fiber ready to be shipped from the ginner [lb CO2/lb fiber, and BTU/lb fiber].
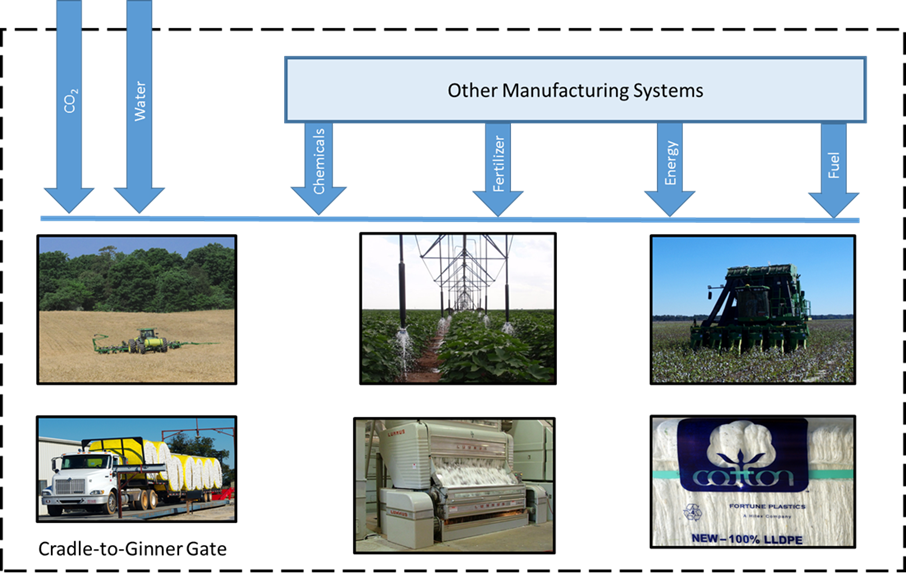
Fig. 7. GHG and energy usage cradle-to-ginner gate system boundary
In the survey, questions on energy use were not explicitly asked. Instead, the responses were used to estimate energy use based on tillage system, number of tractor passes through the field, and amount of chemical applications. Energy use for irrigation was estimated based on total lift (pumping depth to ground water plus distance to the water outlet), outlet pressure, volume of water applied, and energy source based on the procedures of Hoffman et al. (1992). For operations involving tractors or other field equipment, grower survey data was combined with ASABE (2011) procedures to estimate fuel use. Data reported in Faulkner et al. (2011) was used to document fuel use in cotton strippers; data from Willcutt et al. (2009) was used for modern spindle harvesters to estimate fuel use in harvest operations. Data for ginning electrical energy use was based on survey data reported by Valco et al. (2015), and dryer fuel used was based on data measured by Hardin and Funk (2014). Energy content for fuels used was taken from the Department of Energy (2015).
RESULTS AND DISCUSSION
Cotton Producer Concerns
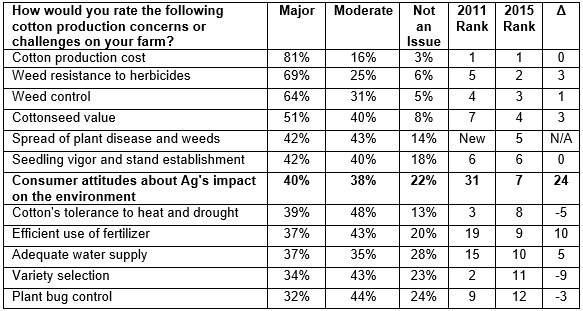
As part of the Natural Resource Survey, respondents were asked to review 27 randomly presented concerns or challenges and score whether each was a Major, Moderate, or Not an Issue on their farm. An indication of data quality was the fact that only 3% said “Cotton Production Input Costs” were “Not an Issue,” as this is clearly a top concern expressed by cotton producers in all personal interviews. As seen in Table 1, consumer attitudes made the biggest jump in producer priority, from 31st place, reported in 2011 in a previous survey that only surveyed producer concerns, to 7th place in 2015, likely reflecting the strong emphasis that Cotton Incorporated has placed on Cotton LEADSTM, sustainability metrics, Field to Market, and competition with manmade fibers.
Table 1. A Summary Ranking of Responses for All 2015 Grower Concerns
Grower Communication Methods
To continue to supply producers with new information to continue to improve their production efficiency, it is important to understand where producers receive their information on new technologies and practices. The survey participants were asked to rank 12 information sources on how much they depended on them as: none; slightly, moderately or greatly. The percent selecting moderately or greatly important are shown in Fig. 8, with the most highly rated in 2015 at the top of the chart. The 2015 results were fairly consistent with what was reported in 2008. Producers tend to prefer face-to-face interaction composed of other producers, consultants, and extension agents.
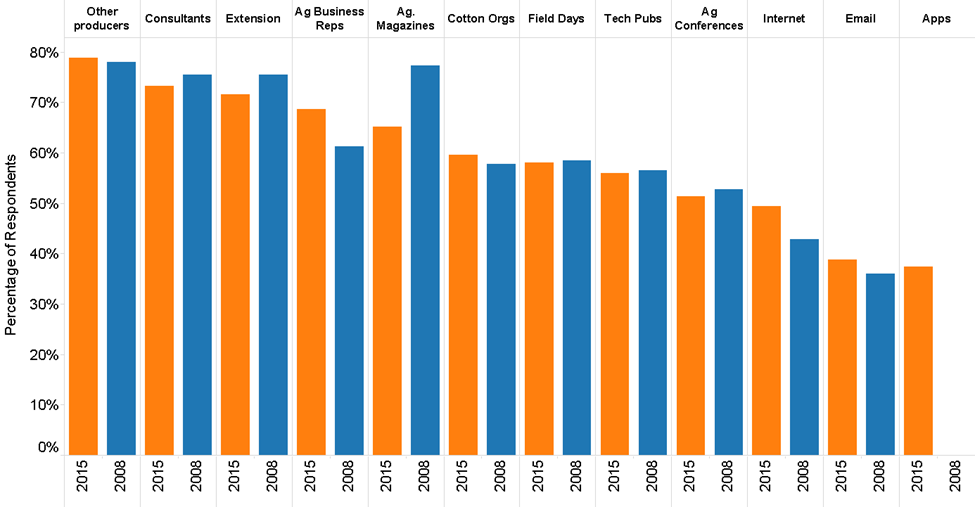
Fig. 8. Preferred information sources – percent ranking source as “greatly” or “moderately” useful
There was a slight decline in interest in magazines, and slight increase in the Internet as a preferred source of information. Apps are not of significant interest at this time, but that may increase as more cotton-specific apps are released.
Farm Characteristics
Land and management practices and characteristics were examined by using multiple questions within the natural resource survey. The average field size was one parameter surveyed since field size can impact whether some of the practices are feasible for producers to adopt, especially where field size is smaller. To understand the changes in average field size, it was compared by region for 2015 and 2008, as illustrated in Fig. 9. All regions reported similar average field sizes in 2015 and 2008. Field size in the Far West is often limited by the irrigation system design; in order to achieve effective water distribution the length of fields has to be restricted. In the Southeast, field size is often limited by topography, such as established tree lines and wetland areas.
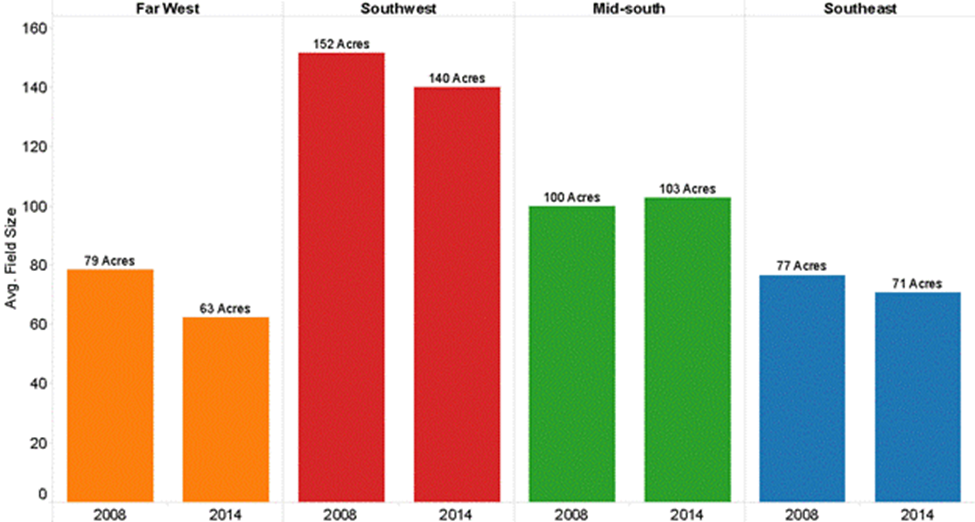
Fig. 9. Average field size by region for 2008 and 2015 survey data
Land Use
A total of 1,675,911 crop acres were represented by those responding to the survey, with 49% (818,804 acres) composed of cotton fields. This represents 10% of the cotton planted in the United States in 2015. Of the cotton acres, 45% were capable of receiving irrigation water. In addition to crop land, the respondents also reported a total of 217,113 acres of natural land on their farming enterprise. A great majority (86%) indicated they grew more than cotton (82% in 2008). Additional crops grown by respondents and percent respondents growing them are in Table 2, which were similar to the results in 2008.
Crop Rotation and Cover Crops
In the cotton offseason, the land can be used for various crops that can increase revenue as well as create benefits to the land. The survey polled farmers to understand the use of the land in the offseason. This data was used in conjunction with the field level yields to gain further insight, as shown in Fig. 10. In Fig. 10, the average field yield (cotton fiber with no seed) is on the Y-axis and the off season use is listed on the X-axis. The percentage labeled at the top of each bar chart represents the percent difference from the no winter crop scenario and the width of the bar indicates the number of growers using the scenario method. This analysis indicates that farmers using winter crops/cover produced higher cotton yield, especially with native vegetation and planted cover crops, which resulted in 4% and 5.2% increase in average cotton plot yield compared to no winter crop farm plots. Native vegetation was used as an indication that the field was allowed to grow grass and other native species, and no-cover was an indication of a largely bare soil. The bare soil condition is more common in western states where there are not winter rains to support native vegetation. Where growers plant cover crops they build soil organic matter, suppress spring weeds, and increase the microbial biomass in the soil. Most cover crops are single species such as wheat or cereal rye. The small increase associated with native vegetation could be insignificant or due to the benefits associated with diverse species in the rotation. Note that it is not uncommon to have lower cotton yields when double cropping if the winter crop results in a later than optimal planting date for cotton.
Table 2. Percentage of the 925 Respondents Indicated they Commercially Produced the Crop Listed
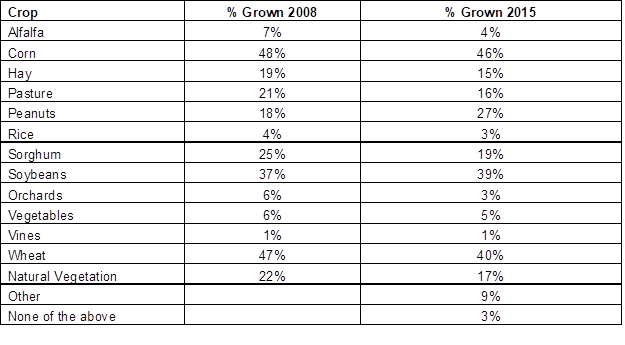
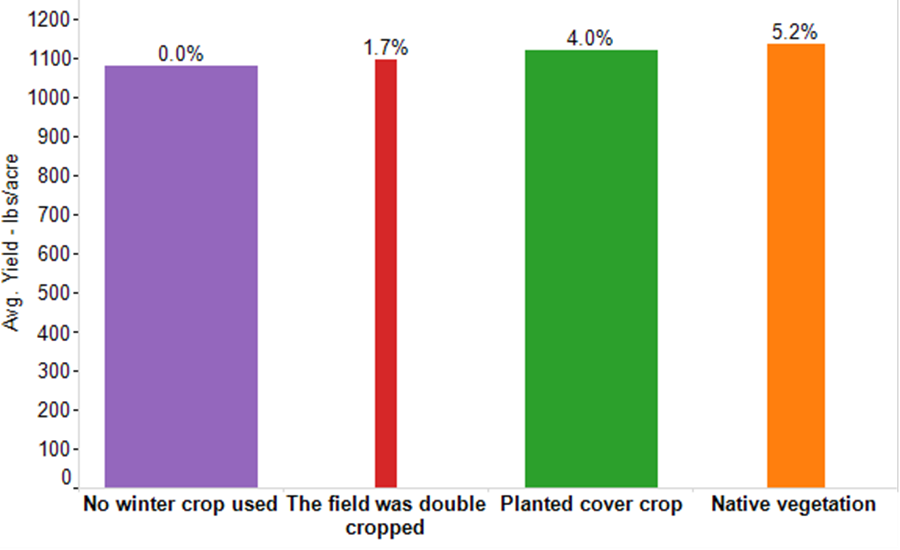
Fig. 10. Winter and cover crops use in relation to average plot yield
Tillage Practices
Cotton Incorporated has been emphasizing the benefits of conservation and no-till practices for more than 20 years (e.g., McClelland et al. 1993). The benefits from no-tillage systems are numerous and well documented, including reduced soil erosion, increased soil organic matter, and reduced fuel use (e.g., Triplett and Dick 2008). From 2008 to 2015, conventional tillage remained fairly constant; however, conservation tillage decreased as no-till/strip-till increased by a similar amount of 9%, as shown in Fig. 11. This change in tillage practices suggests that the education and outreach surrounding this management practice motivated some field-level changes.
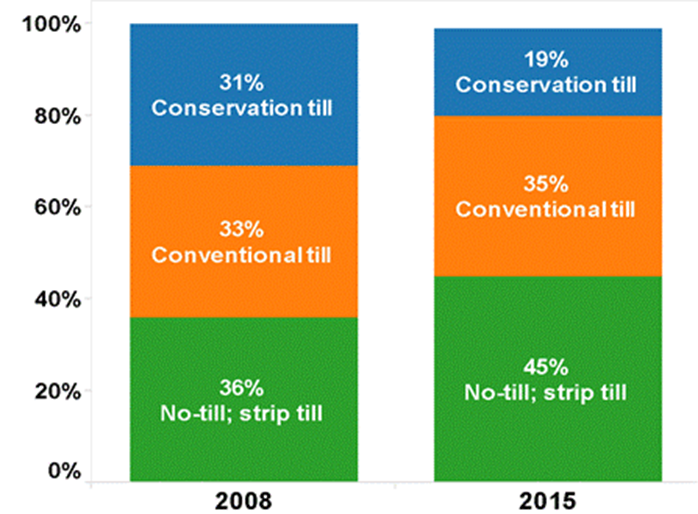
Fig. 11. Tillage systems use identified in the 2008 and 2015 surveys
The move from conventional tillage practices to no-till/strip-tilling has the potential to save the grower money, as less time and energy is required; however, many growers fear this move may reduce cotton yields. To understand the relationship of tillage practices to cotton yield, the yield for each tillage practice was plotted for each U.S. region, as shown in Fig. 12.
Examining the Far West first, the conventional till was most commonly used and the farmers using this method reported the highest yields. The Far West was the only region where the conventional tillage method had the highest reported yields. In the Mid-south and Southwest, the conservation tillage method had the highest reported cotton yields, with over 60 reported yields for both regions. Interestingly, the Southeast was unique with no-till/strip-till reported yields as the highest of the three practices, and the most common with over 280 reported yields. This supports a finding that farmers in the Southeast have adopted the less intensive tillage practices while maintaining yields higher than other tillage practices in the region. No-till/strip-till did have the lowest reported yields in the Mid-south and second lowest in the Southwest and Far West. With less intensive tillage practices, some loss in yield can be acceptable; however, the loss of production should be compared to the savings generated by less intensive tilling practices.
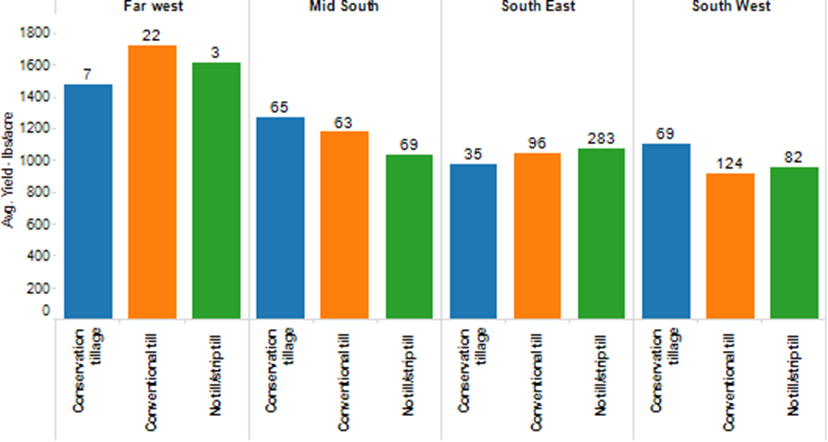
Fig. 12. U.S. cotton yields based on tillage method and region. The labeled number indicates the number of respondents in the region using the tillage method and the labeled percentage is the percent difference from the respondents using conventional tillage methods.
Soil Management
In the 2015 results, 94% of respondents identified at least one of 10 different practices listed to reduce soil erosion. The percentage of those using specific practices did not change greatly between 2008 and 2015, with two exceptions. In 2008, 71% of respondents indicated that they maintained surface cover in their fields, while in 2015 the number fell to 50%. This may be due to increased education by the Natural Resource Conservation Service and the cooperative extension service on what constitutes “residue.” However, in 2008, 39% indicated the use of winter cover crops, and that number increased to 48% in 2015.
There continues to be a high rate of soil sampling to determine fertilizer application rates; 80% of producers indicated soil sampling at least once every 2 years in 2015 (75% in 2008). Only 5% indicated they did not do soil fertility testing, which may be acceptable for low yield conditions where minimum inputs are used. Other factors also used as part of the fertilizer evaluation process were: consultant recommendations (49%), yield goals (61%), spatial data sets (soil and yield maps, 18%), and petiole or leaf tissue samples (24%). Sixty-three percent (46% in 2008) indicated some form of organic matter was used to enhance soil health, including use of cover crops (48%) and animal manures (30%).
The precision in fertilizer management is illustrated in Fig. 13 by showing the nutrient use efficiencies for nitrogen, phosphate, and potash by region (mass of cotton fiber produced per mass of nutrient applied). The consistent value near 10 kg of fiber per kg of nitrogen across all regions is encouraging, as that is very close to the current extension recommendations for cotton, which were recently verified by Main et al. (2013). As nitrogen is removed from the field in the cottonseed, it has to be consistently replaced. However, many soils are naturally rich in phosphate and/or potassium, and little of these nutrients are removed during cotton harvest, thus the greater variability by region.
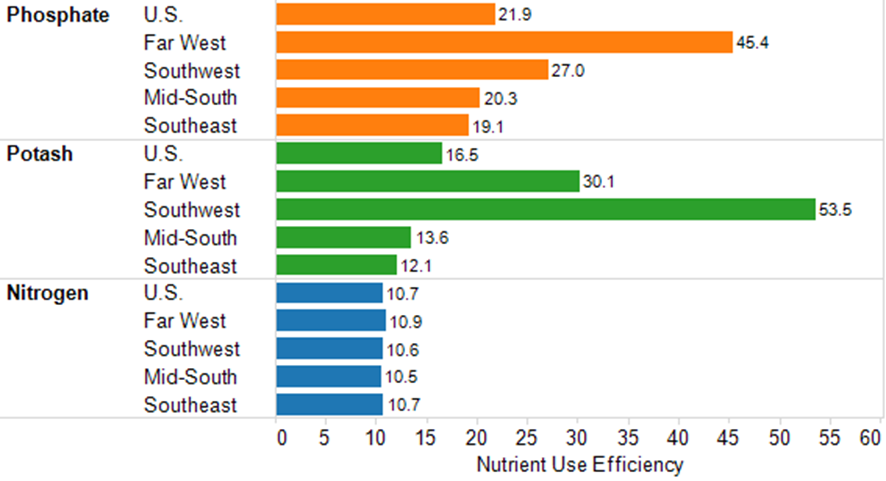
Fig. 13. Nutrient use efficiency by cotton growing region
Eighty-six percent indicated that fertilizer rates were based on soil test recommendations. There is evidence of this in the high nutrient use efficiency values shown previously. Nitrogen (N) application methods included 33% injecting N into the soil profile, 14% applying a band to the surface, 36% broadcasting, and 14% broadcasting followed by incorporation. In more arid regions, it is important to inject or incorporate nitrogen to limit losses to volatilization. On average, two trips were made during the season to apply fertilizer, increasing the probability and it is available to the crop when needed. Sixty-two percent are applying micro-nutrients, while 60% report applying lime.
Irrigation and Water
Survey respondent reported for the entire cropland examined (not just cotton), that 63% had at least some irrigated land in their enterprise, with 40% of the total cropped acres capable of receiving irrigation. Irrigation methods are an important factor for conserving water resources and maximizing water use efficiency. When comparing survey results from 2008 to 2015, there has been a trend towards less use of surface irrigation, as indicated in Fig. 14. In general, the change to pressurized systems results in higher water use efficiencies, as pressurized systems are easier to precisely control and operate. However, a well-designed surface system can be just as efficient as a center pivot.
In 2015, furrow irrigation represented 35% of the irrigation systems reportedly used. The use of tail water in these irrigation systems can reduce nutrient runoff, lower sedimentation in streams, and decrease water usage requirements. Sixty-two percent of the respondents using furrow irrigation systems reported using a tail water recovery system (i.e., a way to manage any water running off the end of the field). These methods ranged from: holding ponds (10%), pumping systems to return the water back to the top of the field (21%), and routing of runoff to other fields (16%). More than 70% who were furrow-irrigated reported they designed their irrigation system (flow rates and field slope) to minimize irrigation runoff.
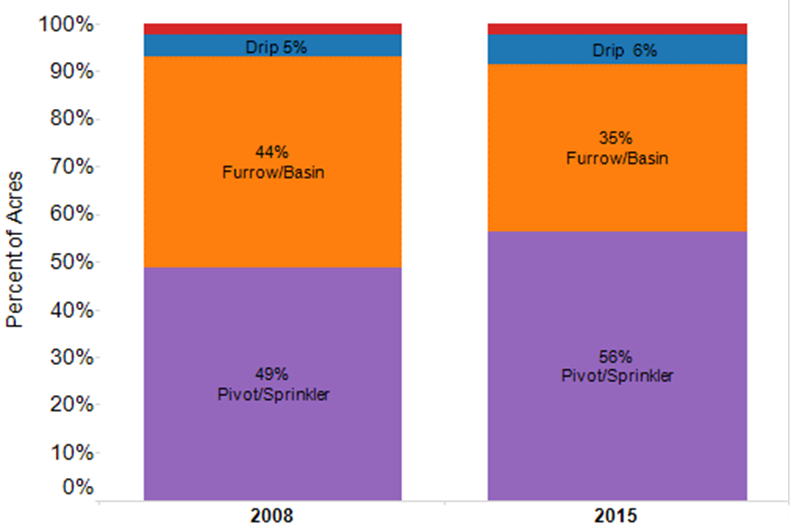
Fig. 14. Irrigation systems used in 2008 and 2015
The water sources used for cotton irrigation were primarily well water, with 91% of the respondents reporting its use. In addition to well water, 28% and 9% of the respondents reported using on farm surface water and off-farm surface water, respectively. Surface water was often used in conjunction with well water.
An area for possible improvement of irrigation water is to increase the use of flow measuring devices to track the volume of irrigation water used, as only 59% reported using such a device. It appears that many producers assume the system is delivering the volume of water it is designed to. While this is often a reasonable assumption, several factors can result in an irrigation system not performing as intended, such as fluctuations in the depth to the water table, aging pumps, and worn, leaking, or clogged sprinklers. A flow meter is a good tool to verify an irrigation system is working properly. Some may not install meters in fear that it could become a regulatory requirement.
Precision Farming Technology Farm Level Impacts
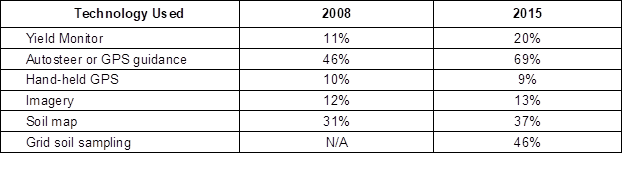
The farm level survey data suggests that yield monitoring, auto-steer, and GPS guidance systems increased dramatically from 11% to 20% and 46% to 69% from the 2008 to the 2015 survey years. Grid soil sampling use was not surveyed in 2008; however, 46% of the respondents in 2015 indicated its use, as shown in Table 3. The minimal use of hand-held GPS is likely a reflection of the fact that almost all smart phones now have an integrated GPS receiver, such that an independent GPS receiver is no longer needed. It will be interesting to see whether the use of imagery increases significantly once the FAA allows more extensive commercial use of unmanned aircraft systems.
Table 3. Precision Technologies Used in 2008 and 2015
The survey results and literature show that technology is being adopted; however, the increased value created by these new technologies is not always clear. The collected survey data enables a comparison of using several farming techniques and technologies to yields. In Fig. 15, irrigation scheduling, moisture monitoring, and nitrogen soil testing practices were compared to field level yields. Interestingly, the recorded plot level yields and irrigated water use efficiency (IWUE) were lower for growers using irrigation scheduling. However, the yield and IWUE were higher for growers using moisture monitoring programs. The data suggest that the use of moisture monitoring not only reduces the strain on water resources, but may also increase cotton yield, creating a direct benefit to the grower.
Most (84%) respondents indicated they determined when to irrigate by visual assessment of the crop. The remaining respondents used other scheduling approaches similar to results found in the 2008 survey: 14% used real-time evapotranspiration models and 19% used sensor-based scheduling. There was an increase in the consultation of weather forecasts in 2015, compared to 2008 (45% versus 25%), and a slight decrease in the use of plant monitoring techniques that fell from 40% in 2008 to 34% in 2015. There has been an increase in cotton water management research since the 2008 survey and better recommendations for infield monitoring have been developed (e.g., Perry and Barnes 2012). It is clear that now the focus needs to be on technology transfer, such as grower related publications, like that from Leib et al. (2015).
Increased field monitoring also had benefits in regards to nitrogen use. Growers using nitrogen testing reported higher yields and nitrogen use efficiencies (NUE) in most scenarios. There were two exceptions to the previous statement: in the Far West the yield was actually slightly lower (or not significantly different between the two data points) for growers using nitrogen testing, and in the Southwest, where the NUE were the same for farmers who didn’t do soil testing. In the Southwest, many of the non-irrigated producers are low input producers and fertilizers may not be applied if there is not a sufficient reserve of soil moisture at the beginning of the season. If it does rain more than expected, these fields can become nitrogen limited and result in high NUEs.
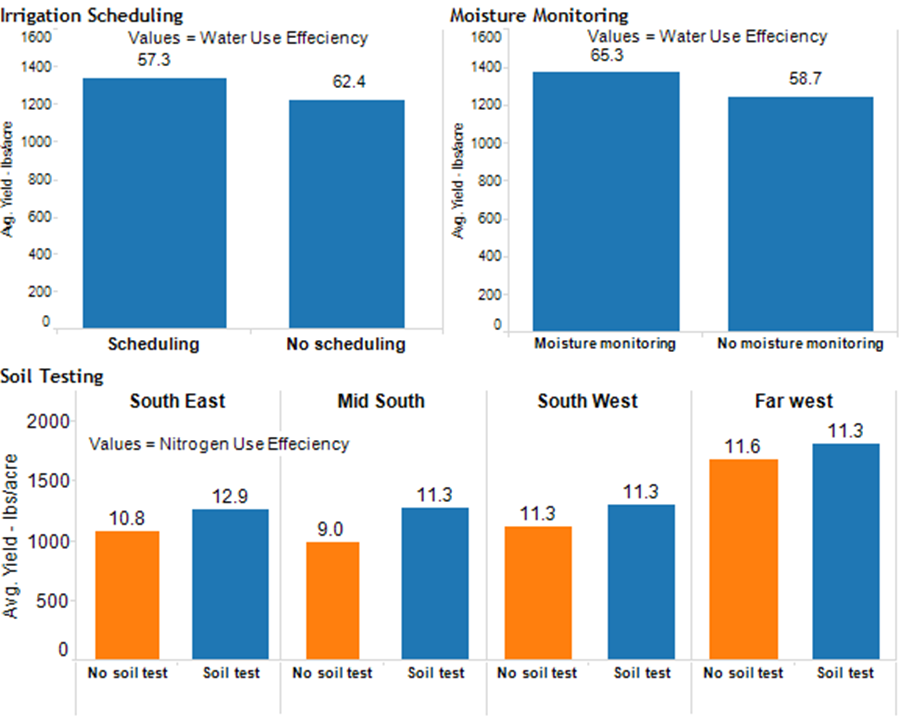
Fig. 15. Yields for plots with field monitoring for nitrogen and moisture and irrigation scheduling
Crop performance was also measured as a function of the use of other precision agriculture technologies such as GPS, yield monitoring, autosteer GPS, and imaging. Differences observed in yields as a function of technology adoption does not indicate that if the technology was adopted that a farmers’ yield would necessarily increase; however, it does indicate that farmers using the technology have higher yields, for example, but these increased yields are affected by many other aspects beyond technology use. With this interpretation precautionary note, Fig. 16 indicates that farmers in most regions who adopted the examined technologies reported higher yields. In Fig. 16, the average cotton yield is located on the Y-axis and the width of each bar and the number at the top of each bar correspond to the number of respondents in each yes or no category. This analysis provides the viewer with both the sample number for each category and the corresponding average yield.
Farmers reporting the use of handheld GPS systems had resulting yields higher than those who did not in all regions except the Southeast. The Southeast, interestingly, also had the most respondents reporting the use of GPS systems. The Mid-South and Far-West reported the largest difference in yields for the adoption of GPS systems; however, the number of respondents in the Far West was small (4) and making this larger change less meaningful due to the small sample size. Overall, few growers use GPS systems and the ones that do use it, generally report higher cotton yields.
Real time yield monitoring has rapidly become more common on many cotton pickers with the progression of computer and sensor technologies. Other research has shown that many cotton pickers have the ability to monitor yield; however, growers do not use this feature due to varying reasons. Growers using real time yield monitoring have reported higher average cotton yields for all growing regions. These results could highlight the benefit of yields from yield monitoring, such as granular data surrounding crop performance in certain field regions, which can help inform and improve management strategies. The overall trend indicates that few farmers are using the real time yield monitoring, with the highest adoption in the Mid-south at 38%, but the growers using this technology report higher average yields for all regions. Additional outreach and education around the benefits of yield monitoring as well as assisting growers with integrating real time yields monitoring could increase its use and may increase average cotton yields.
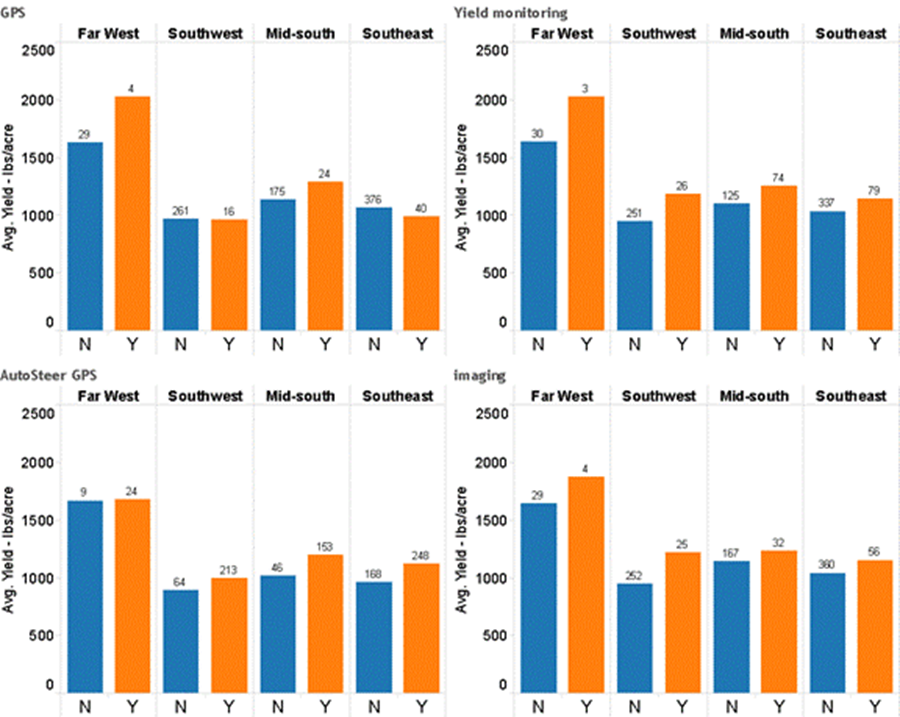
Fig. 16. Precision agriculture use by region and corresponding reported yields. Labeled values correspond to number of respondents
Grower adoption of autosteer systems was overwhelming in all regions, with more than 60% adoption in all growing regions. The average reported yields for all regions were higher for growers using autosteer, except in the Far West, where there was little change. Field imaging was far less implemented among growers, but also showed similar yield results, with the average reported yields for growers using imaging higher for all regions. The Southeast reported the highest use of imaging among all regions, with 14% of the farmers using this technology. Given the relatively low use of this technology and the possible benefits to field productivity, more outreach and education to promote imaging could have positive effects on cotton yields. The future application of drones in agriculture may also make imaging technology more widely available, cost effective, and timely, compared to satellite or manned aircraft.
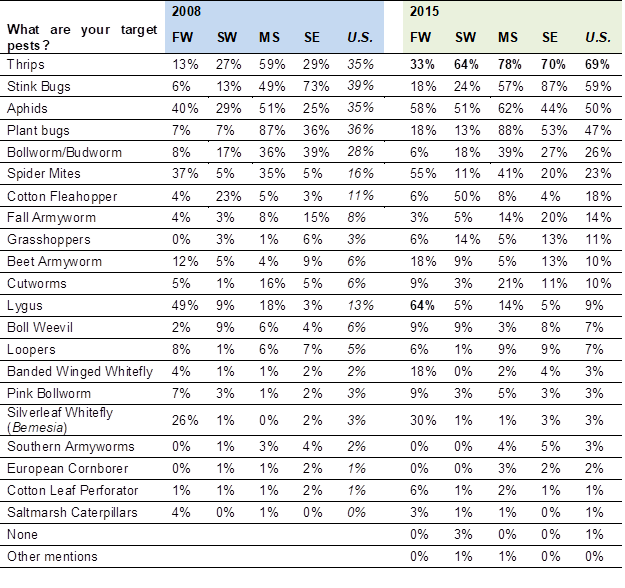
Table 4. Target Pests for 2008 and 2015
Farmers using precision agriculture technologies generally reported higher field performance based on resource efficiencies and yields. The reported difference could be resulting from many variables; however, increased technology adoption could lead to increased field performance. In the eyes of the cotton grower, the potential increased field performance must create savings or increase revenue enough to justify the capital and manpower to implement these technologies. Organizations such as Cotton Incorporated can help reduce the manpower and startup difficulties surrounding the technology adoption, although the financial burden falls solely on the grower at this point.
A clear concern for cotton producers are herbicide resistant weeds, as evidenced by the fact that 72% indicated that they check for weed escapes (76% in 2008), 82% used a pre-emergent herbicide (70% in 2008), 79% alternated herbicide modes of action (62% in 2008), and 66% reported hand hoeing (not asked in 2008). Producers are also taking advantage of new technologies to be more precise in their application with 92% reporting at least one upgrade in the last 10 years. This includes adding GPS-based swath control (51% in 2015; 32% in 2008), guidance systems (64% in 2015; 44% in 2008) and real-time flow control (60% in 2015; 55% in 2008). Most applications are done with a ground rig (85%) as opposed to aerial (similar results in 2008) while, 71% indicated they use a professional consultant to advise them when to treat with a foliar insecticide, and less than 6% indicated using a calendar-based spray schedule. Thirty-three percent indicated they had fields that received no foliar insecticides during the season (29% in 2008). The estimated acres not treated with insecticide totaled 174,795 (21% of reported cotton acres).
Table 5. Cotton Grower Target Pest by Region and U.S. Average
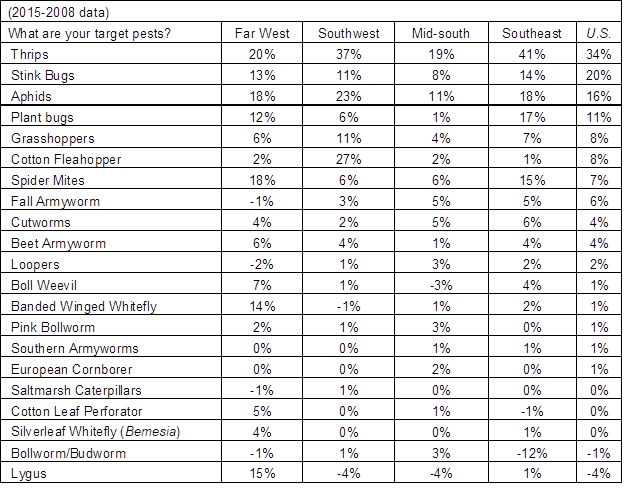
Values shown are the difference between 2008 and 2015 data (2015-2008).
On average, producers made six trips across the field to apply herbicides, insecticides, growth regulators, and harvest aids during the year. In these applications, growers reported an average of two products mixed, such as two herbicides with different modes of action to minimize weed resistance. For the insecticide applications, there were similar distributions of target pest in 2008 and 2015, with a noticeable increase in thrips in 2015, detailed in Table 4 and 5. There have been reports of thrips developing resistance to certain seed applied insecticides, and one product that controlled thrips was removed from the market, so managing them has become more difficult.
Additional Field Productivity Analysis
Field productivity is an important measure that can drive grower profitability. In 2014, the average U.S. cotton yield was approximately 838 pounds per acre based on USDA data compared to the average of 1079 pounds per acre in this survey. Two possible explanations for the differences are that 1) producers tended to report on their better fields – not the “typical” field as requested; and 2) the producers willing to report data in this survey are likely to be above average agronomic managers and, as already noted, had extensive experience growing cotton.
One goal of this report was to compare how crop performance has changed since the previous survey. The yields, on average, for 2014 were 37 lb. per acre higher than the 2008 survey results. Yield increases were observed in all regions except the Southwest, with the Southeast having an 18% increase compared to 2008 data, illustrated in Fig. 17.
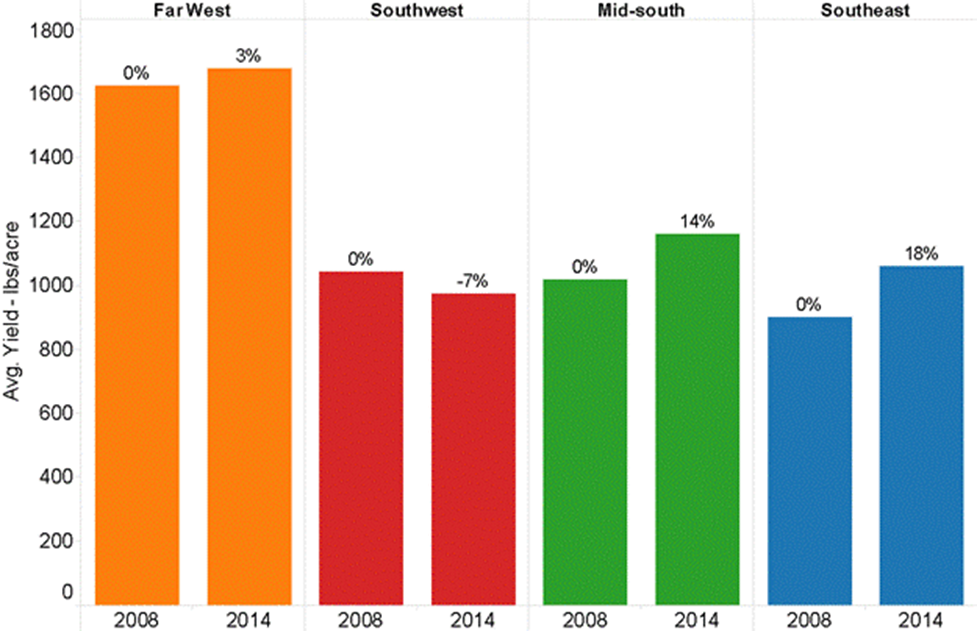
Fig. 17. Average yield by region for 2008 and 2014. Labeled values represent percent change from 2008 yields
Many factors can influence the average yields, such as rainfall and other climate considerations making it difficult to determine the causes of yield changes from year to year. In particular, in 2007 the Southeast experienced a notable drought which would have lowered cotton yields for non-irrigated plots.
An analysis was also performed to determine average yields based on survey response dates and education. One hypothesis tested was that early responders to the survey are more proactive and would have proactive growing methods that would result in higher yields. The data collected in this survey did not support this hypothesis. There were no real trends to suggest that the respondents completing the survey earlier had higher yields.
A second hypothesis was that growers with higher education levels would report higher yields. The respondent data did not support this hypothesis either, as there were no significant improvements in yield with higher education levels, depicted in Fig. 18. It is worth noting that bachelor degrees were most commonly held by growers, and these growers generally performed higher than most of the other education levels; however, the average yields were not statistically different.
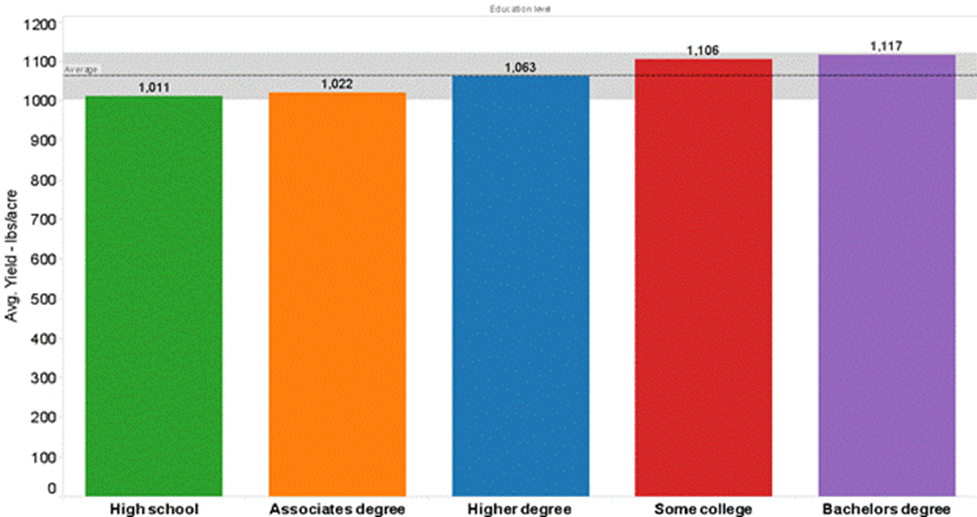
Fig. 18. Average yields by education level
Conservation Practices and Natural Habitat Management
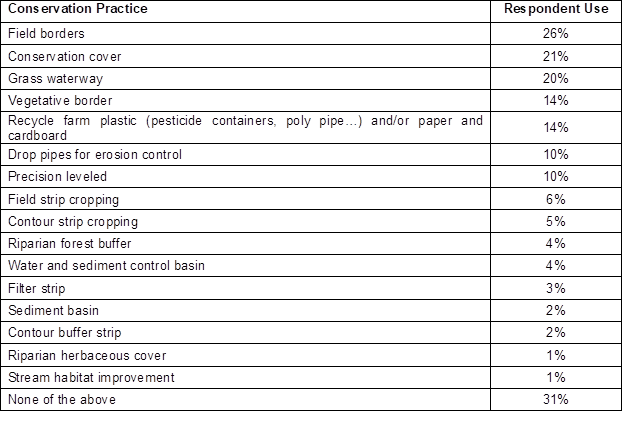
Conservation practices play an important role in minimizing the environmental impacts of cotton growth and preserving the environment, which is needed to sustain continual cotton production into the future. To understand the adoption of certain practices, the survey asked growers to indicate which if any conservation practices are used on their farm. Of the conservation practices listed, 69% of the growers indicated using at least one of the practices. The top three implemented practices were field borders, conservation cover, and grass waterway, with more than 20% adoption for all three practices.
Table 6. Percent Using Listed Conservation Practice
Natural habitat management practices were also surveyed to gain an understanding of what growers do to preserve land for ecological reasons. Of the 66% of producers who indicated they have riparian areas on their farm, 74% indicated they leave the riparian areas undisturbed, compared to 53% in 2008.
Also, 68% of respondents indicated they make efforts to improve the wildlife habitat on their farm (58% in 2008). For example, 41% indicated they maintain field borders so they are conductive for wildlife habitat, and 32% indicated they preserve forested areas for wildlife.
Detailed Field Specific Data
Producers were asked about specific production practices for a cotton field that represents typical conditions on their farm. For example, if most of the farm is irrigated, then they were instructed to report on an irrigated field. A majority of the responses (86%) were for the 2014 crop year, and 12% for 2013. Due to climatic differences, planting and harvest dates ranged by region. Typical planting occurred in April or May and harvest in October or November for most of the U.S. Some of the field specific responses are summarized by region in Table 7. Of the fields selected, 45% were irrigated, which is slightly higher than the U.S. average of 40%. On average the fields were 18 miles to the gin.
Table 7. Regional Averages Based on Field Specific Questions for 2015
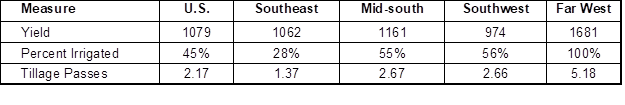
As noted earlier, there is room for improvement on water management, as 45% of those reporting on an irrigated field did not know (or want to report) the amount of irrigation applied. As mentioned previously, only 38% of respondents indicated that the fields were equipped with a flow meter. Fifty percent reported a pumping depth of less than 175 feet. Twenty-one percent reported they did not have a pressure gauge on the pump or system and 31% did not know an operation pressure. For the pressures reported, more than 50% had an operating pressure under 30 psi. A majority of irrigation pumps were electric (67%) followed by diesel (24%).
Energy Use and Greenhouse Gas (GHG) Emissions
Energy hotspot analysis
Similar to the 2008 analysis of energy use and greenhouse gas emissions, cotton’s footprint from field to gin continued to be dominated by fertilizer use for both irrigated and non-irrigated production systems, as illustrated in Fig. 19.
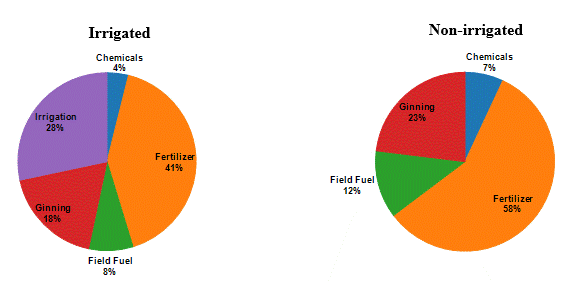
Fig. 19. Energy use distribution for irrigated and non-irrigated production systems
The primary fertilizer impact is associated with the energy intensive nitrogen production process as determined by Wang 2007. Data for GHG distribution are not shown, as they were closely correlated to energy, with the exception of nitrogen, which becomes even more dominant due to assumed in-field nitrous oxide emissions (Synder et al. 2012). Since the 2008 survey, Cotton Incorporated has extensively researched nitrogen management recommendations for modern cotton varieties (Main et al. 2013). The 2015 survey data show that producers are achieving nitrogen use efficiencies very close to university recommendations across the Cotton Belt, indicating that producers are aware of the importance of good nitrogen management. Progress has also been made in developing tractor-mounted sensors to vary nitrogen application rates to match the crop needs in the field real-time (e.g., Raper et al. 2013). Such advancements should continue to improve nitrogen use efficiencies and lower cultivation energy requirements.
Field performance and GHG emissions
Using the respondent data of crop performance and field practices, additional analysis was performed to find correlations and trends between 1) GHG emissions and energy use, and 2) field practices and performance. Tillage practices have a considerable impact on cost, and to an extent on energy use, representing 8% and 14% of the overall energy use for the irrigated and non-irrigated production systems. In Fig. 20, field energy use is reported by tillage systems for each region. This analysis indicates that conventional tillage uses the most energy, followed by conservation (-18%), and strip-till/no-tillage methods (-49%). These results are consistent with what should be observed in practice and highlight the energy and related expense savings of the less intensive tillage systems.
When performing a similar analysis, but using GHG emissions per pound of cotton as the dependent variable, fuel usage from less intensive tillage practices did not correlate with reduced GHG emissions per pound of cotton. In Fig. 21, the data do not show a clear decrease in GHG emissions based on tillage methods. Since fertilizer was the largest contributor to GHG, the fertilizer usage is also listed for each tillage system; however, there was no clear trend related to tillage practice and nitrogen use. This indicates that other factors are driving the GHG emission per lb. of cotton, such as productivity.
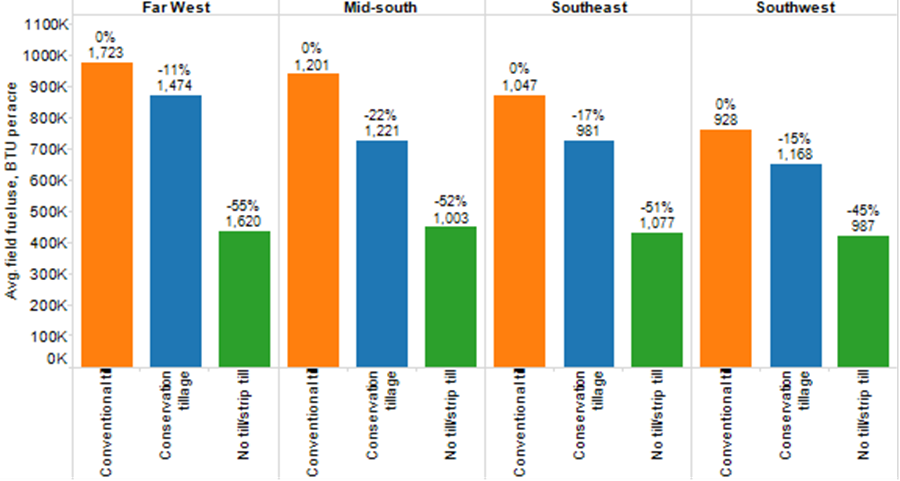
Fig. 20. Field fuel usage based on tillage practices by region. Percentages represent percent difference from conventional tillage and the number represents average yield for the corresponding data.
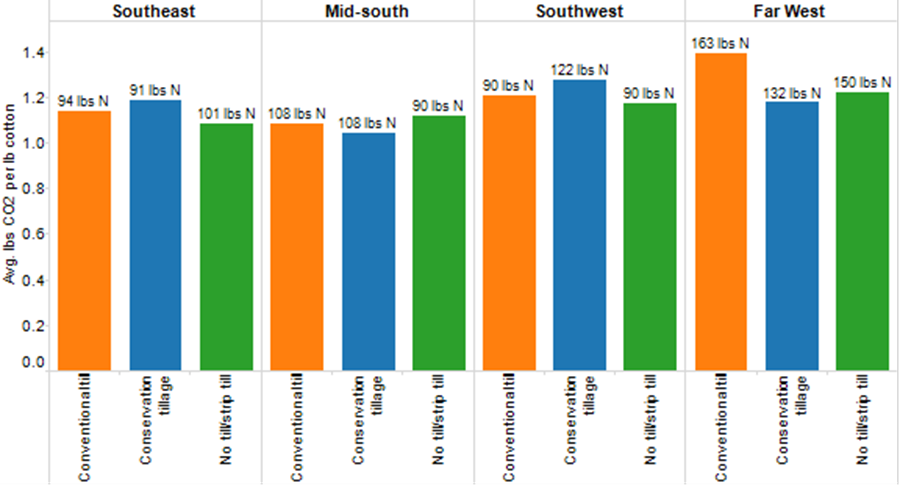
Fig. 21. Average GHG emissions as a function of region and tillage methods. The average applied nitrogen for each data group is listed above the bar with units of lbs N per acre.
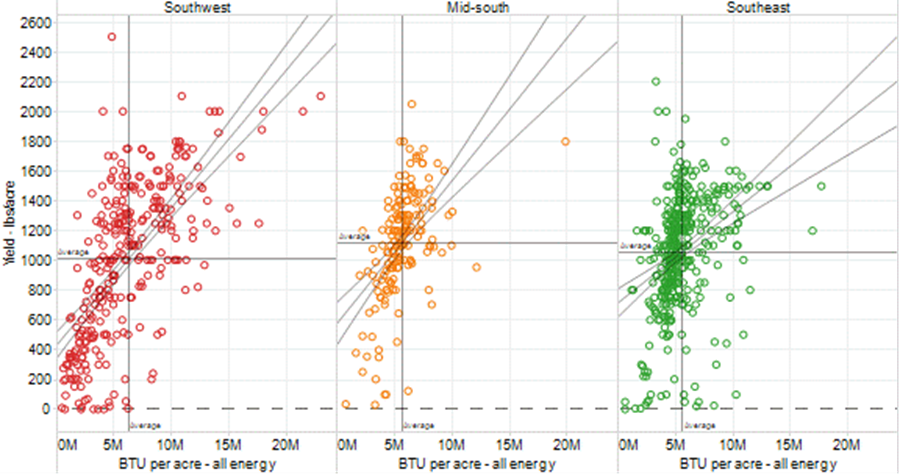
Fig. 22. Yield as a function of energy input per acre for each region. Trend lines represented for all regions and have a P-value less than 0.0001 for all regions except the Far West where the trend is not significant, having a P-value higher than 0.05.
Since conservation and no-till practices result in lower yields, the GHG emissions savings produced from the tillage practice are negated, which effectively increases all inputs and emissions per unit of cotton.
Productivity (yield), as previously shown, has a large influence over the GHG emission per pound of cotton. With increased energy use and production related GHG emission on a per acre basis, yields often increase, which decreases the GHG emissions per mass of cotton produced. The relationship between energy use per acre and yield are shown in Fig. 23. There is a clear trend showing that increased energy inputs result in higher yields, except in the Far West. The trend lines shown on the plot all have a P-value of less than 0.05, indicating that the trend lines are significant, except for the Far West plot where the P-value was greater than 0.05. The Far West data did not show a clear trend, perhaps due to the low sample size for that region. Examining yield as a function of GHG emissions per acre, Fig. 23, displays a similar trend as energy and yield, where increased GHG emissions per acre correlate to increased yield, except for the Far West region. While these figures show that increasing yield often requires more energy and creates more GHG emissions per acre, the increased GHG per acres are negated by the increased output per acre when examining the GHG per lb. of cotton.
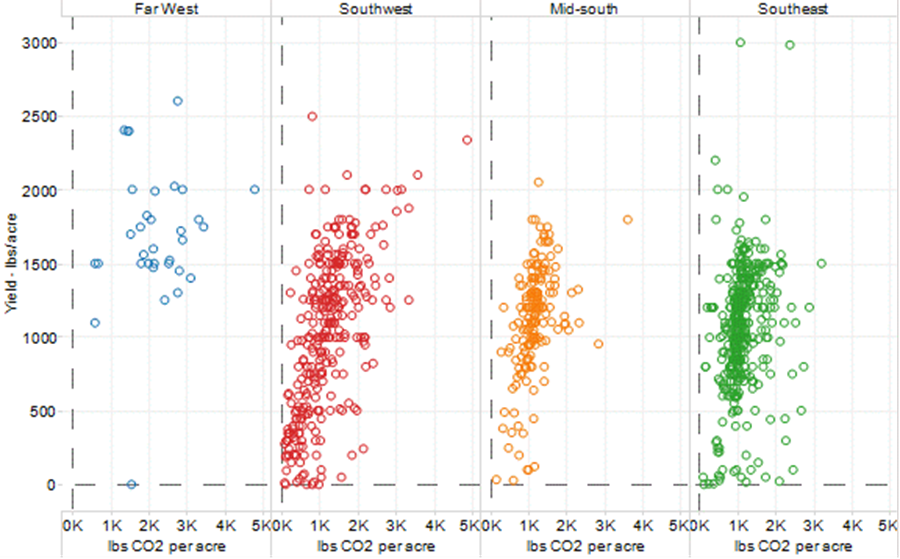
Fig. 23. Yield as a function of GHG emissions per acre by region
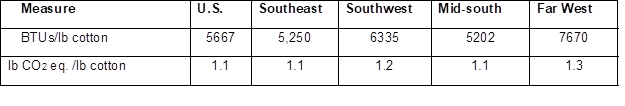
The resulting GHG emission averages per region were all similar with an U.S. average of 1.1 lb. of CO2 per lb. of cotton, as depicted in Table 8. Energy use per lb. of cotton was slightly higher in the Southwest and Far West due in part to higher use of irrigation. These values are estimates based on parameters similar to those used in the Fieldprint Calculator.
Table 8. Energy Use and GHG Emissions per lb of Cotton by Region
CONCLUSIONS
- The use of an agriculture survey can provide valuable insight into current agriculture systems and track how outreach and technology adoption influences the farming practices over time.
- The 2015 survey results provided a representative dataset of cotton growers in the U.S.
- Cotton GHG emissions are highly dependent on variables such as yield, irrigation requirements, and nitrogen use efficiency.
- The data consistently suggest that precision agriculture technologies and other advanced field monitor techniques (g., soil sampling, sensor-based soil moisture monitoring) may increase field productivity and resource use efficiency.
- Some growers using conservation and no-till/strip-tillage practices reported lower yields; however, they also reported lower field energy usage resulting in lower production costs.
- Since the 2008 survey, many growers have transitioned to more efficient pivot/sprinkler irrigation methods from furrow/basin methods.
- Growers reporting the use of cover crops as well as allowing native vegetation reported higher yields as compared to no cover crops.
- Growers are aware of the importance of conservation, with 69% of growers reported using at least one conservation practice on their farms.
- Grower concerns for environmental impacts of cotton production have increased in importance from the 31st ranked in 2008 to the 7th most important issue in 2015.
- Further industry outreach supporting the use of precision agriculture and other best practices can increasingly drive resource-use efficiencies and reduce environmental impacts, which should be measured by additional surveys.
ACKNOWLEDGMENTS
This work could not have been performed without funding from Cotton Incorporated and the many farmers who completed the natural resource survey.
REFERENCES CITED
ASABE. (2011). ASAE D497.7. Agricultural Machinery Management Data Standard. ASABE, 2940 Niles Road, St. Joseph, MI.
Cotton Incorporated. (2012). “Life Cycle Assessment of Cotton Fiber & Fabric Full Report, Version 2.1,” (http://cottontoday.cottoninc.com/wp-content/uploads/2014/07/LCA_Full_Report.pdf), Site confirmed 10 May 2016.
Cotton Life Style Monitor. (2016). (http://lifestylemonitor.cottoninc.com/category/
topic/environment/), Site Confirmed 1 May 2016.
Department of Energy. (2015). “Alternative Fuels Data Center – Fuel Properties Comparison,” (http://www.afdc.energy.gov/fuels/fuel_comparison_chart.pdf), Site confirmed 15 December 2015.
Energy Information Administration. (2013a). “Carbon dioxide emissions coefficients, U.S. Energy Information Administration,” (http://www.eia.gov/environment/ emissions/co2_vol_mass.cfm), Site confirmed 15 December 2015.
Energy Information Administration. (2013b). “State electricity profiles,” http://www.eia.gov/electricity/state/unitedstates/. Site confirmed December 15, 2015.
Faulkner, W., Wanjura, J., Bowman, R., Shaw, B., and Parnell, C. (2011). “Evaluation of modern cotton harvest systems on irrigated cotton: Harvester performance,” Applied Engineering in Agriculture 27(4): 497‐506.
Field to Market. (2012). “Environmental and socioeconomic indicators for measuring outcomes of on-farm agricultural production in the United States: Second report (Version 2),” (https://www.fieldtomarket.org/report/), Site confirmed 1 May 2016.
Fieldprint Calculator. (2016). (https://www.fieldtomarket.org/).
Hardin, B., and Funk, P. (2014). “Energy monitoring in gins – 2013 Update,” in: Proceedings of the 2014 Beltwide Cotton Conferences, New Orleans, LA, pp. 576-583.
Hoffman, G., Howell, T., and Solomon, K. (1992). “Management of Farm Irrigation Systems,” ASAE Monograph Number 9, 723-724.
ISO (2007). “The ISO survey of ISO 9000 and ISO 14000 Certifications: 16th cycle,” International Organization for Standardization, Geneva, Switzerland.
Leib, B., J. Payero, Pringle, L., Bordovsky, J., Porter, W., and Barnes, E. (2015). “Placement and interpretation of soil moisture sensors for irrigated cotton production in humid regions,” (https://cottoncultivated.cottoninc.com/wp-content/uploads/2015/12/Soil-Moisture.final-web1.pdf).
Levi Straus & Co. (2015). “Life cycle assessment of a jean,” (http://levistrauss.com/wp-content/uploads/2015/03/Full-LCA-Results-Deck-FINAL.pdf), Site confirmed 10 May 2016.
Main, C. L., Barber, L. T., Boman, R. K., Chapman, K., Dodds, D. M., Duncan, S. R., Edmisten, K. L., Horn, P., Jones, M. A., and Morgan, G. D. (2013). “Effects of nitrogen and planting seed size on cotton growth, development and yield,” Agronomy Journal 105(6), 1853-1859.
McClelland, M., T. D. Valco, and R. E. Frans (eds.) (1993). Conservation-tillage Systems for Cotton: A Review of Research and Demonstration Results from Across the Cotton Belt. Special Report 160, Arkansas Agricultural Experiment Station, Fayetteville, AR.
National Cotton Council of America (2014). “Results from a cotton precision farming survey across fourteen Southern states,” in: Proceedings of the Beltwide Cotton Conferences, New Orleans, LA.
Perry, C., and Barnes, E. (2012). “Cotton irrigation management for humid regions,” (http://www.cottoninc.com/fiber/AgriculturalDisciplines/Engineering/Irrigation-Management/cotton-irrigation-web.pdf), Site confirmed 15 December 2015.
Raper, T. B., Varco, J. J., and Hubbard, K. J. (2013). “Canopy-based normalized difference vegetation index sensors for monitoring cotton nitrogen status,” Agronomy Journal 105(5), 1345-1354.
Reed, J. N., Barnes, E. M., and Hake, K. D. (2009). Technical Information Section. US Cotton Growers Respond to Natural Resource Survey, International Cotton Advisory Committee, The ICAC Recorder. XXVII(2), June.
Sustainable Apparel Coalition. (2016). “Higg index,” (http://apparelcoalition.org/the-higg-index/), Confirmed 1 May 2016.
Synder, C. S., and Fixen, P. E. (2012). “Plant nutrient management and risks of nitrous oxide emission,” Journal of Soil Water Conservation 67(5), 137A-144A.
Triplett, G. B., and Dick, W. A. (2008). “No-tillage crop production: A revolution in agriculture!” Agronomy Journal 100:S-153–S-165.
United States Department of Agriculture (USDA), (2010). USDA NRCS National Cartographic and Geospatial Center, Fort Worth, TX.
United States Department of Agriculture (USDA) (2015). “United States Department of Agriculture, Foreign Agricultural Service,” (http://apps.fas.usda.gov/psdonline/psdquery.aspx), Accessed 17 November 2015.
USDA National Resources Conservation Services (1998). “National Soil Service Center Dominant Soil Orders,” (http://www.nrcs.usda.gov/Internet/ FSE_MEDIA/stelprdb1237749.pdf), Site confirmed 10 May 2016.
Valco, T., Ashley, H., Findley, D., Green, J., Isom, R., Price, T., and Fainnin, J. (2015). “Cost of ginning 2013 survey results,” in: 2015 Cotton Beltwide Conferences, San Antonio, TX.
Wang, M. (2007). “The Greenhouse Gases, Regulated Emissions, and Energy Use in Transportation (GREET) Model, Argonne National Laboratory,” (http://www.transportation.anl.gov/software/GREET/index.html).
Willcutt, M., Buschermohle, M., Barnes, E., To, F., Field, J., and Allen, P. (2009). “In field time in motion comparisons of conventional, John Deere 7760, and Case 625 Module Express cotton pickers,” in: Beltwide Cotton Conferences, San Antonio, TX.
Article submitted: June 21, 2016; Peer review completed: August 27, 2016; Revised version received and accepted: October 31, 2016; Published: November 16, 2016.
DOI: 10.15376/biores.12.1.362-392