
Abstract
The degradation of lignocellulosic materials requires the synergy of multiple enzymes. Synergistic fermentation would be an alternative to a complete enzyme system and consequentially enhance enzymatic production. The present study used cellulolytic fungus of Penicillium decumbens, Aspergillus niger C112, and Trichoderma reesei RutC-30 as the starting strains, to screen for the best combination and proportion of synergistic fermentation. The experiments of different combinations and inoculum ratios for synergistic fermentation were performed, and Box-Behnken designs were adopted to optimize the fermentation conditions. The best combination of strains was confirmed as T. reesei RutC-30 and P. decumbens with an 8:2 inoculum ratio. The maximum sugar concentration was 1.48 g/L with CMCase (17.53 U/mL) and FPase (4.78 U/mL) in this situation. Response surface methodology revealed the optimized parameters as a substrate concentration of 5.93% at 32.12 °C, and a fermentation time of 5.85 d with a predicted sugar concentration of 2.91 g/L. Under these conditions, a maximum sugar production of 2.96 g/L was achieved in verification experiments.
Download PDF
Full Article
Synergistic Fermentation of Camphor Leaves by Cellulolytic Fungus and Optimization of Reducing Sugar Production
Lei Zeng,a,b,c Baiquan Zeng,a,b,c,* Jienan Chen,a,b,c Lin Zhang,a,b,c Peng Zhan,a,b,c Beiguo Hu,a and Yini Zhang a
The degradation of lignocellulosic materials requires the synergy of multiple enzymes. Synergistic fermentation would be an alternative to a complete enzyme system and consequentially enhance enzymatic production. The present study used cellulolytic fungus of Penicillium decumbens, Aspergillus niger C112, and Trichoderma reesei RutC-30 as the starting strains, to screen for the best combination and proportion of synergistic fermentation. The experiments of different combinations and inoculum ratios for synergistic fermentation were performed, and Box-Behnken designs were adopted to optimize the fermentation conditions. The best combination of strains was confirmed as T. reesei RutC-30 and P. decumbens with an 8:2 inoculum ratio. The maximum sugar concentration was 1.48 g/L with CMCase (17.53 U/mL) and FPase (4.78 U/mL) in this situation. Response surface methodology revealed the optimized parameters as a substrate concentration of 5.93% at 32.12 °C, and a fermentation time of 5.85 d with a predicted sugar concentration of 2.91 g/L. Under these conditions, a maximum sugar production of 2.96 g/L was achieved in verification experiments.
Keywords: Camphor leaves; Synergistic fermentation; Cellulose conversion; Cellulase; Fermentation conditions optimization
Contact information: a: College of Life Science and Technology, Central South University of Forestry & Technology, Changsha, 410018, China; b: Ministry of Forestry Bioethanol Research Center, Changsha, 410018, China; c: Hunan Engineering Research Center for Woody Biomass Conversion, Changsha 410018, China; *Corresponding author: baiquanzhn@163.com
INTRODUCTION
With the increased consumption of petroleum resources, the key to promoting the utilization of bioresources is to use industrial biotechnology to convert biomass to chemical products and liquid fuels (Fang et al. 2010). Cellulose as a renewable resource exists widely in large quantities on earth. Alternatively, cellulolytic materials account for approximately 60% to 80% of total biomass, with the immense potential for bioenergy development and other production that is commonly used (Chen and Li 2002).
Using cellulase for biomass hydrolysis is one of main methods in the development and utilization of bioresources (Cherubini 2010). Currently, most of the cellulase in bioethanol production is produced by Trichoderma reesei. However, the β-glycosidase activity is lower in the cellulase system produced by Trichoderma sp., which leads to the accumulation of cellobiose, and subsequently inhibits cellulose hydrolysis (Wen et al. 2005).
With different strains cultured together, synergistic fermentation could complement the enzyme system and increase the utilization of substrates and eliminate the cellobiose inhibition. Synergistic fermentation by Saccharomyces cerevisiae and Pichia anomala could produce more esters and effectively improve the flavor characteristics of fermentation products (Tang et al. 2012). Trichoderma viride Mut-19 and Aspergillus niger also could substantially increase the activity of filter paperase (FPase) and β-glycosidase, and improve the straw degradation ability in synergistic fermentation (Gao et al. 2012).
The camphor tree is an important wood resource that is widely planted in most cities in the subtropical region. Camphor tree leaves are a cellulose material with few lignin present that could be easily hydrolyzed by the cellulolytic fungus. However, its fallen leaves are generally incinerated, which not only causes environmental pollution, but also wastes a vast amount of resources (Zeng et al. 2015). This study aims to investigate the optimum strains from commonly used cellulolytic fungus for the synergistic fermentation of camphor leaves. In addition, fermentation condition optimization was also examined to enhance the reducing sugar production for subsequently produced bioethanol.
EXPERIMENTAL
Materials
Bacterium
- decumbens and A. niger C112 was provided by the Fermentation Engineering Laboratory of the Central South University of Forestry and Technology (Changsha, China). T. reesei RutC-30 was provided by the National Bioethanol Research Center of Central South University of Forestry and Technology (Changsha, China).
Feedstock and pre-treatment
Camphor leaves were collected from the Central South University of Forestry and Technology campus (Changsha, China) for a high temperature alkali pre-treatment (Zeng et al. 2015). The camphor leaves were made into powder form by a grinder (Beijing Yanshan Masanori Machinery Co. Ltd., Beijing, China). The camphor leaf powder was pretreated with 5% potassium hydroxide (KOH).
Software
The graphs and images throughout the experiment were obtained by Origin Version 7.5 (OriginLab Inc., Northampton, MA, USA) and Design-Expert version 8.0.6 (Stat-Ease Inc., Minneapolis, MN, USA) software.
Methods
Medium formulation
The seed medium for this study contained the following: P. decumbens, 2 g/L potassium phosphate monobasic (KH2PO4), 4 g/L potassium hydrogen phosphate anhydrous (K2HPO4), 0.5 g/L magnesium sulfate heptahydrate (MgSO4·7H2O), 10 g/L glucose, 5 g/L peptone, and 4 g/L yeast extract. A. niger C112 contained 2 g/L K2HPO4, 0.5 g/L MgSO4·7H2O, 15 g/L glucose, and 4 g/L yeast extract. T. reesei RutC-30 contained 20 g/L glucose, 1 g/L peptone, 1 mL/L Mandels trace elements concentrate (0.005 g/L of Iron (II) sulfate heptahydrate (FeSO4·7H2O), 0.0014 g/L of zinc sulfate heptahydrate (ZnSO4·7H2O), 0.0016 g/L of manganese (II) sulfate monohydrate (MnSO4·H2O), 0.0037 g/L of cobalt chloride hexahydrate [CoCl2·6H2O]), 100 mL/L Mandels nutrient concentrate (5 g/L of ammonium sulfate [(NH4)2SO4], 15 g/L of KH2PO4, 0.6 g/L of calcium chloride (CaCl2), 0.6g/L of MgSO4·7H2O), and 50 mL/L of citrate buffer (1.0 M).
The basal medium contained the following: 50 g/L camphor leaves powder, 1.25 g/L KH2PO4, 5 g/L K2HPO4, 0.25 g/L MgSO4·7H2O, 5 g/L (NH4)2SO4, 15 g/L sodium chloride (NaCl), and 0.25 g/L CaCl2.
Fermentation
Synergistic fermentations were performed in a 250-mL flask containing 50 mL of the basal medium sterilized at 121 °C for 25 min. According to different combinations and proportions, inoculated 10% (v/v) seed cultures were placed into the medium and incubated at 28 °C with 180 rpm for 5 d in the Incubator shaker ZWY-2102C (ZhiCheng Inc., Shanghai, China). The fermentation broth was centrifuged at 4 °C and 5000 rpm for 10 min by the Microfuge 22R Centrifuge (BeckMan Coulter Inc., Brea, CA, USA), and the crude enzyme in the supernatant was used to determine the reducing sugar concentration and cellulase activities (Zeng et al. 2015).
Analytical methods
The reducing sugar concentration was determined according to the method described by Zeng et al. (2015). The assay was conducted in a 25-mL tube containing 2 mL of crude enzyme with 3 mL of dinitrosalicylic acid (DNS, Sinopharm Chemical Reagent Co. Ltd., Shanghai, China). This was incubated in a boiling water-bath for 10 min. The cellulase activity was determined by the method described by Acharya et al. (2008). The FPase activity was determined via measuring the reducing sugar from the hydrolysis of filter paper. The crude enzyme (0.5 mL) reacted with 1.0 mL of the citric acid-sodium citrate buffer (0.05 M, pH 4.8) and was incubated at 50 °C for 1 h. The carboxymethyl cellulase (CMCase) activity was determined by measuring the reducing sugar released from carboxymethylcellulose sodium (CMC-Na, Shanpu Inc., Shanghai, China). The crude enzyme (0.5 mL) was reacted with 2 mL of 1% CMC-Na in the citric acid-sodium citrate buffer (0.05 M, pH 4.8) and incubated at 50 °C for 30 min. A unit of enzyme activity was determined as the enzyme that was required to liberate 1 μmol reducing sugar under a pH of 4.8 at 50 °C.
Screening of the combination and proportion of strains for cellulose fermentation
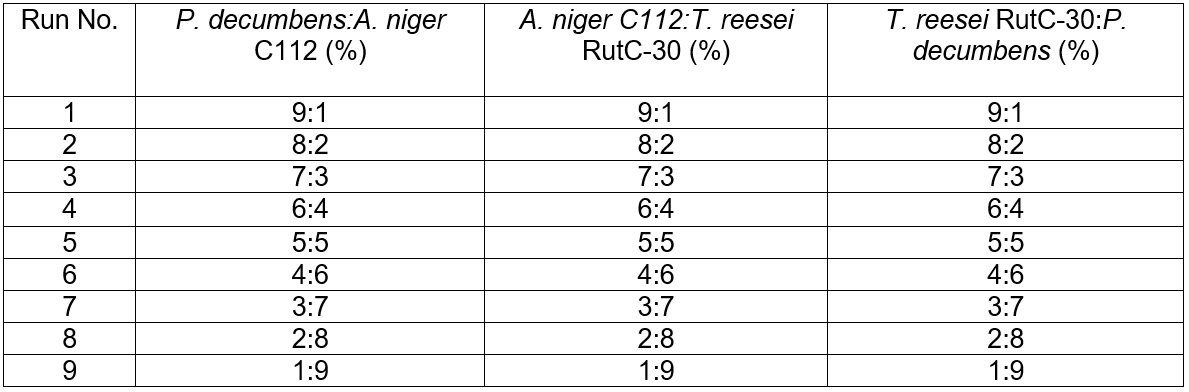
High yield cellulase producing strains are mainly distributed in a few species, such as Trichoderma sp., Aspergillus sp., and Penicillium sp. Several other species of cellulase-producing strains have been reported (Gusakov 2011), but cellulolytic strains capable of high-level cellulase production are uncommon in nature (Wang et al. 2012). The most widely used cellulase in the field of lignocellulose in China are produced by T. reesei RutC-30 and P. decumbens JU-A10 (He et al. 2016). Different combinations and proportions of strains for the synergistic fermentation of camphor leaves cellulose were performed at 28 °C with 180 rpm for 5 d. The design details are shown in Table 1.
Effects of various parameters on reducing sugar concentration
The effects of the starting pH, substrate concentration, temperature, and fermentation time were individually studied on the concentration of reducing sugars while keeping the other values constant.
Table 1. Different Combinations and Proportions of Inoculation
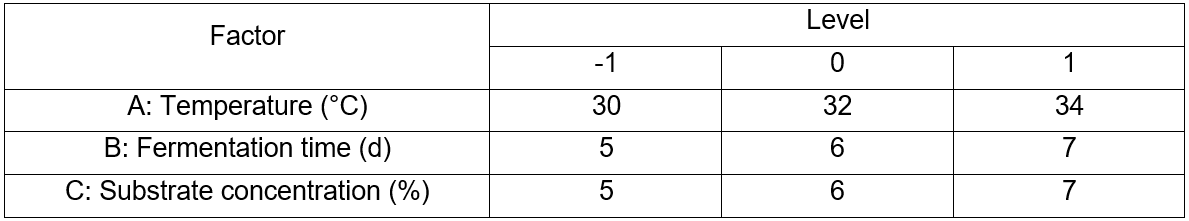
Box-Behnken design
A Box-Behnken design was performed to study the most screened considerable fermentation conditions in a single factor experiment that affect reducing sugar concentrations. The design is presented in Table 2 and includes the factors of temperature (A, °C), fermentation time (B, d), and substrate concentration (C, %). The results between the factors and the response data were performed via fitting to a second-order polynomial equation, Eq. 1,
Y = β0 + β1A + β2B + β3C + β12AB + β13AC + β23BC + β11A2 + β22B2 + β33C2 (1)
where Y is the predicted response, β0 is the intercept term; β1, β2, and β3 are the linear effects; β12, β13, and β23 are the interaction terms; β11, β22, and β33 are the squared effects; and A, B, and C are the independent variables, respectively.
Table 2. Levels of Variables in Box-Behnken Design
RESULTS AND DISCUSSION
Reducing Sugar Concentration and Cellulase Activity by Monoculture
Figure 1 shows the cellulase activity and sugar concentration in cellulose fermentation by a single strain. It can be observed that at the same conditions, the sugar concentration of the fermentation by P. decumbens was 0.476 g/L, which was higher than A. niger C112 (0.330 g/L) and T. reesei RutC-30 (0.369 g/L). In the meantime, the CMCase and FPase activity of P. decumbens was 37.18 U/mL and 8.30 U/mL, respectively, which was more than that of A. niger C112 (15.16 U/mL and 4.88 U/mL) and T. reesei RutC-30 (19.35 U/mL and 3.32 U/mL). However, the maximal CMCase activity of Penicillium waksmanii F10-2 in wheat straw fermentation with peptone was 5.9 U/mL (Han et al. 2009), and the best activity for FPase was 1.2 U/mL in cellulose (1.5% w/v) fermentation with peptone (0.2 w/v) of Penicillium sp. NFCCI 2862 (Saima et al. 2013). It is not strange that the cellulase activity obtained in this study was higher, because camphor leaves have a low content of lignin, such that they are more readily hydrolyzed by cellulase. Different pretreated methods could also have been a reason for the difference of cellulase activity. Therefore, this experiment demonstrated that these cellulolytic fungi could better use the cellulose of camphor leaves for fermentation.
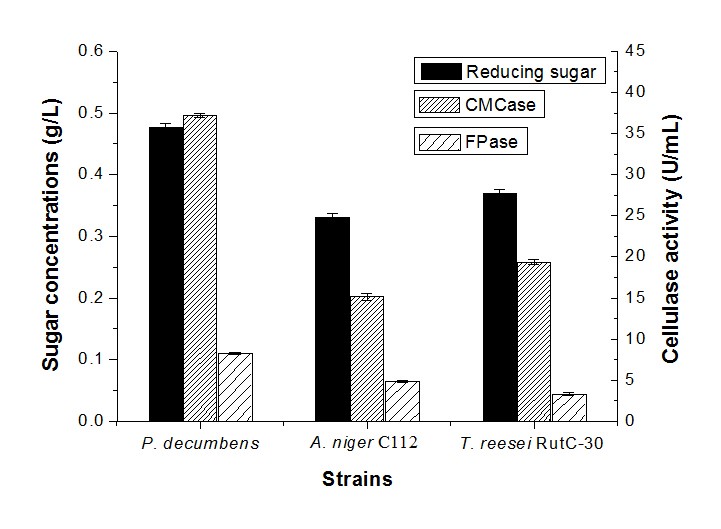
Fig. 1. Reducing sugar concentration and enzyme activity by monoculture
Reducing Sugar Concentration and Cellulase Activity of Synergistic Fermentation
Microbes, such as bacteria and fungus, are a major source of cellulase. Due to the complete enzyme systems and high yield of cellulase, T. reesei has been commonly used in cellulase production (Suurnakki et al. 2000). However, the lower activity of β-glucosidase produced from T. reesei causes the accumulation of cellobiose in the cellulose enzymatic hydrolysis process and leads to decreased hydrolysis efficiency (Manika et al. 2014). To overcome this problem, synergistic fermentation could be used for cellulose fermentation to complement the enzyme systems and increase the capacity of cellulose hydrolysis. Synergistic fermentation of A. niger with T. reesei could compensate for the lack of β-glucosidase of T. reesei to some degree (Muthuvelayudham and Viruthagiri 2007; Fang et al. 2013). The predominant cellulolytic fungi in subtropical and tropical forests of China are Trichoderma and Penicillium (Zhang et al. 2014). The heterologous expression of a β-glucosidase gene from Penicillium decumbens into Trichoderma reesei could enhance the FPase activity by 30%, compared to the parent strain, and increase 80% of the glucose yield during fermentation of pretreated cornstalk (Ma et al. 2011). Additionally, the triculture systems could produce four hydrolytic enzymes of CMCase, FPase, β-glucosidase and xylanase with high efficiency in lignocellulosic biomass degradation (Leo et al. 2016).
Reducing sugar concentration and cellulase activity of synergistic fermentation by P. decumbens and A. niger C112
Results showed that when the proportion of P. decumbens and A. niger C112 was 8:2 and 7:3, the sugar concentration (1.05 g/L and 1.07 g/L, respectively) was higher than other proportions (Fig. 2). The sugar concentration decreased when the proportion of A. niger C112 increased, but the CMCase and FPase activity peaked at a 1:9 proportion to 35.71 U/mL and 12.80 U/mL, respectively. Thus, the high proportion of P. decumbens would be beneficial for the sugar production, and a higher proportion of A. niger C112 would be favorable to cellulase production.
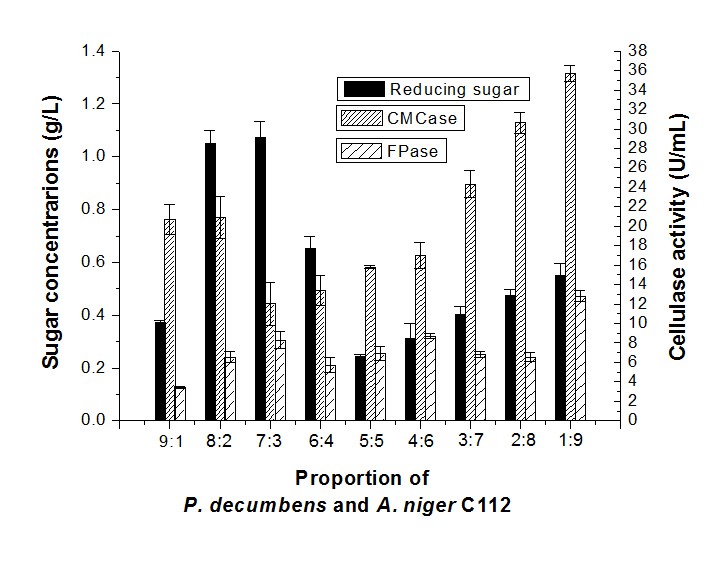
Fig. 2. Reducing sugar concentration and enzyme activity of fermentation in different proportions of P. decumbens and A. niger C112
Reducing sugar concentration and cellulase activity of synergistic fermentation by A. niger C112 and T. reesei RutC-30
The sugar concentration of A. niger C112 and T. reesei RutC-30 with a proportion of 9:1 was 0.60 g/L (Fig. 3).
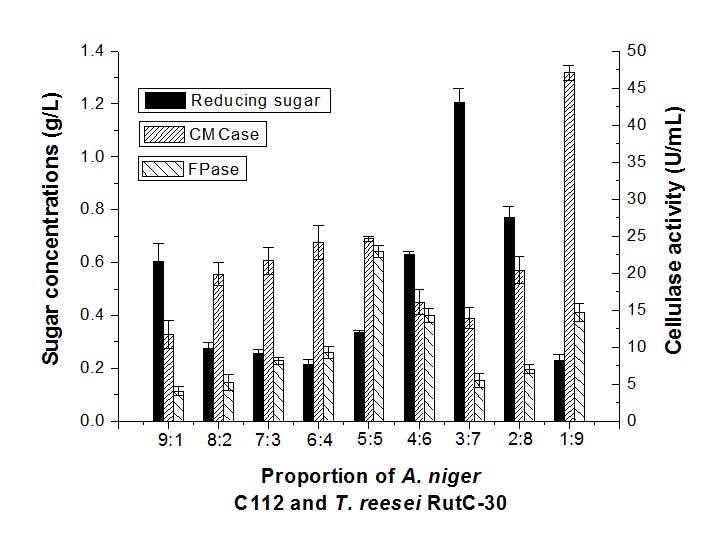
Fig. 3. Reducing sugar concentration and enzyme activity of fermentation in different proportions of A. niger C112 and T. reesei RutC-30
A similar sugar production (0.55 g/L) was obtained through synergistic fermentation by P. decumbens and a high proportion of A. niger C112 (1:9) (Fig. 2), but the CMCase (11.65 U/mL) and FPase (4.06 U/mL) of A. niger C112 and T. reesei RutC-30 with a 9:1 inoculum ratio were considerably lower than the CMCase (35.71 U/mL) and FPase (12.80 U/mL) of P. decumbens and A. niger C112 (1:9). The highest sugar concentration was 1.21 g/L in a proportion of 3:7. This indicated that a lower proportion of T. reesei would inhibit cellulase production, and a higher proportion of T. reesei would be beneficial to reducing sugar production. In addition, the drastic increased activity of CMCase and FPase in a 1:9 inoculum ratio could show that a low proportion of A. niger has a certain complementary effect on the cellulase produced.
Reducing sugar concentration and cellulase activity of synergistic fermentation by T. reesei RutC-30 and P. decumbens
The sugar concentration of the fermentation with T. reesei RutC-30 and P. decumbens in a proportion of 8:2 was higher than other combinations of synergistic fermentation (Fig. 4), but had lower CMCase and FPase activity. The highest sugar concentration was 1.48 g/L, while the CMCase and FPase activity was 17.53 U/mL and 4.78 U/mL, respectively. The sugar concentration decreased and CMCase activity increased while the proportion of P. decumbens was higher. This demonstrated that a low level of P. decumbens had a promoted effect on the T. reesei RutC-30 enzymatic hydrolysis of cellulose that could increase the yield of reducing sugar.
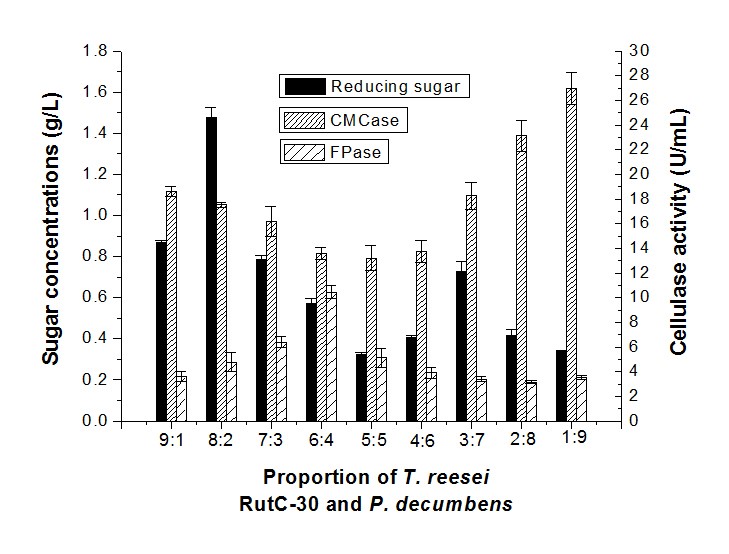
Fig. 4. Reducing sugar concentration and enzyme activity of fermentation in different proportions of T. reesei RutC-30 and P. decumbens
Effect of Substrate Concentration on Reducing Sugar Production
The influence of substrate concentration between 3% and 7% on sugar production by T. reesei RutC-30 and P. decumbens was determined (Fig. 5). The results showed few differences in the sugar concentration when the solid loading increased from 3% to 4%. However, the reducing sugar enhanced from 0.88 g/L to 1.85 g/L when the solid loading ranged from 4% to 6%, and considerably decreased to 1.13 g/L at a 7% substrate concentration. Little variation in sugar concentration was observed when the substrate concentration increased from 15% to 20%, and decreased while the solid loading increased to 30% (Vishwakarma and Banerjee 2016). Proper enzyme and sufficient substrate concentration will promote the product formation, but a high substrate concentration will also inhibit the product. Moreover, enhanced solid loading will reduce the oxygen transfer rate due to the reduction in porosity of the substrate (Gomathi et al. 2012).
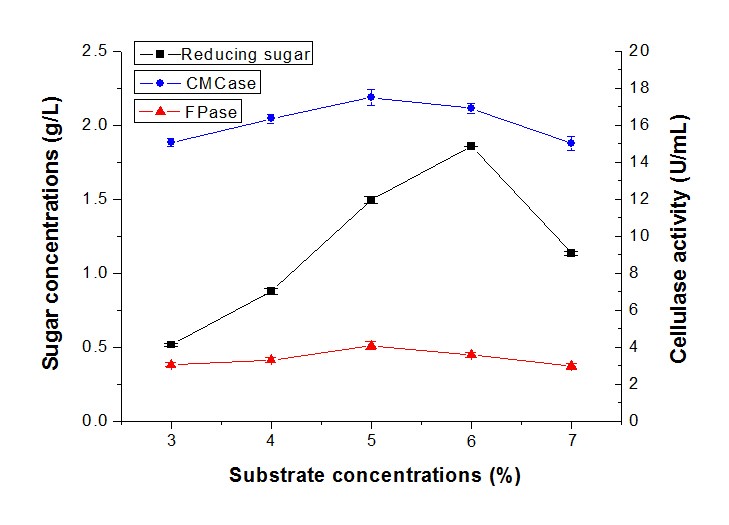
Fig. 5. Reducing sugar concentration and enzyme activity of fermentation in different substrate concentrations
Effect of Initial pH on Reducing Sugar Production
The effects of the initial pH range from 4.5 to 8.5 were measured on sugar production by synergistic fermentation. Figure 6 shows that sugar production was favored in an acidic pH, with the highest level of sugar concentration (2.12 g/L), CMCase (16.95 U/mL), and FPase (3.66 U/mL) at an initial pH of 6.5 (Fig. 6). In contrast, the sugar concentration and cellulase activity decreased sharply at an alkali pH. It was clear that the sugar concentration and cellulase activity remained at a high level in the pH range between 6 and 7. Previous reports showed that the highest level of cellulase activity was obtained by T. asperellum UPM1 at an initial pH of 7.0 (Ibrahim et al. 2013). Conversely, the cellulase activity and protein content produced by Penicillium citrinum MTCC 9620 exhibited a maximum at a pH of 5.5 (Ghoshal et al. 2013).
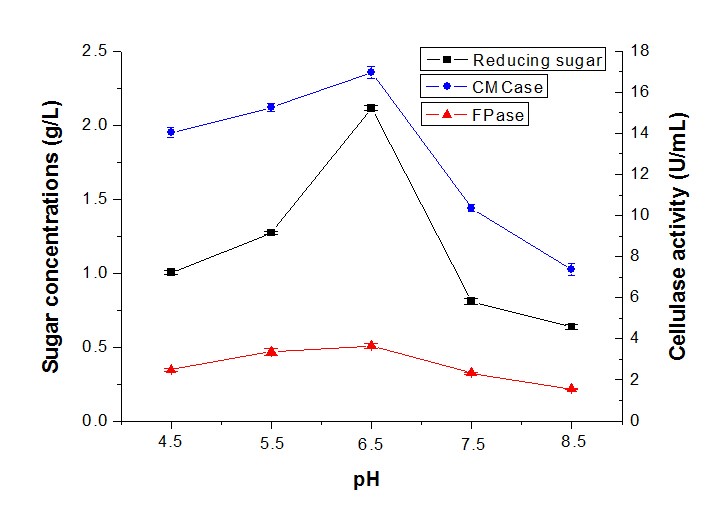
Fig. 6. Reducing sugar concentration and enzyme activity of fermentation in different pH
Effect of Temperature on Reducing Sugar Production
Most fungi are mesophilic strains and susceptible to temperature, but some could grow in thermophilic conditions (Ibrahim et al. 2013). In this study, the cellulase activity and reducing sugar production using alkali-pretreated camphor leaves by T. reesei RutC-30 and P. decumbens, at temperatures ranging from 26 °C to 34 °C, were tested (Fig. 7). The sugar production and cellulase activity increased when the temperature increased and decreased when the temperature was above 32 °C. The highest sugar concentration was 2.54 g/L, with CMCase of 20.11 U/mL and FPase of 3.82 U/mL. As researchers have reported, Trichoderma sp. is a mesophilic fungus that could grow well in the temperature range between 25 °C and 30 °C (Chandra et al. 2010). The T. asperellum UPM1 produced cellulase of β-glucosidase activity peaked at 35 °C with 0.89 U/mL, but the CMCase (20.25 U/mL) and FPase (0.17 U/mL) activity peaked at 45 °C (Ibrahim et al. 2013). Moreover, the protein content and cellulase activity increased from 20 °C to 30 °C, and started decreasing above 30 °C by Penicillium citrinum MTCC 9620 (Ghoshal et al. 2013) could also support this result.
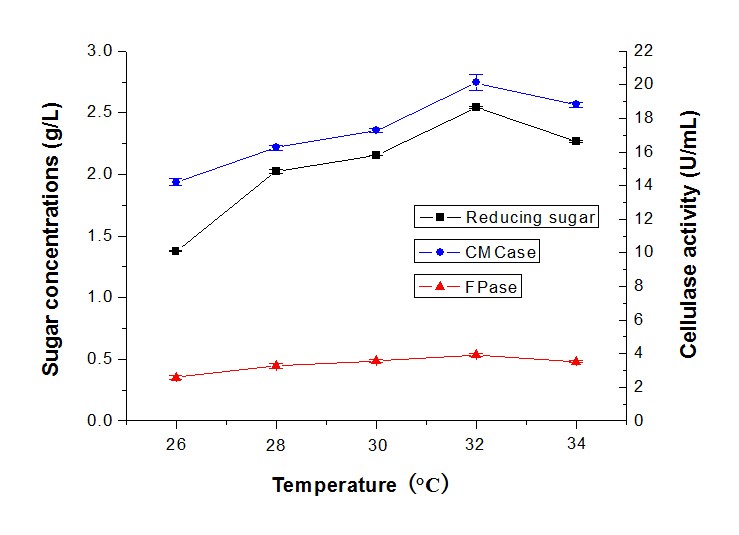
Fig. 7. Reducing sugar concentration and enzyme activity of fermentation in different temperatures
Effect of Fermentation Time on Reducing Sugar Production
Subsequently, the fermentation time was also studied as an important factor in reducing sugar and cellulase production by synergistic fermentation. The highest sugar concentration (2.89 g/L) with CMCase (20.38 U/mL) and FPase (4.34 U/mL) was produced in 6 d by T. reesei RutC-30 and P. decumbens (Fig. 8). However, sugar production decreased considerably at 7 d and 8 d to 2.60 g/L and 2.22 g/L, respectively. The results implied that the cellulase became saturated at 6 d and declined most likely because of the senility of the strains.
Researchers reported that a fall in cellulase activity after 72 h or 96 h could possibly be caused by the strain entering a stationary phase of growth, and depletion of the substrate and by-products produced in the medium (Oberoi et al. 2014). In addition, the enzyme level would decline with prolonged fermentation (Melo et al. 2007), and the accumulation of cellobiose might influence the enzyme activity (Singh et al. 2009).
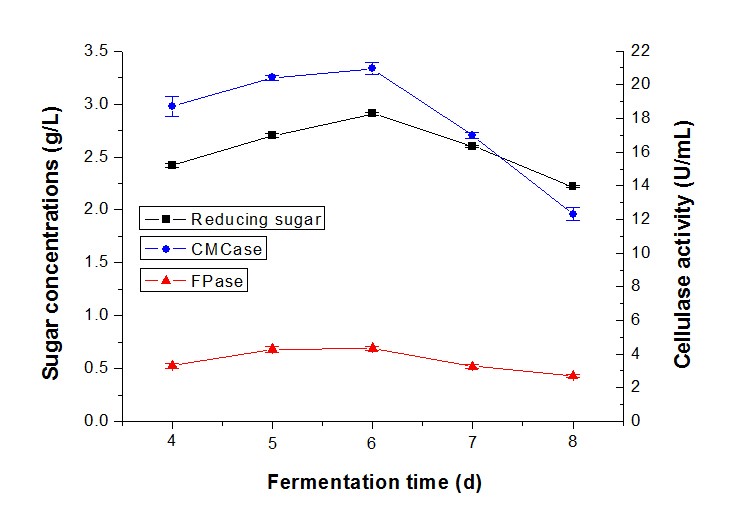
Fig. 8. Reducing sugar concentration and enzyme activity of fermentation in different fermentation durations
Optimization of Fermentation Conditions of Reducing Sugar Production
The results for three factors (temperature, fermentation time, and substrate concentration) are presented in Table 3. The statistical significances of the model in the form of an ANOVA test are given in Table 4. The results in Table 3 show a range from 1.73 g/L to 2.95 g/L sugar concentration that reflected the importance of fermentation conditions for optimization. The highest sugar concentrations (2.95 g/L) were observed at 32 °C, and 6% of the substrate concentration and fermentation time of 6 d (Table 3). The R2 value of 0.9911 and adjusted R2 value of 0.9797 indicated a reasonable agreement between the experimental and predicted values (Table 4). The model F-value of 86.92 implied the model was significant, and the p-values less than 0.0500 indicated that the model terms were significant. The lack of fit F-value of 2.23 implied the lack of fit was not significant relative to the pure error. In this case, the temperature (p < 0.0500) and the substrate concentration (p < 0.0500) were significant model terms. According to the experimental results, the model Eq. 2 of the sugar concentration with temperature, fermentation time, and substrate concentration was obtained as follows,
Y = – 177.13000 + 9.66375 × A + 1.79500 × B + 6.60000 × C
– (1.25000E + 003) × A × B – 0.033750 × A × C + (7.50000E – 003) × B × C
– 0.14719 × A2 – 0.15375 × B2 – 0.46875 × C2
Equation 2 is the model equation of the predicted response and actual variables fitted by the data in Table 3, where Y is the sugar concentration (g/L), A is the temperature (°C), B is the fermentation time (d), and C is the substrate concentration (%).
Based on the independent variables temperature, fermentation time, and substrate concentration, the contour and 3D response surface were obtained in Fig. 9. The interactions between two variables on the reducing sugar production could be observed. Figure 9(a) shows that the changes in temperature had a greater effect on sugar production compared to the fermentation time. The interactive effect between temperature, fermentation time, and substrate concentration exhibited in Fig. 9(b) and (c) indicates that the significance of independent variables on sugar production was: Temperature > Substrate > Fermentation time. According to the selected criteria, the desirability solutions suggested by the Design Expert 8.0 software were 5.93% of the substrate concentration, a temperature of 32.12 °C, and fermentation time of 5.85 d with a maximum reducing sugar production of 2.91 g/L.
Three replicated experiments were performed to verify the validity of the optimized fermentation condition. The mean value of the sugar concentration was 2.96 g/L under the optimized fermentation condition. The similarity of the experimental value with the model predicted value validated that the model was effective and accurate for predicting the production of reducing sugar via synergistic fermentation.
Table 3. Results of the Response Surface Test
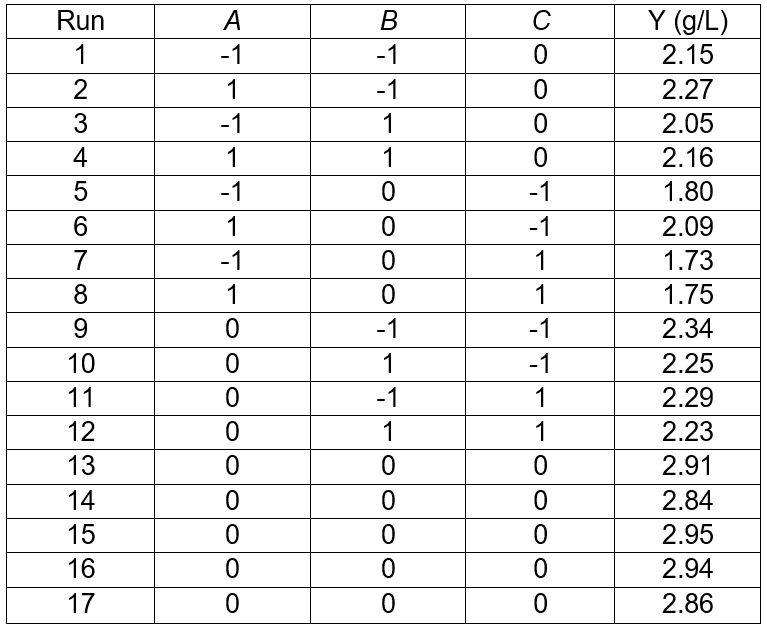
Table 4. ANOVA for Response Surface Quadratic Model of Sugar Concentration
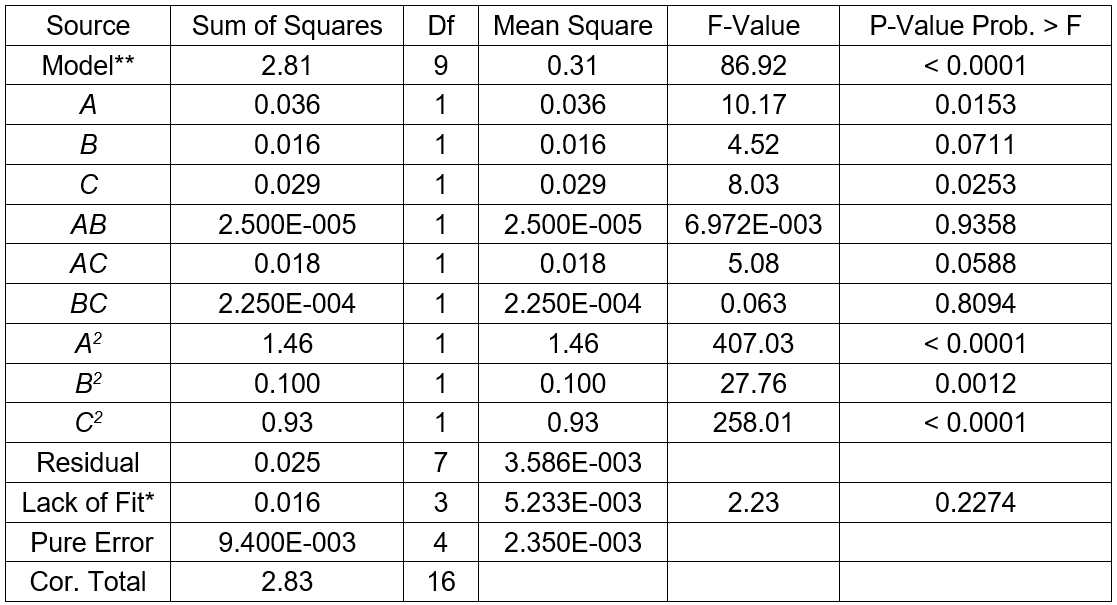
*Note: **Significant, * Not significant; R2 = 0.9911, Adj R2 = 0.9797, Pred R2 = 0.9061
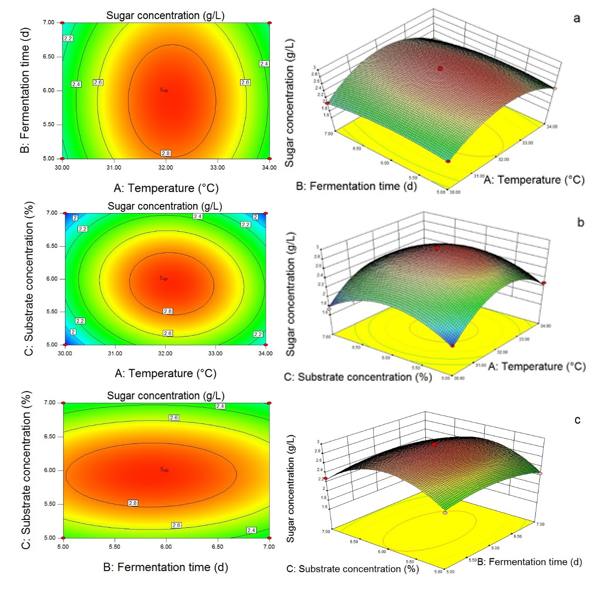
Fig. 9. Response surface showing the interaction between temperature and fermentation time (a), the interaction between temperature and substrate concentration (b), and the interaction between fermentation time and substrate concentration (c), and the effects of variables on the reducing sugar production
CONCLUSIONS
- To obtain high-concentration fermentable sugars, the combination and proportion of strains were screened from decumbens, A. niger C112, and T. reesei RutC-30. The highest sugar concentration of 1.48 g/L was obtained at an 8:2 inoculum of T. reesei RutC-30 and P. decumbens, demonstrating that this co-culture consortia had great synergism in reducing sugar production.
- An experiment of the effects with various parameters on the reducing sugar concentration was conducted. The most suitable levels of variables were a substrate concentration of 6%, temperature of 32 °C, initial pH of 6.5, rotation speed of 180 rpm, and fermentation time of 6 d.
- To further improve reducing sugar production, the Box-Behnken design was used for optimizing the conditions of synergistic fermentation by T. reesei RutC-30 and decumbens. The design suggested that the most significant factors were a substrate concentration of 5.93%, temperature of 32.12 °C, and fermentation time of 5.85 d with a predicted reducing sugar production of 2.91 g/L, and an actual sugar concentration of 2.96 g/L through validation. This indicated that the optimization of parameters have potential for further study of bioconversion of reducing sugar to bioethanol.
ACKNOWLEDGMENTS
This work was funded by the International Science and Technology Cooperation Program of China (No. 2015DFA01120), the National Forestry Science and Technology Extension Project (No. [2016]50), and the Hunan Science and Technology Plan Project (No. 2016NK2149).
REFERENCES CITED
Acharya, P. B., Acharya, D. K., and Modi, H. A. (2008). “Optimization for cellulase production by Aspergillus niger using saw dust as substrate,” African Journal of Biotechnology 7(22), 4147-4152.
Chandra, M., Kalra, A., Sharma, P. K., Kumar, H., and Sangwan, R. S. (2010). “Optimization of cellulase production by Trichoderma citrinoviride on marc of Artemisia annua and its application for bioconversion process,” Biomass and Bioenergy 34(5), 805-811. DOI: 10.1016/j.biombioe.2010.01.024
Chen, H. Z., and Li, Z. H. (2002). “Lignocellulosical microorganisms and biomass total utilization,” Biotechnology Bulletin 2(34), 25-29. DOI: 10.13560/j.cnki.biotech.bull.1985.2002.02.006
Fang, H., Zhao, C., Song, X. Y., Chen, M., Chang, Z., and Chu, J. (2013). “Enhanced cellulolytic enzyme production by the synergism between Trichoderma reesei RUT-C30 and Aspergillus niger NL02 and by the addition of surfactants,” Biotechnology and Bioprocess Engineering 18(2), 390-398. DOI: 10.1007/s12257-012-0562-8
Fang, X., Qin, Y. Q., Li, X. Z., Wang, L. S., Wang, T. H., Zhu, M. T., and Qu, Y. B. (2010). “Progress on cellulase and enzymatic hydrolysis of lignocellulosic biomass,” Chinese Journal of Biotechnology 26(7), 864-869. DOI: 10.13345/j.cjb.2010.07.021
Cherubini, F. (2010). “The biorefinery concept: Using biomass instead of oil for producing energy and chemicals,” Energy Conversion and Management 51(7), 1412-1421. DOI: 10.1016/j.enconman.2010.01.015
Gao, X. X., Pan, L. J., Yang, P. Z., and Wang, X. Y. (2012). “Optimization of cellulase production by mixed fermentation with Trichoderma reesei and Aspergillus niger,” Food Science China 33(19), 193-198. DOI: 1002-6630(2012)19-0193-06
Ghoshal, G., Banerjee, U. C., and Shivhare, U. S. (2013). “Optimization of cellulase (E.C. 3.2.1: 4) production using Penicillium citrinum MTCC 9620 in solid-state fermentation,” British Biotechnology Journal 3(4), 509-523. DOI: 10.9734/BBJ/2013/4135
Gomathi, D., Muthulakshmi, C., Guru Kumar, D., Ravikumar, G., Kalaiselvi, M., and Uma, C. (2012). “Submerged fermentation of wheat bran by Aspergillus flavus for production and characterization of carboxy methyl cellulase,” Asian Pacific Journal of Tropical Biomedicine 2(1), 67-73. DOI: 10.1016/S2221-1691(12)60132-4
Gusakov, A. V. (2011). “Alternatives to Trichoderma reesei in biofuel production,” Trends in Biotechnology 29(9), 419-425. DOI: 10.1016/j.tibtech.2011.04.004
Han, L., Feng, J., Zhu, C., and Zhang, X. (2009). “Optimizing cellulase production of Penicillium waksmanii F10-2 with response surface methodology,” African Journal of Biotechnology 8(16), 3879-3886.
He, M. C., Xu, J. L., Chen, X. Y., Kong, X. Y., Yuan, Z. H., Zhang, Y., Yu, Q., Liu, Y. Y., and Wang, W. (2016). “Progress of cellulase that using for biomass hydrolysis process,” Transactions of the Chinese Society of Agricultural Engineering 32(1), 290-296. DOI: 10.11975/j.issn.1002-6819.2016.z1.040
Ibrahim, M. F., Razak, M. N. A, Phang, L. Y., Hassan, M. A., and Abd-Aziz, S. (2013). “Crude cellulase from oil palm empty fruit bunch by Trichoderma asperellum UPM1 and Aspergillus fumigatus UPM2 for fermentable sugars production,” Applied Biochemistry and Biotechnology 170(6), 1320-1335. DOI: 10.1007/s12010-013-0275-2
Leo, V. V., Passari, A. K., Joshi, J. B., Mishra, V. K., Uthandi, S., Ramesh, N., Gupta V. K., Saikia, R., Sonawane, V. C., and Singh, B. P. (2016). “A novel triculture system (CC3) for simultaneous enzyme production and hydrolysis of common grasses through submerged fermentation,” Frontiers in Microbiology 7, 447. DOI: 10.3389/fmicb.2016.00447
Ma, L., Zhang, J., Zou, G., Wang, C. S., and Zhou, Z. H. (2011). “Improvement of cellulase activity in Trichoderma reesei by heterologous expression of a beta-glucosidase gene from Penicillium decumbens,” Enzyme and Microbial Technology 49, 366-371. DOI: 10.1016/j.enzmictec.2011.06.013
Manika, S., Saju, S. S., Subhash, C., Mukesh, S., and Prabita, S. (2014). “Comparative evaluation of cellulase activity in Trichoderma harzianum and Trichoderma reesei,” African Journal of Microbiology Research 8(19), 1939-1947. DOI: 10.5897/AJMR2013.6488
Melo, I. R., Pimentel, M. F., Lopes, C. E., and Calazan, G. M. T. (2007). “Application of fractional factorial design to levan production by Zymomonas mobilis,” Brazilian Journal of Microbiology 38(1), 45-51. DOI: 10.1590/S1517-83822007000100010
Muthuvelayudham, R., and Viruthagiri, T. (2007). “Optimization and modeling of cellulase protein from Trichoderma reesei Rut C30 using mixed substrate,” African Journal of Biotechnology 6(1), 41-46.
Oberoi, H. S., Rawat, R., and Chadha, B. S. (2014). “Response surface optimization for enhanced production of cellulases with improved functional characteristics by newly isolated Aspergillus niger HN-2,” Antoine van Leeuwenhoek 105(1), 119-134. DOI: 10.1007/s10482-013-0060-9
Saima, S., Syed, R. U. H, and Sarojini, J. (2013). “A novel cellulase from an endophyte, Penicillium sp. NFCCI 2862,” American Journal of Microbiological Research 1(4), 84-91. DOI: 10.12691/ajmr-1-4-4
Singh, A., Singh, N., and Bishnoi, N. R. (2009). “Production of cellulases by Aspergillus heteromorphus from wheat straw under submerged fermentation,” International Journal of Civil and Environmental Engineering 1(1), 23-26.
Suurnakki, A., Tenkanen, M., Siika-aho, M., Niku-Paavola, M. L., Viikari, L., and Buchert, J. (2000). “Trichoderma reesei cellulases and their core domains in the hydrolysis and modification of chemical pulp,” Cellulose 7(2), 189-209. DOI: 10.1023/A:1009280109519
Tang, J., Wang, H. Y., and Xu, Y. (2012). “Effect of mixed culture of Saccharomyces cerevisiae and Pichia anomala on fermentation efficiency and flavor compounds in Chinese Liquor,” OALib Journal 39(7), 921-930. DOI: 10.13344/j.microbiol.china.2012.07.003
Vishwakarma, R., and Banerjee, R. (2016). “Enhancement of sugar content of Cyperus sp. through cellulolytic enzymes for bioethanol generation,” Lignocellulose 5(2), 94-105.
Wang, M. Y., Li, Z. H., Fang, X., Wang, L. S., and Qu, Y. B. (2012). “Cellulolytic enzyme production and enzymatic hydrolysis for second-generation bioethanol production,” Advances in Biochemical Engineering Biotechnology 131(128), 1-24. DOI: 10.1007/10_2011_131.
Wen, Z. Y., Liao, W., Chen, S. L. (2005). “Production of cellulase/β-glucosidase by the mixed fungi culture Trichoderma reesei and Aspergillus phoenicis on dairy manure,” Process Biochemistry 40(9), 3087-3094. DOI: 10.1016/j.procbio.2005.03.044
Zeng, B. Q., Fen, J. R., Zhu, Y. R., and Tian, X. (2015). “Optimization of liquid fermentation conditions for cellulose of camphor tree leaf,” Chinese Journal of Environmental Engineering 9(7), 3461-3467. DOI: 1673-9108 (2015) 07-3461-07
Zhang, Z., Liu, J. L., Lan, J. Y., Duan, C. J., Ma, Q. S., and Feng, J. X. (2014). “Predominance of Trichoderma and Penicillium in cellulolytic aerobic filamentous fungi from subtropical and tropical forests in China, and their use in finding highly efficient β-glucosidase,” Biotechnology for Biofuels 7(107), 1-14 DOI: 10.1186/1754-6834-7-107
Article submitted: December 13, 2016; Peer review completed: March 26, 2017; Revised version received and accepted: April 8, 2017; Published: April 25, 2017.
DOI: 10.15376/biores.12.2.4214-4228