
Abstract
Wooden foams have been extensively researched in recent years because of their special structure and green features. At the same time, noise pollution is increasing, prompting sound insulation to become another research focus. In this study, a three-factor, five-level orthogonal experiment was designed, and 25 sets of specimens were produced for testing and analysis in 19 frequency bands. To measure the sound insulation, two criteria were used: the material sound loss rate (for determining mass) and the material sound loss rate (for determining volume sound). After measuring, these two values were compared. It was found that the material was highly isolated from high frequency noise. The amount of adhesive used and the choice of mould had a considerable effect on the sound insulation of the specimens as the foaming rate was varied. Good sound insulation can be achieved when the foaming rate is very low and when the foaming rate is very high.
Download PDF
Full Article
The Influence of Rosin, Blowing Agent, and Mould Type on the Sound Insulation of Paper-based Foams
Haoyuan Li,^ Lin Luo,^ Jiantong Qiao, Xinyu Li, Jiahe Tu, Qingchun Wang, and Zhongjia Chen *
Wooden foams have been extensively researched in recent years because of their special structure and green features. At the same time, noise pollution is increasing, prompting sound insulation to become another research focus. In this study, a three-factor, five-level orthogonal experiment was designed, and 25 sets of specimens were produced for testing and analysis in 19 frequency bands. To measure the sound insulation, two criteria were used: the material sound loss rate (for determining mass) and the material sound loss rate (for determining volume sound). After measuring, these two values were compared. It was found that the material was highly isolated from high frequency noise. The amount of adhesive used and the choice of mould had a considerable effect on the sound insulation of the specimens as the foaming rate was varied. Good sound insulation can be achieved when the foaming rate is very low and when the foaming rate is very high.
DOI: 10.15376/biores.18.1.337-356
Keywords: Format; Paper-based foams; Sound insulation properties; Orthogonal experiments
Contact information: School of Technology, Beijing Forestry University, 35 Qinghua East Road, Haidian District, Beijing 100083 China; ^ = Co-first authors;
* Corresponding author: chenzhongjia@bjfu.edu.cn
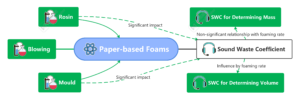
GRAPHICAL ABSTRACT
INTRODUCTION
Noise is a class of sound that either causes annoyance or the volume is too strong and is harmful to human health (Cong 2008). Noise pollution has been listed as one of the four major pollutions, along with air pollution, water pollution, and solid waste pollution (Li 2011). Therefore, the control of noise pollution has become one of the important elements of environmental protection (Calixto et al. 2003; Krozer et al. 2003). At present, noise control by controlling the transmission path is the most common method, including sound insulation and sound absorption. This means either: (1) the use of sound insulation materials and sound insulation structures made of sound insulation devices to isolate noise from other environments to achieve the purpose of noise prevention and control; or (2) the use of sound-absorbing materials and sound-absorbing structures to improve the sound absorption coefficient of a material, thereby reducing the reverberant noise caused by reflection, to achieve the purpose of noise control (Zhang 1988).
In the application of noise control, the most commonly used materials are primarily sound-absorbing materials and sound insulation materials. Although the existing sound-absorbing materials can be applied in different fields, there are still various disadvantages, e.g., poor adaptability to the environment and a tendency to be easily broken, thus forming dust dispersion and pollution of the environment, affecting health, etc., or if the particles are are large, there can be multiple inconveniences to the construction and installation (Wang 2012). According to recent research, the three major industries of chemical raw materials and chemical products manufacturing, power and heat production and supply, and rubber and plastic products are the main industrial emission sources of air pollution in the region considered (Li 2022) At present, industrial rubber and polyurethane are widely used as sound insulation materials. Although many environmental protection measures have been taken in the production and degradation of polyurethane, the environmental pollution caused by the production of raw materials cannot be ignored. Eco-friendly and sustainable development are important requirements for acoustic and sound insulation materials in the new century. With the increasing awareness of environmental protection, the research and development of sound insulation and noise reduction materials made of plant fibers has been a focus of research (Xu and Park 2008).
In recent years, a new environmentally friendly plant fiber foaming material has become a hot research topic. The material is made from plant fibers (waste paper or agricultural waste plant fibers) together with starch and other additives by increasing the temperature of the material or increasing its pressure (Luo et al. 2016). The preparation methods and applications of the plant fiber foaming materials have attracted the attention of many researchers, because of their special structures. There are numerous studies on the formulation of plant fiber foaming materials at home and abroad, but the fiber raw materials used vary. Because of the different agricultural base, Europe and the United States and other countries generally use soybean fiber (Gu et al. 2013), coconut peel fiber (Kaisone et al. 2016), and other raw materials. However, due to the abundance of fiber crops in China, the types of plant materials commonly used are also more extensive, such as corn straw fiber (nampit et al. 2016), bamboo fiber (Gao 2016), and straw fiber (Zhou and Liu 2009).
Research on plant fiber foamed cushioning materials at home and abroad primarily has focused on the production process and technical parameters, raw material modification and formulation, cushioning performance, and service life of the materials (Zhou and Liu 2009). However, there have been few studies on the sound insulation performance of plant fiber foamed materials. Lou and Fu (2017) studied the effect of the arrangement and mass fraction of bamboo raw fibers and surface treatment with a sodium hydroxide solution on the sound insulation performance of composite materials. Jiang (2011) designed and developed fibrous bamboo fiber/fly ash reinforced composites for sound insulation walls and obtained sound insulation materials with excellent performance. Wang (2014) compared the similarities and differences between the effects of carbon fiber and bamboo raw fibers in the foaming process of polypropylene (PP) plastics. They concluded that the higher the binding force, the higher the regularity of the bubble pores from the standpoint of the binding field theory.
The development of various new foaming materials and experiments on their sound insulation performance have also emerged in recent years. Yang (2011) prepared honeycomb fabric/polyvinyl chloride (PVC) sound insulation composites to explore the effect of honeycomb organization on the sound insulation performance of the composites. Wang et al. (2019) prepared two polyurethane (PUR)/polymethyl methacrylate (PMMA)/ expanded graphite foamed composites with PMMA micro-particle content and studied their sound insulation properties, mechanical properties, thermal insulation properties, and flame retardant properties. Zhang et al. (2022) tested the bubble structure and acoustic and sound insulation properties of polyurethane foam via scanning electron microscopy (SEM) and noise vibration test system and determined a ratio for the preparation of polyurethane foam. Polyurethane/lead wool composites were made by Higgs and Eriksson (1971). Polyurethane was applied as an anechoic tile on a submarine, with good results (Zhou 2004).
In the present work, a plant fiber foaming material with acoustic and sound insulation properties was prepared by pretreating waste paper with a sodium hydroxide solution and adding a compound foaming agent. A three-variable, five-level orthogonal experiment was designed to study the effects of different amounts of binder, compound foaming agent, and the molding mold on the sound insulation properties of the foaming material. The reason why the mold was designed as an independent variable is that the authors have made relevant findings in previous experiments. When the raw materials with the same reagent ratio are molded in molds with different bottom areas (samples with different aspect ratios), the foaming effect will change significantly. Therefore, beakers with different bottom areas were selected as molds, and a range of independent variables were added. In addition, the sound insulation performance of the material in response to different frequencies of sound waves was also studied. The new sound insulation material has certain advantages, i.e., environmental friendliness and biodegradable waste, compared with other types of sound insulation materials, as well as a lower production cost, easy access to raw materials, and a simpler process. As such, it is feasible to prepare this new waste paper foaming material.
In order to present the data in a clear and concise manner, the relevant statistics were set up for this study. The following table (Table 1) corresponds to the abbreviations used.
Table 1. Variable List

EXPERIMENTAL
Foamed Material Preparation
Raw material selection and pretreatment
In order to reduce experimental errors due to inconsistencies in the raw materials, a standardized 80 g A4 paper was selected as the raw material for the foaming material. The paper was shredded, soaked for 24 h, and then placed in a pulper for rapid cutting.
The pulp was pretreated in order to obtain a stretchy and tough fiber. The pulp was filtered and squeezed, leaving the fibers to bear the weight. At a fiber moisture content of 80%, a sufficient amount of 7.5% sodium hydroxide was prepared and the pulp was immersed in it. The temperature was kept at 60 °C for 30 min with continuous stirring. The fiber was then washed, and its pH was repeatedly measured until it was neutral.
The fibers were squeezed to a water content of 80% and kept as a reserve. This moisture content is difficult to achieve for paper fiber extrusion. In the actual experiment, the excess water was recorded and the corresponding amount of water can be subtracted when subsequently adding water.

Fig. 1. Digital thermostatic magnetic stirring set
Reagent selection and variable selection determination
To determine the reagents used, this study compared the selection and ratio of the blowing agent and binder of previous foaming materials. Considering the unique physicochemical index of paper fiber, it was decided to use corn starch, polyvinyl alcohol (PVOH), and rosin (C19H29COOH) as adhesive and sodium bicarbonate, azodicarbonamide (AC blowing agent), and potassium hydrogen tartrate as the compound blowing agents, promyelination as the plasticizer, and citric acid as the nucleating agent. Among them, the ratio of sodium bicarbonate, azodicarbonamide (AC blowing agent), and potassium hydrogen tartrate was 3 to 3 to 4, respectively. In addition, citric acid was chosen as a nucleating agent.
In practice, even with the same material and reagent ratios, the use of beakers with different aspect ratios had a considerable effect on the material forming and foaming rates. Previously, abundant studies on the effects of the molding molds on the physicochemical index of the materials have been conducted in the fields of metal smelting and plastic chemicals, but no relevant studies have been found for foaming materials, especially in the field of biomass foaming materials. Therefore, the molding molds are considered as variables in this study.
In the process of material molding, there is a mutually constraining relationship between expansion and bonding. It is expressed macroscopically as the ratio of the blowing agent to the binder. Therefore, in order to determine their effect between on the foaming state and microporous structure, the above two factors were also considered as independent variables in this study.
For multivariate studies, orthogonal experiments are a good research method. It can improve the experimental efficiency and ensure the accuracy. Therefore, the orthogonal experimental method was used for the experimental design of this study.
In summary, this study takes the foaming material as the research object, the amount of foaming agent, the amount of adhesive, and the molding mold as the independent variables, and the material sound insulation effect as the dependent variable. From this, an orthogonal experiment with three variables and five levels was designed, and its specific combinations are listed in Table 2.
The total volume of each group of materials before processing was basically the same because the total amount of pulp in each group was the same and the amount of water used was the same. In addition, the beaker bottom area was different, so the material forming process support force was also different, so as to achieve a change in the variables.
Table 2. Combination of the Independent Variables for Foaming Materials

Operation procedure and molding process
According to the above orthogonal experiment table, the corresponding reagent proportioning and beaker type were selected. Since an electronic balance is more precise and its range is limited, only 100 mL beakers can be used for reagent blending. Since the original reagents are either a dry powder or granules, except for propanetriol, they do not react with other reagents at room temperature. Therefore, all reagents were added directly to the same 100 mL beaker to simplify the operation process and reduce wall hanging losses. A certain mass of pure water was weighed with an electronic balance of another range and set aside.
After the reagents were weighed, the water was added to the small beaker in turn, dissolving or flushing all reagents into the corresponding molding beaker as much as possible. After that, the fibers were put in, stirred, and thoroughly shaken to ensure that they were homogeneous and without obvious pores inside. The presence of pores can cause rapid local growth and affect the overall uniformity of the foaming, and in severe cases may cause fracturing. Afterwards, the height was measured and recorded.
The prepared materials were put into the microwave oven, 80% heating power was selected, turned on for 14 min, and then dried for a certain time. Then, the material was taken out of the mold and its height was measured and recorded.
The whole process outlined above is the material preparation process. The following 25 (Fig. 2) sets of specimens were made by the above process.

Test Standards
There are many ways to control noise. When it is difficult to control the sound source, it is a common method to block and absorb the sound in the process of propagation. Since sound waves propagate in the air, the sound energy in the propagation path is blocked and cannot directly pass through; this process is known as sound insulation. In actual daily life, the sound propagation paths, as well as the propagation process, are complex and diverse. To ensure the experimental effect, a scheme must block the propagation of sound in the unwanted paths of this experiment to make the experimental results more accurate.
Sound insulation experiment principle
According to GB/T standard 20247 (2006), combined with the trial material of this project and the relevant conditions of the field test, the authors give the following test program (Fig. 3).

Fig. 3. Experimental space sound transmission
Methods
Environment construction
According to the different propagation paths of the sound waves in the schematic diagram above, the sound insulation problem can be divided into two categories: one is the isolation of air sound, and the other is the isolation of solid sound. The material area of the test pilot was small, with a thickness of approximately 40 mm to 50 mm. Therefore, the authors built a miniature reverberation laboratory to compensate for the error of the conventional reverberation chamber for experiments with smaller volume materials.
A space 200 mm in length, 300 mm in width, and 200 mm in height was created by 3D printing, and a sandwich was set in the middle of the long side. A hole with a diameter of 6 mm was cut in the middle of the sandwich. This hole was used to place the test specimen. In the interlayer and in the partitioned space, a certain thickness of sound insulation cotton was arranged to prevent sound transmission. The actual implementation of the device is shown in Fig. 4.

Fig. 4. Material location description
Airborne sound insulation refers to the blocking effect of air on sound waves before they reach the sound insulation member in the sound insulation test. In the actual test, the air sound insulation volume needs to be tested in a standard environment before conducting the sound insulation performance test of the sample. Therefore, the environment for the sound insulation test needs to be dry as well as comfortable, and the air sound insulation volume needs to be stable in order to make an accurate evaluation of the sound insulation performance of the sound insulation components. After the experimental environment was built, advanced blanking experiments were conducted to correct various errors of this test equipment (including the air sound insulation amount), and data correction was performed in later experiments to obtain more realistic data.
The structure of the reverberation chamber and the equipment and instruments are shown in Fig. 5. When testing the amount of sound insulation of the material, the cross-sectional area of the specimen is a circle with a diameter of 20 mm (equivalent to the connected area between the sound source room and the sound receiving room) and the specimen was fixed in the area between the sound source room and the sound receiving room. The sound insulation is measured by emitting a sound wave of a fixed frequency from a sound source generator, the sound level of which can be measured. The sound waves pass through the test specimen, the energy is attenuated, and the receiver in the receiving chamber receives the remaining sound energy after the specimen has been blocked. The whole process of transmission and attenuation of sound waves is known as the process of testing the amount of sound insulation in a reverberation chamber.
Sound insulation experimental process
Due to the different molding molds for the material preparation process, the cavity area in this experimental process should be slightly smaller than the minimum cross-sectional area in all the specimens. All specimens were cut into cylinders 6 cm in diameter and 4 cm in height for use.

Fig. 5. Overhead view of the experimental environment
Sound insulation experiments usually require testing the sound insulation effect of the materials using different frequency sound sources (Wang et al. 2019). In this study, 100 Hz, 125 Hz, 160 Hz, 200 Hz, 250 Hz, 315 Hz, 400 Hz, 500 Hz, 630 Hz, 800 Hz, 1000 Hz, 1250 Hz, 1600 Hz, 2000 Hz, 2500 Hz, 3150 Hz, 4000 Hz, 5000 Hz, and 6300 Hz frequencies were used. In addition, 19 frequency bands of sine waves were tested. Before the test, a blank control group experiment was conducted first.
The sound source was placed into the sound source chamber with no test material filling in the middle sound insulation layer. The transducer of the sound level meter was facing the center of the test material hole and was located at the geometric center point of the sound receiving chamber. The average sound pressure level LEQ block was used for acquisition and calculation. This block uses the widely used Class A sound level measurement standard, which allows for the rapid measurement of decibel values within the environment using integral averaging and has a filtering effect on the interference.

Fig. 6. Sound level meter description
After conducting three groups of blank experiments for raw sound level determination in each frequency band, the specimens were stuffed into the test holes sequentially, according to the group number, and the box lid was fastened, tested, and recorded.
RESULTS AND DISCUSSION
Definition and Calculation of Metrics
The experimental results were first preprocessed to determine their relevance. In this study, the sound transmission loss coefficient (SWC) was used to measure the sound insulation performance of the material, which was calculated according to Eq. 1,
SWC=(Si-So)/Si (1)
where ‘Si’ indicates the average value of the blank test for each frequency, i.e., ‘So’ incident sound intensity (dB); and ‘SWC’ indicates the transmission value for each frequency under the effect of material on sound obstruction, i.e., outgoing sound intensity (dB). In the actual test process, when the system was closed, the original internal noise did not exceed 5 dB in the student source and the receiving room, so we ignored it. The numerical results of the test are shown in Fig. 7.
According to Yang (2011), the method of using the average SWC value at each frequency as the degree of sound isolation of a material is widely used. In this study, this method was also used, and the average SWC value for each group was obtained as the ASWC (as shown in Fig. 8).

Fig. 7. Sound insulation effect of different frequency sound sources
In this study, the respective variables of the ASWC coefficients and orthogonal experimental designs were analyzed in an attempt to illustrate the primary factors and quantitative expressions affecting the comprehensive sound insulation effect of paper foam materials. In addition, the optimal values of the respective variables were determined in terms of the best sound insulation effect.

Fig. 8. Statistics of ASWC values for each group of specimens
Principal Component Extraction and Analysis
To make the data processing more concise and efficient, it was first necessary to analyze which factors had the greatest influence on the sound insulation effect. In this way, factors with insignificant effects can be eliminated to obtain more accurate experimental results.
The principal component analysis (PCA) is a statistical method. It converts a set of potentially correlated variables into a set of linearly uncorrelated variables through an orthogonal transformation. A statistical test is performed for this variable, and based on the results, it is possible to analyze which factors have the greatest influence on the dependent variable. Taking rosin (R), compound foaming agent (F), and mold diameter (M) as the independent variables and the ASWC coefficient as dependent variable, the principal component analysis results were obtained (Table 3).
According to the statistical test, it is extremely significant when the significance p-value is less than 0.01 and significant when significance 0.01 p-value is greater than but less than 0.05. Therefore, it was found that the R and M variables have a greater influence on the sound insulation performance, and the subsequent quantitative analysis will be carried out with these two variables as the research objects.
Table 3. Inter-Subject Effects Test

Non-linear Regression Analysis and Function Fitting
Based on the data analysis and the related scatter plots, it can be judged that the effects of the two independent variables on the dependent variable cannot be expressed by a simple combination of linear relationships. Therefore, nonlinear regression was considered for the analysis. However, a multiple nonlinear regression analysis is too complicated, and there are too many types of nonlinear regressions, which is not conducive to the simple expression of the model. Therefore, for the time being, a nonlinear fit was considered for each of the two independent variables to perform the regression. Since the Latin square experimental table of the orthogonal experiment makes it unfavorable to express the functional relationship by taking values of the same independent variable corresponding to multiple dependent variable values, the dependent variable values of the same independent variable were averaged. This is not to ignore the influence of the other factors on the dependent variable, but to filter out the influence of the other two independent variables via averaging because of the combination specificity of the orthogonal experiment. For example, when R is the independent variable, the combination of the M and F variables just takes into account the larger and smaller values of each, and the average value of the dependent variable filters out the effects of the different combinations of M and F. This is equivalent to the results of the partial derivative of R in the multivariate composite function. The specific trend is shown in Fig. 9 and Fig. 10.

Fig. 9. The relationship between the model selection and acoustic performance

Fig. 10. The relationship between the amount of adhesive and sound insulation performance
The results of taking the mean value of the ASWC coefficients for the same independent variable values are shown in Table 4.
Table 4. Mean Value of ASWC for Each Variable

The curve fitting toolbox of MATLAB was used to select appropriate models for regression of the above R and M variables. For the regression of the M variable, the 3 times function was preferred, but its R value was less than 0.8, which was not enough to pass the statistical test, so the 4 times function was used for fitting.
The expression is shown in Eq. 2,
 (2)
(2)
The residual sum of squares and the coefficient of determination are shown in Eq. 3 and Eq. 4, respectively,
 (3)
(3)
R2 = 1 (4)
where the smaller the residual sum of squares and the closer the coefficient of determination is to 1, the better the model fit is. The above data met the requirements of statistical tests.
Regressions were performed on the R variables and the results were as follows (as shown in Fig. 12).
The expression is shown in Eq. 5,
 (5)
(5)
The residual sum of squares and the coefficient of determination are shown in Eq. 6 and Eq. 7, respectively,
 (6)
(6)
 (7)
(7)
The above data meet the requirements of statistical tests.
From the above analysis, it can be found that ASWC (M) has extreme values at the following points, as shown in Eq. 8 through Eq. 10,
 (8)
(8)
 (9)
(9)
 (10)
(10)
where is M1 and M3 are the extreme values.
The extreme value of ASWCR(R) in the domain of definition is not the maximum value and increases as the R value increases after the second extreme value point. Therefore, it can only mean that in a limited range (experimental definition domain), the larger R ASWC (R) value is larger.
Relationship Between the Sound Insulation Performance and Foaming Rate
According to sound insulation related research, the pores of the material have a close relationship with the related sound insulation, and the material ratio has a direct influence on the structure, number, size, and distribution of the pores (Yu and He 2010). In order to investigate whether the independent variable affects the sound insulation performance of the material by changing the hole-related factors, this study was fitted with the foaming rate (FR) as the independent variable and the sound insulation index (ASWC) as the dependent variable.
After trying a variety of regression analyses, it was found that only a combination of trigonometric polynomials could yield a better-fitting function image, with the 8-term number trigonometric polynomial fitting the best, as shown in Fig. 12.

Fig. 11. The foam level and sound insulation performance at certain volumes represented by the trigonometric period

Fig. 12. The foam level and sound insulation performance at certain volumes
Obviously, the expression is too complex and not suitable to be expressed as a regression function, thus finding the exact relationship between the foaming rate and the sound insulation index. Therefore, the discrete point plot was smoothed and connected to obtain Fig. 11.
By analyzing the function shape, image, and smoothed curve image, it is obvious that the sound insulation performance shows periodic fluctuations as the foaming rate increases.
In order to better observe the interrelationship between the independent variables, foaming rate, and sound insulation performance, the following 3-dimensional relationship was plotted in this study (Fig. 13).


Fig. 13. The relationship between the degree of foaming and sound insulation performance with the model as a variable
From the above three-dimensional image (Fig. 13), the turn from face to face can be seen more clearly. This indicates that in the process of a change of quantity, the step size of its influence on the two other quantities is discontinuous or inconsistent change. Therefore, it can be determined that there is no obvious correlation or proportional trend between foaming rate and sound insulation performance.
However, according to previous studies by Nampitch et al. (2016) and Gao (2016), there should be a more obvious functional relationship between the degree of foaming and the sound insulation effect. The types of variables were again reviewed, and it was found that the groups of materials had the same volume but different masses. The dependent variable of the sound insulation effect was not considered in the case of homogenization with mass metric. Therefore, additional calculations of the specific mass-averaged sound insulation index (ASWCCM) were performed, as shown in Eq. 11,
 (11)
(11)
where m is the mass of the experimental material in each group, and its value is calculated with the ASWCCM index shown in Table 5.
Table 5. Mass-averaged Sound Insulation Index (ASWCCM)

To reduce possible chance errors in the experimental process and at the same time make the fitting results better, 16 sets of results from 25 sets were screened for regression analysis and better fitting results were obtained as follows.

Fig. 14. The foam level and sound insulation performance at a certain mass
 (12)
(12)
The residual sum of squares and the coefficient of determination are shown in Eq. 13 and Eq. 14, respectively,
 (13)
(13)
 (14)
(14)
The above data meet the requirements of the statistical tests.
From the above analysis, it was found that there are effective extremes at the following points, and the difference between the two function values was not significant, and both are better foaming rates compared to the mass average sound insulation index, as shown in Eq. 15 through Eq. 18,
 (15)
(15)
 (16)
(16)
 (17)
(17)
CONCLUSIONS
- The paper-based foams made in this study have a certain sound insulation capability, and overall, their insulation effect for high frequency noise is better than their insulation effect for low frequency noise, with the best sound transmission loss coefficient effect exceeding 20% in 19 frequency bands of the 25 groups of samples tested.
- From the perspective of the material preparation process factors, the amount of rosin, i.e., adhesive, used and the mold diameter, i.e., the aspect ratio of the material thermoforming, had a significant effect on the overall performance of the material noise isolation. The greater the amount of rosin used in the experimental range, the better the material noise insulation. The mold diameters achieved great values at 88.6mm and 114.8 mm, and the material made from the mold with a diameter of 88.6mm had the best sound insulation under the present experimental conditions.
- There was no significant relationship between the foaming rate and the specific volume average sound insulation index, but there was a more obvious function relationship with the specific mass average sound insulation index. In the experimental range, the best overall sound insulation effect was found for materials with foaming rates of approximately 2% and 24%, and the worst sound insulation effect was found at a value of approximately 14% and 31%. This indicated that the sound insulation performance of the foamed materials was primarily determined by two mechanisms: reflection and absorption. When the foaming rate was low, the material is relatively dense, so the sound does not easily enter the holes and has a higher probability of hitting the fiber layer and rebounding. As the foaming rate increases, the number and volume of holes also gradually increases, so the sound can escape better. In addition, as the foaming rate continues to increase, the holes become gradually denser, making it easy for the sound waves to enter the hole “trap” in the process of propagation. It becomes difficult to escape, and they gradually decay; as such, the energy is absorbed by the material.
ACKNOWLEDGMENTS
The authors would like to acknowledge the financial support of the Student Innovation and Entrepreneurship Program of the Beijing Forestry University. In addition, the authors give thanks to Tang Chen, from the College of Engineering, Beijing Forestry University, for his help with this project.
REFERENCES CITED
Calixto, A., Diniz, F. B., and Zannin, P. H. T. (2003). “The statistical modeling of road traffic noise in an urban setting,” Cities 20(1), 23-29. DOI: 10.1016/S0264-2751(02)00093-8
Cong, Y. (2008). “Experimental discussion on the pollution, impact and treatment technology of noise,” Xinjiang Chemical Industry 1, 25-27.
Gao, Y. (2016). Research on Corn Straw Reinforced Plant Fiber-based Foaming Materials Master’s Thesis, Inner Mongolia Agricultural University, Hohhot, China.
GB/T 20247 (2006). “Acoustics. Measurement of sound absorption in a reverberation room,” Standardization Administration of China, Beijing, China.
Gu, R. J., Sain, M. M., and Konar, S. K. (2013). “A feasibility study of polyurethane composite foam with added hardwood pulp,” Industrial Crops and Products 42, 273-279. DOI: 10.1016/j.indcrop.2012.06.006
Higgs, R. W., and Eriksson, L. J. (1971). “Acoustic attenuation in composite materials,” Journal of the Acoustical Society of America 50, 306-309.
Jiang, K. M. (2011). Study on the Preparation Process of Pile Bamboo Raw Fiber/Fly Ash Reinforced Composites and their Properties, Master’s Thesis, Zhejiang Agriculture and Forestry University, Hangzhou, China.
Kaisone, T., Harnkarnsujarit, N., Leejarkpai, T., and Nampitch, T. (2016). “Mechanical and thermal properties of toughened PLA composite foams with modified coconut fiber,” Applied Mechanics and Materials 851, 179-185. DOI: 10.4028/www.scientific.net/AMM.851.179
Krozer, J., Mass, K., and Kothuis, B. (2003). “Demonstration of environmentally sound -and cost-effective shipping,” Journal of Cleaner Production 11(7), 767-777. DOI: 10.1016/S0959-6526(02)00148-8
Li, K. (2011). Laminated Porous Acoustic and Sound Insulation Composites, Master’s Thesis, Donghua University, Shanghai, China
Li, L. (2022). “Emission analysis and control suggestions of industrial sources of major atmospheric pollutants,” Green Science and Technology 24(6), 91-93. DOI: 10.16663/j.cnki.lskj.2022.06.017
Lou, L., and Fu, Y. (2017). “Sound insulation properties of bamboo raw fiber/urethane composites,” Journal of Textiles 38(1), 73-77. DOI: 10.13475/j.fzxb.20160400805
Luo, Y., Xiao, S., Li, C., and Mu, L. (2016). “Research status and prospect of plant fiber porous cushioning packaging materials,” Packaging Engineering 37(7), 17-22. DOI: 10.19554/j.cnki.1001-3563.2016.07.004
Nampitch, T., Kaisone, T., Hanthanon, P., and Wiphanurat, C. (2016). “Compressive properties of polylactic acid-based nanocomposite foams reinforced with coconut fibers,” Applied Mechanics and Materials 851, 19-25. DOI: 10.4028/www.scientific.net/AMM.851.19
Wang, Z., Rao J., and Guo L. (2019). “PUR/PMMA foamed composites and their indoor sound insulation properties,” Engineering Plastics Applications 47(8), 105-108.
Wang, C. B. (2014). Study on the Foaming Properties of Fiber-modified Polypropylene and the Effect of Binding Field on the Growth of Bubble Pores, Ph.D. Dissertation, Nanjing University of Science and Technology, Nanjing, China.
Wang, L. (2012). “Urban low-frequency noise pollution hazards and thoughts on prevention and control,” Shenzhou 23, 234.
Xu, X., and Park, C. B. (2008). “Effects of the die geometry on the expansion of polystyrene foams blown with carbon dioxide,” Journal of Applied Polymer Science 109(5), 3329-3336. DOI: 10.1002/app.28274
Yang, T. B. (2011). Preparation of Honeycomb Fabric/polyvinyl Chloride Composites and Their Sound Insulation Performance, Master’s Thesis, Zhejiang University of Technology, Hangzhou, China.
Yu, Q., and He, C. (2010). “Preparation and performance of starch/straw fiber cushioning packaging materials,” Journal of Materials Science and Engineering 28(1), 136-139. DOI: 10.14136/j.cnki.issn1673-2812.2010.01.028
Zhang, P. S. (1988). “Noise prevention and control,” Beijing: Electronic Industry Press 1988(1), 72-187.
Zhang, S., Tang, W., Yu, T., Xu, Z., and Xing, J. (2022). “Preparation and properties of polyurethane foam with different content ratios,” China Plastics 36(3), 104-109. DOI: 10.19491/j.issn.1001-9278.2022.03.017
Zhou, C. (2004). “Research progress of polyurethane hydroacoustic materials,” Polyurethane Industry 2004(6), 1-4.
Zhou, S. H., and Liu, Y. (2009). “Static mechanical property modeling of bamboo fiber foam cushioning packaging materials,” Packaging Engineering 30(6), 16-17+23. DOI: 10.19554/j.cnki.1001-3563.2009.06.008
Submitted: May 18, 2022; Peer review completed: September 3, 2022; Revised version received: September 18, 2022; Accepted: September 20, 2022; Published: November 11, 2022.
DOI: 10.15376/biores.18.1.337-356