
Abstract
To evaluate the influence of ultrasound-assisted extraction (UAE) on the physicochemical characteristics of wood, UAE and Soxhlet extraction (SE) were used to treat Eucalyptus. In UAE, ultrasound with a frequency of 40 kHz and an intensity of 360 W was performed at 60 °C for 30 min. Comparison of UAE samples with Soxhlet-extracted and untreated samples indicated that both the extraction and cavitation effects of ultrasound played a significant role in the efficient alteration of wood characteristics. Identification of extractives by gas chromatography-mass spectrometry (GC/MS) suggested the presence of more low- and high-volatility components in UAE, whereas SE mainly consisted of moderate-volatility components. In thermogravimetry (TG) analysis, UAE samples obtained the highest maximum mass-loss rate (-52.1%/min) at the lowest temperature (378.4 °C). Volatile profiles obtained by thermogravimetry-infrared spectroscopy (TG-FTIR) indicated that CO and CH4 increased, whereas CO2 and formic acid decreased during pyrolysis after UAE. The release of CO and methanol components was mainly influenced by extraction; however, the emission of CO2, CH4, and formic acid responded more strongly to the effects of ultrasound. Scanning electron microscopy (SEM) images revealed that the fracture of pit membranes and small protuberances on the surface of the residues reflected the effects of ultrasound.
Download PDF
Full Article
The Study on Physicochemical Characteristics of Wood Treated by Ultrasound-assisted Extraction
Zhenyu Wang *
To evaluate the influence of ultrasound-assisted extraction (UAE) on the physicochemical characteristics of wood, UAE and Soxhlet extraction (SE) were used to treat Eucalyptus. In UAE, ultrasound with a frequency of 40 kHz and an intensity of 360 W was performed at 60 °C for 30 min. Comparison of UAE samples with Soxhlet-extracted and untreated samples indicated that both the extraction and cavitation effects of ultrasound played a significant role in the efficient alteration of wood characteristics. Identification of extractives by gas chromatography-mass spectrometry (GC/MS) suggested the presence of more low- and high-volatility components in UAE, whereas SE mainly consisted of moderate-volatility components. In thermogravimetry (TG) analysis, UAE samples obtained the highest maximum mass-loss rate (-52.1%/min) at the lowest temperature (378.4 °C). Volatile profiles obtained by thermogravimetry-infrared spectroscopy (TG-FTIR) indicated that CO and CH4 increased, whereas CO2 and formic acid decreased during pyrolysis after UAE. The release of CO and methanol components was mainly influenced by extraction; however, the emission of CO2, CH4, and formic acid responded more strongly to the effects of ultrasound. Scanning electron microscopy (SEM) images revealed that the fracture of pit membranes and small protuberances on the surface of the residues reflected the effects of ultrasound.
Keywords: Wood; Ultrasound; Extraction; Physicochemical Characteristics; Pyrolysis
Contact information: Beijing Key Laboratory of Wood Materials and Engineering, College of Materials Science and Technology, Beijing Forestry University, No. 35, Qinghua East Road, Haidian District, 100083, Beijing, P.R. China; *Corresponding author: wangzhenyu1992@126.com
INTRODUCTION
Rapid consumption of fossil fuels and environmental degradation have recently prompted studies on alternative energy. Renewable biomass is one of the most appropriate substitutes because it reduces reliance on fossil fuels and does not add new carbon dioxide to the atmosphere (McKendry 2002). The exploitation and utilization of renewable biomass also result in high value-added products, which contribute to sustainable development. Eucalyptus, a fast-growing species, is widely planted worldwide. Approximately 3.5 million hectares of eucalyptus plantations, which can produce 15 to 30 m3/ha/a, have been established in Southern China (Zhou and Wingfield 2011). Although categorized as renewable biomass, the majority of eucalyptus resources are used for pulp production (Oudia et al. 2009) and furniture making, which produces a large amount of wood residue and generates low profits. Consequently, optimizing the use of eucalyptus resources addresses the energy crisis and increases the value of wood; it also significantly mitigates environmental burden caused by wood waste (Părpăriţă et al. 2014a).
Among the biomass utilization methods, thermochemical technologies, particularly pyrolysis, have drawn increasing interest because of the flexibility and simplicity of conversion (Yanik et al. 2007). Pyrolysis is a fundamental thermochemical conversion that can directly transform biomass into abundant gaseous and liquid products. In addition, pyrolysis is necessary and deserves research attention because it is an essential step in combustion and gasification (White et al. 2011).
To maximize the advantages provided by wood resources, diversified methods have been applied in wood utilization. One of these approaches is ultrasound-assisted extraction (UAE). Ultrasound is used to obtain valuable components and increase the yield of extractives from wood and other biomass materials with short treatment time, mainly attributed to cavitation. Cavitation refers to the formation, growth, and violent collapse of cavities caused by ultrasound in the liquid (Sutkar and Gogate 2012), which can efficiently improve the penetrability of biomass and significantly intensify mass transfer (Toma et al. 1999; Vinatoru 2001). A number of studies have investigated the use of UAE, aiming at producing natural products and chemicals with high utility value in food, cosmetics, medicines, and other consumer goods (Chen et al. 2011; Shirsath et al. 2012). Pappas et al. (2002) used ultrasound-assisted extraction to extract and purify the cellulose from eucalyptus. Li et al. (2004) extracted oil from two varieties of soybeans by using high-intensity ultrasound with a frequency of 20 kHz, improving throughput in commercial oil production. In addition, extraction of anthocyanins from red raspberries by using an ultrasound-assisted technique was conducted by Chen et al. (2007), and the optimized conditions were obtained at a frequency of 22 kHz.
Accordingly, UAE can be used as an appropriate treatment prior to pyrolysis for high-value applications of wood. Although ultrasonic treatment is widely used and has been compared with microwave assisted treatment in articles (Zhang and Liu 2008; Dahmoune et al. 2014), studies focusing on the pyrolytic characteristics of ultrasonically treated biomass are insufficient. Guo et al. (2010) and Wang et al. (2011) conducted studies works in this field; however, such studies merely reflected the extraction effects of ultrasound and did not consider the cavitation effects of ultrasound. Moreover, no studies on the influence of UAE on volatiles released during pyrolysis and the structural changes of pyrolysis residues were reported, which is closely related to the production of valuable and energy substance as well as the pyrolysis mechanism. Thus, this study aims to evaluate the effects exerted by UAE on the physicochemical characteristics of wood, particularly on the release of volatiles and the morphologic characteristics of pyrolysis.
EXPERIMENTAL
Materials
The eucalyptus (Eucalyptus grandis × Eucalyptus urophylla) used for this study was provided by Guangxi Ushine Home Products Limited Company (Guilin, China). Chemicals were purchased from Beijing Chemical Works (Beijing, China). Raw materials were ground in a grinder (type XTP-1000A, Zhejiang Red Sun Machinery Co., Ltd., Jinhua, China) and sieved to a particle size below 0.45 mm. Samples of three different treatment conditions were analyzed: (1) untreated biomass, (2) Soxhlet-extracted biomass, and (3) ultrasound-extracted biomass. All samples were dried at 80 °C for 24 h to a constant weight prior to treatment and testing.
The proximate and ultimate analyses of samples were carried out using a muffle furnace and an Elementar Vario EL III Analyzer (Elementar Analysensysteme GmbH, Langenselbold, Germany), respectively. All tests mentioned above were replicated three times and averaged as the results presented in Table 1.
Table 1. Proximate and Ultimate Analyses of Different Samples

Methods
Extraction methods
Samples undergoing extraction were extracted by either Soxhlet or ultrasound method. Each extraction sample contained 3 g of untreated biomass and 150 mL of solvent, a 2:1 (V/V) mixture of benzene and ethanol. During the process of extraction, a Soxhlet apparatus operating at 90 °C for 6 h, or conversely, a bath-type ultrasonic device for indirect UAE was used to obtain extractives from raw materials. Though several factors influence UAE results (Wang and Weller 2006), exploring the optimal extraction conditions was not the purpose of this study; the parameters of ultrasonic extraction were determined according to a preliminary experiment. UAE was conducted in a conical flask immersed in the middle of a SB-400DTY Swept Ultrasonic Cleaner (Suzhou Jiangdong Precision Instrument Co., Ltd., Suzhou, China) with a frequency of 40 kHz and an intensity of 360 W at 60 °C for 30 min, which was enough to bring about complete extraction. The scheme of experimental setup is shown in Fig. 1.

Fig. 1. The scheme of ultrasound-assisted extraction experimental setup
Gas chromatography-mass spectrometry (GC-MS) analysis
Extractives from different methods were identified by GC-MS (Shimadzu GCMS-QP2010, Tokyo, Japan) with a quadrupole detector and a Rtx-5MS capillary column (30 m × 0.25 mm × 0.25 µm). Prior to analysis, the filtrate obtained after extraction was dried using sodium sulphate and concentrated to 5 mL at 80 °C. Helium was used as a carrier gas with a constant flow of 1.0 mL/min. The oven temperature was programmatically raised at a heating rate of 10 °C /min from 50 °C to 280 °C and then held at 280 °C for 5 min. Subsequently, 1 µL of the sample was injected, and the split ratio was 10:1. The MS spectrometer (Shimadzu, Tokyo, Japan) was operated in an electron ionization mode with 70 eV electron energy, and the m/z range from 33 to 450 was scanned. Total ion chromatograms (TICs) obtained using a full-scan acquisition method was used to accomplish qualitative analysis. The peaks were identified based on the NIST2011 and NIST2011s standard spectral library. Area normalization was adopted to quantify chemical components.
Thermogravimetry-infrared spectroscopy (TG-FTIR) coupled analysis
The process of volatile emission was examined using a Netzsch STA449F3 computerized thermogravimetric analyzer (TGA, NETZSCH Gerätebau GmbH, Selb, Germany) combined with Fourier transform infrared spectroscopy (FTIR). Approximately 20 mg of samples were heated to 900 °C at a heating rate of 50 °C/min. Purified argon was introduced into the reactor at a steady flow rate of 20 ml/min to create an oxygen-free atmosphere and immediately remove the gaseous and condensable products to avoid secondary interactions. The argon flow swept products into the gas cell of the FTIR spectrometer (Bruker Vertex 70v, Karlsruhe, Germany) with a resolution of 4 cm-1 and five scans per measurement. The IR scanning range was set from 4000 to 500 cm-1. This system enabled monitoring of the time-dependent evolution of volatiles and the weight of the pyrolysis residues. Interpretation of FTIR spectra was made according to the NIST spectra database and empirical literature (Yang et al. 2007; Adel et al. 2010; Părpăriţă et al. 2014b; Koutsianitis et al. 2015; Zhang et al. 2016).
Scanning electron microscopy (SEM) analysis
To assess the impact of extraction on wood structure, the microscopic structures of wood flour extracted by different methods and their pyrolysis residues were compared to those of untreated materials by scanning electron microscopy (SEM, Hitachi S-3400N II, Tokyo, Japan). Prior to analysis, the samples with particle size of 0.3 to 0.45 mm were sputter-coated with gold. Samples were examined under the high vacuum condition and at an operating voltage of 5.00 kV.
RESULTS AND DISCUSSION
Analysis of Extractives from Different Extractions
Based on previous studies, the UAE obtained considerably more extractives, compared with Soxhlet extraction (Wang et al. 2016). To distinguish the difference between UAE and SE, extractives obtained from different methods were identified and compared by GC-MS in the current study. The total ion chromatograms are presented in Fig. 2. For SE, 39 peaks were obtained from benzene-alcohol extractives, and 36 components were identified, representing 97.4% of the total areas of 39 peaks. However, 34 peaks were obtained by UAE, and 32 components representing 96.6% of the total areas were identified. Tables 2 and 3 present the specific components in extractives, which indicate that extractives consist of multiple components, such as acids, alcohols, esters, carbohydrates, and aromatic compounds. Among the aforementioned components, 4-hydroxy-3-methoxycinnamyl alcohol with up to 16.0% content was the most prevalent substance in SE. Moreover, 2,5-dimethoxy benzene propanoic acid (8.7%) and campesterol (7.2%) also showed relatively high contents. In UAE, phenol (12.5%) and dibutyl phthalate (29.0%) were detected, in addition to 4-hydroxy-3-methoxycinnamyl alcohol (8.3%) and campesterol (10.4%).

Fig. 2. Total ionic chromatograms of extractives obtained by Soxhlet extraction (a) and ultrasound-assisted extraction (b)
Further comparison indicated that extractives obtained by SE mainly consisted of moderately volatile components with medium retention time, whereas UAE exhibited a relatively large amount of components during the hold process. This occurrence may result from locally high temperature and pressure of ultrasonic cavitation, which facilitated the volatilization and degradation of extractives and improved the extraction of low-volatility (Koutsianitis et al. 2015). However, ultrasound rendered substance with high molecular weight easy to extract by opening the mass transfer channel, which also increased the number of high-volatility components in extractives. Table 3 shows that more phenols were obtained by UAE, particularly phenols with 12.5% content. Ultrasound may break the C-C bonds in guaiacyl units that inhibit phenol degradation to small molecules and affect the extraction process (Demirbaş 2005). Moreover, based on their molecular formula and relative amounts, the carbon contents of the extractives were calculated, with UAE obtaining greater content (68.8%) than that of SE (67.5%). The results correspond to a decrease in carbon, as illustrated in the ultimate analysis in Table 1.
Table 2. Results of GC-MS Analysis of Extractives Obtained by Soxhlet Extraction

Table 3. Results of GC-MS Analysis of Extractives Obtained by Ultrasound-Assisted Extraction

Thermogravimetric Analysis
Figure 3 presents the pyrolysis process for all samples. As indicated by the TG/DTG curves, all three samples rapidly decomposed at about 240 °C. Prior to this process, slight mass loss was observed in the extracted biomass. Except for moisture volatilization, the mass loss of the extracted biomass at low temperatures (100 °C to 200 °C) might result from the dehydration and depolymerization of unsteady hemicellulose, which was enhanced by pre-extraction. The DTG curves show two dominant peaks in all samples during pyrolysis. The low-temperature peak was connected to the decomposition of hemicellulose, whereas the high-temperature peak was mainly attributed to cellulose decomposition; lignin was also decomposed over a broad temperature range (Antal and Varhegyi 1995). The figures also show the main decomposition stages continued to approximately 500 °C, and then the flattening of TG/DTG curves was appeared due to aromatic condensation (Brebu et al. 2013). The amounts of residue after pyrolysis were represented in the latter phase of the measurement. Among the three samples, the untreated biomass had the highest residue content (~20.3%), as shown on the TG curve, whereas the other two samples showed similar values at about 17.6%. Although the amounts of residue were similar, UAE reflected the high efficiency of treatment by using a shorter time scale than that of SE. In conclusion, the thermal stability of samples decreased after extraction; however, differences between the UAE and SE groups were observed. The maximum rate of degradation of the 3 samples occurred at 378 °C to 382 °C on the DTG curves; the highest maximum mass-loss rate (-52.1%/min) corresponded to the lowest temperature (378.4 °C) was observed in the ultrasound-extracted wood.


Fig. 3. TG (a) and DTG (b) curves at a heating rate of 50 °C/min
TG-FTIR Analysis of Volatiles Released During Pyrolysis
To investigate the mass loss behavior reflected on the TG/DTG curves, an FTIR spectrometer was used to analyze the volatiles emitted during pyrolysis. Infrared absorption band assignment corresponding to the main volatiles from pyrolysis, including H2O, CO2, CH4, etc., is shown in Table 4.
The FTIR spectra of volatiles emitted from wood at the maximum release are shown in Fig. 4. In accordance with the widely used Lambert-Beer law, the absorption spectrum at a specific wavenumber is linearly correlated with the concentration of specific volatiles (Bassilakis et al. 2001). The wood generally yielded non-condensable gaseous products consisting mainly of CO2 (2360 and 669 cm-1), CO (2177 and 2114 cm-1), and CH4 (3014 cm-1). Other significant condensable volatiles included H2O, aldehydes, carboxylic acids, ketones, and alcohols. The spectra indicate that the species of the volatiles emitted from different samples were almost identical because the adsorption bands appeared to be at almost the same wavenumber. However, the intensity of absorption peaks varies, which suggested differences in the quantity of volatiles. Compared with the other two samples, wood treated with ultrasound showed stronger absorption peaks, which were consistent with a higher mass-loss rate, as shown in Fig. 3.
Table 4. Infrared Absorption Band Assignment for Volatiles from Biomass Pyrolysis


Fig. 4. FTIR spectra of volatiles for samples at the maximum mass-loss rate
The characteristic bands at 3500 to 3950 cm-1 and 1300 to 1900 cm-1 indicate the release of water at this stage. The wide spectral regions at 2850 to 3200 cm-1 indicated the existence of the C–H stretching vibration, which identified the volatile species with the help of other characteristic bands, such as formic acid (2943, 1770, 1105 cm-1), acetic acid (2944, 1791, 1182 cm-1), and acetone (2937, 1731, 1216 cm-1). The bands at 2710 to 3140, 1300 to 1400, and 960 to 1085 cm-1, were characteristics of methanol, which was released continuously in a significant amount. Phenols derived from lignin polymer were also essential products in wood pyrolysis and correspond to absorption bands at 1300 to 1400 cm-1. However, owing to signal overlap, the species of phenols were difficult to confirm in Fig. 4. In addition, the absorption bands of formaldehyde (2770 to 2860, 1746, 1508, and 1167 cm-1), levoglucosan (1183 cm-1), and hydroxyacetaldehyde (860 cm-1) indicated their formation in the temperature range of maximum volatile release (Li et al. 2001; Liu et al. 2009).
Typical stack plots of volatile FTIR spectra from pyrolysis are presented in Fig. 5. The FTIR spectra taken from 50 °C to 900 °C were plotted one on top of the other to form the 3D spectra. These plots indicated the evolution of volatile products during pyrolysis, as a function of both wavenumber and temperature (Yang et al. 2007). Compounds could be more accurately identified by analyzing multiple signals because the temperature evolution of some compounds varied (Brebu et al. 2013). In addition, complete distribution of absorption bands could be presented using the 3D spectra. The bands at 1714, 1267, 1004, and 750 cm-1 in the 3D spectra represented the formation of furfural, which did not clearly appear in Fig. 4. Further, the maximum volatile release of the three samples occurred at 388 °C to 393 °C in the stack plots, whereas the maximum rate of degradation was at 378 °C to 382 °C on the DTG curves. These differences in the characteristic temperatures of pyrolysis determined from FTIR and DTG data were expected, owing to the transport of the volatile products from the TG furnace to the FTIR detectors through the transfer lines.

Fig. 5. Typical stack plots of volatile FTIR spectra: (a) untreated samples; (b) Soxhlet extracted samples; and (c) ultrasound-extracted samples.
Figure 6 shows the specific FTIR profiles of several products evolving from wood pyrolysis, including CO2, CO, CH4, and several organics. The variation of absorbance across the entire pyrolysis process reflected the concentration trend of the volatile species (Gao et al. 2013). Thus, these profiles described the release process of volatiles. The majority of initiation reactions became significant above 200 °C, and almost all of the volatiles presented two dominant peaks in the neighborhood of 320 °C and 390 °C. The high-temperature peaks of the ultrasound-treated samples were shifted slightly lower, which was consistent with the two distinct mass loss peaks in the DTG curves in Fig. 3 (b).

Fig. 6. FTIR profiles of primary volatiles emitted during pyrolysis of samples
Absorption peaks at 2177 and 2360 cm-1 resulting from the C–O stretching vibration and C=O stretching vibration, respectively, were used to construct the formation profiles of CO2 and CO. CO was a decomposition product of ether groups, and originates from the ether bridges of lignin subunit connections and/or the ether compounds in the secondary cracking of volatiles (Zhang et al. 2016). Additionally, cellulose pyrolysis and the break of lateral chains in lignin polymer, such as the aliphatic hydroxyl group and the C–C bond also generated CO (Fenner and Lephardt 1981). By comparison, hemicellulose contributed less to the amount of CO produced in pyrolysis, so that, compared to the other products, the low-temperature peak (~320 °C) of CO in Fig. 6(a) was not apparent. At high temperature (>500 °C) the increase of CO was most likely to be attributed to the secondary pyrolysis of tar residue in the solid sample. The secondary reactions can be expressed as follows:
![]() (1)
(1)
![]() (2)
(2)
As discussed by Yang et al. (2007), the releasing of CO2 was mainly caused by the cracking and reforming of functional groups of carboxyl and carbonyl in hemicellulose under 500 °C. Lignin contributed a considerable amount of CO2, most notably by decarboxylation at around 400 °C (Jakab et al. 1995), whereas cellulose resulted in a small amount of CO2, due to the lowest content of C=O group in samples. For cellulose, possible mechanisms to produce CO2 involved depolymerization reactions of the active cellulose and decomposition of levoglucosan to volatiles with low molecular weight (Banyasz et al. 2001; Kawamoto et al. 2003). The strongest peak of CO2 occurring at ~390 °C can be regarded as the combined action of cellulose and lignin.
In Fig. 6(c), the absorption peaks at 3004 cm-1 were extracted to plot the releasing profiles of methane, whose evolution occurred at low levels throughout the pyrolysis process. However, sharp rises in methane formation were observed between 300 °C to 500 °C. At temperatures above 250 °C, radical reactions that played vital roles in describing degradation of lignocellulosic structural material became significant. CH3 and H radicals formed from H abstraction and β-carbon scission reactions could begin to form CH4 (Butterman and Castaldi 2007). As the temperature increased, sharp peaks appeared near 400°C, while broad peaks formed in the high temperature range of 500 °C to 600 °C. CH4 released at lower temperature mainly came from the decomposition of methyl and methoxy functional groups, while the decomposition of the hydrocarbon skeleton after deoxygenation, as well as the following molecular methanation reactions, can partly account for CH4 produced above 400 °C (Faix et al. 1988; Jakab et al. 1995; Butterman and Castaldi 2007).
 (3)
(3)
 (4)
(4)
 (5)
(5)
Alcohols and phenols were identified by the significant bands of –OH at 1300 to 1400 cm-1. Furthermore, methanol, one of the most important alcohols, was observed, based on the characteristic bands at 2710 to 3140 and 960 to 1085 cm-1. From the study of Jensen et al. (1998), methanol was not formed in the pyrolysis of cellulose, and therefore the profiles of methanol in Fig. 6(d) originated primarily from the decomposition of hemicellulose and lignin. Although there are large amounts of hydroxyl in hemicellulose, alcohols were not superior in numbers as compared to other organics. The oxidization of hydroxyl during pyrolysis might account for this result, due to the transfer of hydroxyl into carboxyl and carbonyl. As the temperature increased, the cracking of C–C bonds in xylose could facilitate the formation of alcohols. In terms of lignin, the methoxyl substituents were the most probable contributors to the formation of methanol (Liu et al. 2008). Furthermore, free hydroxyl groups generated by the breakage of lignin structure at lower temperature could reform with C–O bonds subsequently forming methanol.
Figures 6(e) and 6(f) show the profiles of acetic acid and formic acid at 1791 cm-1 and 1105 cm-1, respectively. The obvious discrepancies in volatile evolution between acetic acid and formic acid reflect the different mechanisms of acid formation. Based on existing studies, acids produced in biomass pyrolysis were mostly contributed by the degradation of hemicellulose and cellulose, while those from lignin were negligible (Yang et al. 2007). For acetic acid, peaks were higher at lower temperature (~320 °C) than those near 390 °C, which suggested that it was mainly derived from hemicellulose. Specifically, acetic acid could be related to acetyl groups in the main xylan chain (Ponder and Richards 1991; Shafizadeh et al. 1972). Compared with acetic acid that was apt to present the maximum volatile peak at lower temperature, the peaks of formic acid in the range of 300 °C to 400 °C were not completely separate and a higher temperature was required for the generation of formic acid.
In Fig. 6, the effects of ultrasonic treatment on the pyrolysis of wood are shown. Extraction played a major role in the formation of CO and methanol because the changes in both UAE and SE groups were obvious when compared with untreated samples. After extraction, more CO and less methanol were released at the dominant peak around 390 °C. CO produced after UAE was less than that generated in SE group, which was likely due to the ether bonds in lignin cleaved by ultrasound (Yoshioka et al. 2000). Figures 6(b), 6(c), and 5(f) imply that the ultrasonic effects were closely connected with the formation of CO2, CH4 and formic acid. Under the influence of ultrasound, less CO2 and formic acid were emitted during the degradation process, while more CH4 was detected especially at the temperature range above 400 °C. Moreover, the acetic acid profiles of all samples were similar to each other, except for small differences in the high-temperature peak, which may result from the joint effects of ultrasound and extraction.
Scanning Electron Microscopy (SEM) Analysis
To elucidate the effects of UAE exerted on wood structure, the wood flour extracted using different methods and their pyrolysis residues were examined based on morphology with SEM and compared with those of untreated materials. The results of wood flour are presented in Fig. 7. Low-magnification (1000×) micrographs (Figs. 7(a)-7(c)) show the rough surface of wood fibers on which chippings are produced by mechanical damage, particularly in the case of untreated flour. For both extracted samples, chippings that were loosely attached to the wood fiber surface markedly decreased because of physical force during extraction. More importantly, cracks appearing on the cell walls of ultrasonically treated samples indicated disruption of the cell structure. High-magnification (2000×) images (Figs. 7(d)-7(f)) focus on the pits of the cell wall and reveal that raw materials possess relatively complete and occlusive pit membranes, compared with the extracted samples. In Soxhlet extraction, the permeability of pits did not significantly improve. However, ultrasound destroyed most of the pit membranes or caused cracks on them. These changes exerted a positive and sizable effect on biomass penetrability, and the acceleration of extraction were interpreted in terms of morphology.
The SEM images of both untreated and extracted pyrolysis residues are observed in Fig. 8 at low magnification of 2.00 k (Figs. 8(a)-8(c)) and high magnification of 4.00 k (Figs. 8(d)-8(f)). The low-magnification micrographs show the shape of biomass residues, which appear irregular and significantly altered after pyrolysis. Due to the thermal effects of pyrolysis, all samples became thin and twisted. In the higher-magnification micrographs (Figs. 8(d)-8(f)), these residues still show partial retention of the initial structure, such as the cell wall and pits. As shown in the wood flour, the pit membranes in residues were also broken down in the group treated with ultrasound, whereas nearly integrated pit membranes were found in the residues of untreated samples. The destruction of pit membranes could be ascribed to the ultrasonic cavitation that exposed the cell surface to fluid jets, creating mass transfer channels, which significantly improved the penetrability of the biomass.
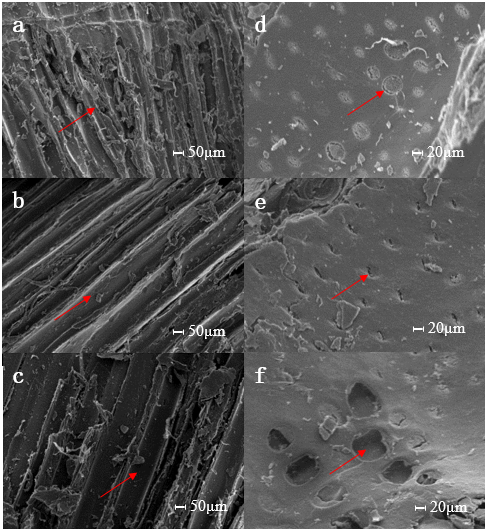
Fig. 7. Scanning electron micrographs of Eucalyptus samples at different degrees of magnification (1.00 k and 2.00 k). (a) and (d), untreated samples; (b) and (e), Soxhlet extracted samples; (c) and (f), ultrasound-assisted extracted samples.
The large changes in the microstructure observed via SEM could explain the extraction of more components by UAE. Moreover, compared with other samples, multiple small protuberances were observed on the surface of the residues treated by ultrasound, which suggested deeper changes to the biomass structure, such as the melt and repolymerization of lignin (Shen et al. 2016). This peculiar surface structure may lead to further reaction and contribute to more volatiles, as indicated in Figs. 4 and 5.
Influence Mechanism of Ultrasound on Wood Characteristics
According to previous studies (Ebringerová and Hromádková 2002; García et al. 2011; Shirsath et al. 2012), ultrasonic extraction affects the properties of raw materials mainly because of extraction and cavitation. Owing to the propagation of ultrasound pressure waves through the solvent, the cavities collapse, thereby generating localized ‘‘hot spots’’ with transient high temperature and pressure (Saharan et al. 2011). Cavitation also results in strong liquid circulation, high shear stress near the bubble wall, and formation of microjets near the solid surface (Mason and Lorimer 2002; Sutkar and Gogate 2012).

Fig. 8. Scanning electron micrographs of pyrolysis residues at different degrees of magnification (2.00 k and 4.00 k). (a) and (d) untreated samples; (b) and (e) Soxhlet extracted samples; (c) and (f) ultrasound-extracted samples.
Consequently, mechanical effects stemming from cavitation cause cell wall disruption, particle size reduction, and enhance mass transfer across cell membranes in the macroscopic view. This facilitates the extraction process and enhances the removal of extractives, which significantly effects the physicochemical characteristics of wood. However, the chemical effects of cavitation refer primarily to the generation of highly reactive free radicals and cleaves of the intermolecular and intramolecular linkage of the main wood composition (Sun et al. 2004; Sutkar and Gogate 2012). The radicals produced in ultrasonic treatment lead to a series of reactions in biomass (Badve et al. 2014).
In this study, the effects of ultrasound-assisted extraction on the physicochemical characteristics of wood were evaluated. UAE, an environment-friendly and highly efficient process for the recovery of valuable components from biomass, was expected to be further applied on wood field and to optimize biomass resources, in combination with biomass conversion technologies.
CONCLUSIONS
- The thermogravimetric (TG) curves presented the comparable residues (~17.6%) of ultrasonic-assisted extraction (UAE) and Soxhlet extracted (SE) samples; however, the amount was less than that for the untreated samples. As reflected in the differential thermogravimetry (DTG) curves, UAE possessed the highest maximum mass-loss rate (-52.1%/min) with the lowest temperature (378.4 °C); meanwhile, the curves of SE and untreated samples were similar.
- The volatile emission results indicated that CO and methanol were mainly influenced by extraction, whereas CO2, CH4, and formic acid responded to the effects of ultrasound. Following UAE, more CO, CH4, and less CO2 and formic acid were produced during pyrolysis, which benefited the utilization of biomass energy.
- Scanning electron micrograph (SEM) images indicated the fracture of pit membranes, clearly showing the mechanical effects of ultrasound on the samples and influencing the extraction effects. Further comparison of extractives by gas chromatography/ mass spectrometry (GC/MS) revealed that extractives obtained from SE mainly consisted of moderately volatile components with medium retention time, whereas UAE exhibited a relatively large amount of components during the whole process.
- The results presented in this study indicated that both mechanical and chemical effects caused by cavitation contributed to changes in the characteristics of wood, particularly in the pyrolysis properties. The mechanical effects often outweighed the chemical effects to a certain degree. The mechanical effects ultimately resulted in the removal of extractives, which contributed to the extraction effects and considerably affected the properties. By comparison, the chemical effects mainly broke down the chains and linkages between wood components, inducing decreases in molecular weight and thermal stability. These occurrences were indicated by the noticeable differences between the UAE and SE samples, particularly in the mass-loss rate and volatile emission.
- Although the results showed the potential of combination treatment of ultrasound-assisted extraction and pyrolysis, there is still a gap between the existing technologies and industrial-scale process, mainly due to the economic factor. Consequently, the further studies should focus on facilitating large scale applications of combination treatment by reducing cost and increasing the value of products.
ACKNOWLEDGMENTS
The authors acknowledge the financial support of the National Natural Science Foundation of China: Mechanism of Ultrasound Promotion Heat and Mass Transfer Within Boundary Layer During Wood Drying (No. 31600457) and the Fundamental Research Funds for the Central Universities of China (No. 2015ZCQ-CL-01). This paper is an original work of the author. Although this paper was submitted to an academic conference, the author still possesses the copyright and gives permission for publication in BioResources. In addition, the manuscript has been expended and enriched before this submission.
REFERENCES CITED
Adel, A. M., El–Wahab, Z. H. A., Ibrahim, A. A., and Al–Shemy, M. T. (2010). “Characterization of microcrystalline cellulose prepared from lignocellulosic materials. Part I. Acid catalyzed hydrolysis,” Bioresource Technolology 101:4446-4455. DOI: 10.1016/j.biortech.2010.01.047
Antal, M. J., and Varhegyi, G. (1995). “Cellulose pyrolysis kinetics: The current state of knowledge,” Industrial & Engineering Chemistry Research 34(3), 703-717. DOI: 10.1021/ie00042a001
Badve, M. P., Gogate, P. R., Pandit, A. B., and Csoka, L. (2014). “Hydrodynamic cavitation as a novel approach for delignification of wheat straw for paper manufacturing,” Ultrasonics Sonochemistry 21(1), 162-168. DOI: 10.1016/j.ultsonch.2013.07.006
Banyasz, J. L., Li, S., Lyons-Hart, J., and Shafer, K. H. (2001). “Gas evolution and the mechanism of cellulose pyrolysis,” Fuel 80(12), 1757-1763. DOI: 10.1016/S0016-2361(01)00060-6
Bassilakis, R., Carangelo, R. M., and Wójtowicz, M. A. (2001). “TG-FTIR analysis of biomass pyrolysis,” Fuel 80(12), 1765-1786. DOI: 10.1016/S0140-6701(02)86440-2
Brebu, M., Tamminen, T., and Spiridon, I. (2013). “Thermal degradation of various lignins by TG-MS/FTIR and Py-GC-MS,” Journal of Analytical & Applied Pyrolysis 104(11), 531-539. DOI: 10.1016/j.jaap.2013.05.016
Butterman, H. C., and Castaldi, M. J. (2007). “Influence of CO2 injection on biomass gasification,” Industrial & Engineering Chemistry Research 46(26), 8875-8886. DOI: 10.1021/ie071160n
Chen, F., Sun, Y., Zhao, G., Liao, X., Hu, X., Wu, J., and Wang, Z. (2007). “Optimization of ultrasound-assisted extraction of anthocyanins in red raspberries and identification of anthocyanins in extract using high-performance liquid chromatography-mass spectrometry,” Ultrasonics Sonochemistry 14(6), 767-778. DOI: 10.1016/j.ultsonch.2006.12.011
Chen, W., Yu, H., Liu, Y., Chen, P., Zhang, M., and Hai, Y. (2011). “Individualization of cellulose nanofibers from wood using high-intensity ultrasonication combined with chemical pretreatments,” Carbohydrate Polymers 83(4), 1804-1811. DOI: 10.1016/j.carbpol.2010.10.040
Dahmoune, F., Spigno, G., Moussi, K., Remini, H., Cherbal, A., and Madani, K. (2014). “Pistacia lentiscus leaves as a source of phenolic compounds: Microwave-assisted extraction optimized and compared with ultrasound-assisted and conventional solvent extraction,” Industrial Crops and Products 61, 31-40. DOI: 10.1016/j.indcrop.2014.06.035
Demirbaş, A. (2005). “Estimating of structural composition of wood and non-wood biomass samples,” Energy Sources 27 (8), 761-767. DOI: 10.1080/00908310490450971
Ebringerová, A., and Hromádková, Z. (2002). “Effect of ultrasound on the extractibility of corn bran hemicelluloses,” Ultrasonics Sonochemistry 9(4), 225-229. DOI: 10.1016/S1350-4177(01)00124-9
Faix, O., Jakab, E., Till, F., and Székely, T. (1988). “Study on low mass thermal degradation products of milled wood lignins by thermogravimetry-mass-spectrometry,” Wood Science and Technology 22(4), 323-334. DOI: 10.1007/BF00353322
Fenner, R. A., and Lephardt, J. O. (1981). “Examination of the thermal decomposition of kraft pine lignin by Fourier transform infrared evolved gas analysis,” Journal of Agricultural & Food Chemistry 29(4), 846-849. DOI: 10.1021/jf00106a042
Gao, N., Li, A., Quan, C., Du, L., and Duan, Y. (2013). “TG–FTIR and Py–GC/MS analysis on pyrolysis and combustion of pine sawdust,” Journal of Analytical & Applied Pyrolysis100(6), 26-32. DOI: 10.1016/j.jaap.2012.11.009
García, A., Alriols, M. G., Llano-Ponte, R., and Labidi, J. (2011). “Ultrasound-assisted fractionation of the lignocellulosic material,” Bioresource Technology 102(10), 6326-30. DOI: 10.1016/j.biortech.2011.02.045
Guo, X. J., Wang, S. R., Wang, K. G., Qian, L., and Luo, Z. Y. (2010). “Influence of extractives on mechanism of biomass pyrolysis,” Journal of Fuel Chemistry & Technology 38(38), 42-46. DOI: 10.1016/S1872-5813(10)60019-9
Jakab, E., Faix, O., Till, F., and Szekely, T. (1995). “Thermogravimetry/mass spectrometry study of six lignins within the scope of an international round robin test,” Journal of Analytical & Applied Pyrolysis 35(2), 167-179. DOI: 10.1016/0165-2370(95)00907-7
Jensen, A., Damjohansen, K., Wójtowicz, M. A., and Serio, M. A. (1998). “TG-FTIR study of the influence of potassium chloride on wheat straw pyrolysis,” Energy & Fuels 12(5). DOI: 10.1021/ef980008i
Kawamoto, H., Murayama, M., and Saka, S. (2003). “Pyrolysis behavior of levoglucosan as an intermediate in cellulose pyrolysis: Polymerization into polysaccharide as a key reaction to carbonized product formation,” Journal of Wood Science 49(5), 469-473. DOI: 10.1007/s10086-002-0487-5
Koutsianitis, D., Mitani, C., Giagli, K., Tsalagkas, D., Halász, K., Kolonics, O., Gallis, C., and Csóka, L. (2015). “Properties of ultrasound extracted bicomponent lignocellulose thin films,” Ultrasonics Sonochemistry 23, 148-55. DOI: 10.1016/j.ultsonch.2014.10.014
Li, H., Pordesimo, L., and Weiss, J. (2004). “High intensity ultrasound-assisted extraction of oil from soybeans,” Food Research International 37(7), 731-738. DOI: 10.1016/j.foodres.2004.02.016
Li, S., Lyons-Hart, J., Banyasz, J., and Shafer, K. (2001). “Real-time evolved gas analysis by FTIR method: An experimental study of cellulose pyrolysis,” Fuel 80(12), 1809-1817. DOI: 10.1016/S0016-2361(01)00064-3
Liu, Q., Wang, S., Wang, K., Luo, Z., and Cen, K. (2009). “Pyrolysis of wood species based on the compositional analysis,” Korean Journal of Chemical Engineering 26(2), 548-553. DOI: 10.1007/s11814-009-0093-y
Liu, Q., Wang, S., Zheng, Y., Luo, Z., and Cen, K. (2008). “Mechanism study of wood lignin pyrolysis by using TG–FTIR analysis,” Journal of Analytical & Applied Pyrolysis 82(1), 170-177. DOI: 10.1016/j.jaap.2008.03.007
Mason, T. J., and Lorimer, J. P. (2002). Applied Sonochemistry: Uses of Power Ultrasound in Chemistry and Processing, Wiley-VCH, Darmstadt,Germany. DOI: 10.1002/352760054X
McKendry, P. (2002). “Energy production from biomass (Part 1): Overview of biomass,” Bioresource Technology 83(1), 37-46. DOI: 10.1016/S0960-8524(01)00118-3
Oudia, A., Mészáros, E., Jakab, E., Simões, R., Queiroz, J., Ragauskas, A., and Novák, L. (2009). “Analytical pyrolysis study of biodelignification of cloned Eucalyptus globulus (EG) clone and Pinus pinaster Aiton kraft pulp and residual lignins,” Journal of Analytical & Applied Pyrolysis 85(1-2), 19-29. DOI: 10.1016/j.jaap.2008.09.015
Părpăriţă, E., Brebu, M., Uddin, M. A., Yanik, J., and Vasile, C. (2014a). “Pyrolysis behaviors of various biomasses,” Polymer Degradation & Stability 100(1), 1-9. DOI: 10.1016/j.polymdegradstab.2014.01.005
Părpăriţă, E., Nistor, M. T., Popescu, M. C., and Vasile, C. (2014b). “TG/FT-IR/MS study on thermal decomposition of polypropylene/biomass composites,” Polymer Degradation & Stability 109(28), 13-20. DOI: 10.1016/j.polymdegradstab.2014.06.001
Pappas, C., Tarantilis, P. A., Daliani, I., Mavromoustakos, T., and Polissiou, M. (2002). “Comparison of classical and ultrasound-assisted isolation procedures of cellulose from kenaf (Hibiscus cannabinus L.) and eucalyptus (Eucalyptus rodustrus Sm.),” Ultrasonics Sonochemistry 9(1), 19-23. DOI:10.1016/S1350-4177(01)00095-5
Ponder, G. R., and Richards, G. N. (1991). “Thermal synthesis and pyrolysis of a xylan,” Carbohydrate Research 218(91), 143-155. DOI: 10.1016/0008-6215(91)84093-T
Saharan, V. K., Badve, M. P., and Pandit, A. B. (2011). “Degradation of Reactive Red 120 dye using hydrodynamic cavitation,” Chemical Engineering Journal 178(24), 100-107. DOI: 10.1016/j.cej.2011.10.018
Shafizadeh, F., Mcginnis, G. D., and Philpot, C. W. (1972). “Thermal degradation of xylan and related model compounds,” Carbohydrate Research 25(1), 23-33. DOI: 10.1016/S0008-6215(00)82742-1
Shen, X. J., Wang, B., Huang, P. L., Wen, J. L., and Sun, R. C. (2016). “Effects of aluminum chloride-catalyzed hydrothermal pretreatment on the structural characteristics of lignin and enzymatic hydrolysis,” Bioresource Technology 206, 57-64. DOI: 10.1016/j.biortech.2016.01.031
Shirsath, S. R., Sonawane, S. H., and Gogate, P. R. (2012). “Intensification of extraction of natural products using ultrasonic irradiations—A review of current status,” Chemical Engineering & Processing Process Intensification 53(2), 10-23. DOI: 10.1016/j.cep.2012.01.003
Sun, J. X., Sun, R., Sun, X. F., and Su, Y. (2004). “Fractional and physico-chemical characterization of hemicelluloses from ultrasonic irradiated sugarcane bagasse,” Carbohydrate Research 339(339), 291-300. DOI: 10.1016/j.carres.2003.10.027
Sutkar, V. S., and Gogate, P. R. (2012). “Design aspects of sonochemical reactors: Techniques for understanding cavitational activity distribution and effect of operating parameters,” Chemical Engineering Journal 155(1-2), 26-36. DOI: 10.1016/j.cej.2009.07.021
Toma, M., Vinatoru, M., and Mason, T. J. (1999). “Ultrasonically assisted extraction of bioactive principles from plants and their constituents,” Advances in Sonochemistry 5,209-248. DOI: 10.1016/S1569-2868(99)80007-2
Vinatoru, M. (2001). “An overview of the ultrasonically assisted extraction of bioactive principles from herbs,” Ultrasonics Sonochemistry 8(3), 303-313. DOI: 10.1016/S1350-4177(01)00071-2
Wang, Z. Y., He, Z. B., Zhao, Z. J., Yi, S. L., and Mu, J. (2016). “Influence of ultrasound-assisted extraction on the pyrolysis characteristics and kinetic parameters of eucalyptus,” Ultrasonics Sonochemistry 37, 47-55. DOI: 10.1016/j.ultsonch.2016.12.028
Wang, L., and Weller, C. L. (2006). “Recent advances in extraction of nutraceuticals from plants,” Trends in Food Science & Technology 17(6), 300-312. DOI: 10.1016/j.tifs.2005.12.004
Wang, Y., Wu, L., Wang, C., Yu, J., and Yang, Z. (2011). “Investigating the influence of extractives on the oil yield and alkane production obtained from three kinds of biomass via deoxy-liquefaction,” Bioresource Technology 102(14), 7190-5. DOI: 10.1016/j.biortech.2011.04.060
White, J. E., Catallo, W. J., and Legendre, B. L. (2011). “Biomass pyrolysis kinetics: A comparative critical review with relevant agricultural residue case studies,” Cheminform 42(31), 1-33. DOI: 10.1016/j.jaap.2011.01.004
Yang, H., Yan, R., Chen, H., Dong, H. L., and Zheng, C. (2007). “Characteristics of hemicellulose, cellulose and lignin pyrolysis,” Fuel 86(12-13), 1781-1788. DOI: 10.1016/j.fuel.2006.12.013
Yanik, J., Kornmayer, C., Saglam, M., and Yüksel, M. (2007). “Fast pyrolysis of agricultural wastes: Characterization of pyrolysis products,” Fuel Processing Technology 88(10), 942-947. DOI: 10.1016/j.fuproc.2007.05.002
Yoshioka, A., Seino, T., Tabata, M., and Takai, M. (2000). “Homolytic scission of interunitary bonds in lignin induced by ultrasonic irradiation of MWL dissolved in dimethylsulfoxide,” Holzforschung 54(4), 357-364. DOI: 10.1515/HF.2000.062
Zhang, L. F., and Liu, Z. L. (2008). “Optimization and comparison of ultrasound/ microwave assisted extraction (UMAE) and ultrasonic assisted extraction (UAE) of lycopene from tomatoes,” Ultrasonics Sonochemistry 15(5), 731-737. DOI: 10.1016/j.ultsonch.2007.12.001
Zhang, Y., He, Z. B., Xue, L., Chu, D. M., and Mu, J. (2016). “Influence of a urea–formaldehyde resin adhesive on pyrolysis characteristics and volatiles emission of poplar particleboard,” RSC Advances 6(16), 12850-12861. DOI: 10.1039/C5RA18068F
Zhou, X. D., and Wingfield, M. J. (2011). “Eucalypt diseases and their management in China,” Australasian Plant Pathology 40(4), 339-345. DOI: 10.1007/s13313-011-0053-y
Article submitted: August 3, 2018; Peer review completed: October 11, 2018; Revised version received: October 19, 2018; Accepted: October 20, 2018; Published: October 26, 2018.
DOI: 10.15376/biores.13.4.9033-9052