
Abstract
Wood dust is generated as a by-product of machining. This paper discusses the granulometric analysis of selected samples of wood-settled dust from spruce (Picea abies L.), fir (Abies alba Mill.), oak (Quercus petraea Liebl.), beech (Fagus sylvatica L.), and alder (Alnus glutinosa L.). It also includes a sample of a mixture from timber production grinders in order to select the percentages of the various fractions (32 μm, 63 μm, 80 μm, 125 μm, 250 μm, 500 μm, 1000 μm, 2000 μm) of wood dust samples. Wood dust samples were made using a hand orbital sander and sized on an automatic mesh vibratory sieve machine. Comparison of the resulting granulometric fractions’ contributions to wood sanding dust was confirmed by the particle size. This paper presents selected characteristics of the chosen wood dusts by the size of particle dust fractions on the base of continual thermal loading. Thermal properties of wood dust samples were characterized by thermal gravimetric analysis (TGA). The TGA results indicated different thermal degradation fractions of the wood dust samples during thermal loading. The wood dust consisted mainly of fractions of 80 µm, 32 µm, and < 32 µm. These fractions of all wood dusts species presented more than 70.00% of the sample (alder dust has more 80% of sample). Thermal characteristics were not confirmed by the particle size and different wood dust.
Download PDF
Full Article
Thermal Analysis of Granulometry Selected Wood Dust Particles
Iveta Marková,a, Emília Hroncová,a Ján Tomaškin,a and Ivana Tureková b
Wood dust is generated as a by-product of machining. This paper discusses the granulometric analysis of selected samples of wood-settled dust from spruce (Picea abies L.), fir (Abies alba Mill.), oak (Quercus petraea Liebl.), beech (Fagus sylvatica L.), and alder (Alnus glutinosa L.). It also includes a sample of a mixture from timber production grinders in order to select the percentages of the various fractions (32 μm, 63 μm, 80 μm, 125 μm, 250 μm, 500 μm, 1000 μm, 2000 μm) of wood dust samples. Wood dust samples were made using a hand orbital sander and sized on an automatic mesh vibratory sieve machine. Comparison of the resulting granulometric fractions’ contributions to wood sanding dust was confirmed by the particle size. This paper presents selected characteristics of the chosen wood dusts by the size of particle dust fractions on the base of continual thermal loading. Thermal properties of wood dust samples were characterized by thermal gravimetric analysis (TGA). The TGA results indicated different thermal degradation fractions of the wood dust samples during thermal loading. The wood dust consisted mainly of fractions of 80 µm, 32 µm, and < 32 µm. These fractions of all wood dusts species presented more than 70.00% of the sample (alder dust has more 80% of sample). Thermal characteristics were not confirmed by the particle size and different wood dust.
Keywords: Wood dust samples; Granulometric analysis of dust samples; TGA analysis
Contact information: a: Department of Environmental Management, Faculty of Nature Sciences, Matej Bel University, Tajovského 40, 97401 Banská Bystrica, Slovakia; b: Department of Technology and Information Technologies, Faculty of Education, Constantine the Philosopher University in Nitra, Slovakia
Corresponding author: iveta.markova@umb.sk
INTRODUCTION
The mechanical processing of wood (sawing, planning, milling, and grinding) creates a large quantity of dust and chips, which pose a risk of fire or explosion (Krentowski 2015; Marková et al. 2016). Dust created by wood working, especially grinding, is flammable and can form an explosive mixture with air (Očkajová and Marková 2016). The timber industry is a sector that generates dust as an undesirable waste (Top et al. 2016).
Many authors (Cichy and Pawlowski 2010; Zachar et al. 2012; Zajemska 2012; Osvaldová et al. 2014) discuss the influences of wood properties on the flammability and external conditions affecting the thermal degradation of wood and wood dust. On the other hand, wood dust and wood chips represent forms of solid fuels as renewable energy sources. The effect of heat generation due to pyrolysis affects more conditions, including the form of dust particles (Fantozzi 2007 a,b).
The wood dust is characterised by thermogravimetric analysis size of dust particles. The particles that passed through a sieve of the mesh size and onto the sieve of the next smaller mesh size were added to the fractions within the size range of the given two mesh sizes (0-32 μm, 32-63 μm, 63-80 μm, 80-125 μm, 120-250 μm, 250-500 μm, 0.5-1 mm, and 1-2 mm). A set of particles in each size range was formed by sizing, and from here the cumulative grading curve was derived by the appropriate procedure (Dzurenda and Orlowski 2011; Očkajová et al.2014).
The dust particles are divided by size into broad and silk (airborne), with particles to size 30 μm. Airborne dust up to the particles size of 5 μm are called respirable dust (Tureková 2013b). Such particles tend to remain in the air, but, if inhaled, they pass into the lungs (Tureková 20013a). Penetration by this dust into human airways depends on the size of dust particles. Dust particles with dimensions >100 μm quickly settle in the environment and do not penetrate the body.
Dustiness in the workplace, due to the formation of wood dust, is harmful to the human body (Tureková et al. 2013a; Marková et al. 2016) and represents one of the fundamental issues of safety and workplace hygiene. Tureková et al. (2013b) presented the results of studies concerning the harmful effects of dust on human health. It was noted that though most of the dust is collected in the conducting airways (nose, larynx, tracheobronchial tree), a small portion of dust is inhaled into the lungs via dust inhalation. The respirable fraction is the fraction inhaled particles than can penetrate the lower gas exchange region of the lung (ISO 7708:1995).
Mračková and Tureková (2016) dealt with the statistical evaluation of wooden particles of palisander (Jacaranda mimosifolia) and oak (Quercus robur). Their samples were taken from the operation of the production furniture, in which dust is formed during the woodworking. Their measurement was carried out by a laser analyser.
The test methods to characterize the different parameters of flammability and protentional for explosion are described in national and international standards that have been developed over recent decades, as indicated by Garcia et al. (2016). A new standard (ISO/IEC 80079-20-2:2016) describes the test methods for determining whether a material exhibits properties to be considered as combustible dust, and for determining the explosion characteristics of these combustible dusts. These test methods are applicable in identifying potential ignition sources of equipment that are used in classified areas because of the presence of combustible dust (Garcia et al. 2016). Moreover, these authors described and offered thermal susceptibility tests, including thermal analysis. The thermal analysis was used to understand the thermal behaviour of solids and to determine their self-combustion tendency (Garcia et al. 2016).
Two methods of heating samples are generally employed. By the method of isothermal (static) thermogravimetry, the sample is heated at a constant temperature. On the other hand, during un-isothermal (dynamic) thermogravimetry methods, the weight changes of a sample is monitored in relation to time and temperature. In the latter case, temperature grows at a linear speed that represents the speed of heating (°C.min-1). The thermal gravimetric analysis (TGA) curves show the relationship between the growth and the decline of weight to temperature. The thermal analysis allows the monitoring of reactions, degradation speed, weight decline, change of degradation temperatures, changes in exothermic and endothermic effects, etc. The TGA curve allows the evaluation of its horizontal parts that are characterized by constant weight. It can also be used to evaluate those parts of the curve where steepness characterizes the speed of weight change and where it reaches its maximum point (dm/dtmaximum) (Lyon et al. 2007; Tabari et al. 2012; Marková et al. 2018).
Wood dust that results from wood processing has a specific behaviour. When combined with air, it creates a dispersion mixture which can be explosive. Explosive concentrations are determined by a standardized method. The dust may settle on plants and be thermally degraded by heat. The processing of thermally degraded wood dust is not treated with standardized methods. For the purpose of research, the TGA analysis method was selected; TSA was used to quantify the thermal degradation of wood dust by the thermal load. The behaviour of beech wood dust is affected by particle size (Marková et. al. 2018).
As a whole material, wood undergoes a complex degradation process that is greatly affected by its physical nature. During the thermal decomposition process of wood, small molecules are eliminated, and eventually only a charred mass remains. Non-combustible products, such as carbon dioxide, traces of inorganic compounds, and water vapor, are produced up to 130 °C (Popescu et al. 2011). Our drying process occurred briefly at lower temperatures (5 to 68 °C).
Alfredsen et al. (2012) describe a thermogravimetry test that measures the weight of the sample as a function of its temperature when it is heated. The procedure was developed from 20 to 1000 °C with a heating rate of 10 °C.min-1. The data obtained was plotted as a weight loss vs. temperature graph. Concerning the present study, three main parameters were observed when studying this graph: the induction temperature (IT), or the temperature at which the oxidation reaction started to accelerate; the maximum weight loss temperature (MLT), representing the yield of volatiles from the pyrolysis process; and the weight loss (WG), corresponding to the thermal degradation samples present in the first stage of heating and oxidation. Popescu et al.(2011) describe the several parameters that were evaluated for each step of mass loss: the “onset” temperature (Ti), the temperature corresponding to the maximum rate of mass loss (Tm), and the temperature corresponding to the end of stage (Tf).
The aim of this research was to analyse and compare the granulometric structure fractions of wood sanding dust from typically processed wood in the furniture industry (beech, oak, spruce, fir, and alder) prepared by a hand belt grinder and dust mixture (beech, oak, and spruce) obtained in furniture establishments. The focus was on microfractions (particles with a diameter of ≤100 µm) and the impact assessment woods and particle size (particle size <100 µm). Grinding was chosen as the process by which the wood was machined by grinder. This process produces increased of wood dust and there is assumed fire risk. The research also focused on the influence of thermal degradation parameters of selected wood dust beech (125 m) during continuous heat loading. It introduced an assessment of wood properties related to thermal degradation of selected woods. It examined the description of the general characteristics of used TGA and wood samples features. Selected thermal characteristics also were determined, especially the flash-ignition temperature, mass loss rate, and ignitability of material exposed to continuous heat loading.
EXPERIMENTAL
Materials and Methods
Preparation of wood dust samples
Three folders were prepared for the preparation of wood dust with dimensions 300 x 50 x 50 mm for any wood species that had been dried to a moisture content of approximately 8 to 10%. Five wood samples were selected from typical Slovak furniture establishments as representative of the most common industrial processing and to well represent coniferous, deciduous, and circular-porous deciduous multiple-pore wood. Coniferous wood samples included spruce (Picea abies L.) and fir (Abies alba Mill.); the selected deciduous circular-pore sample was wood oak (Quercus petraea Liebl.), and the selected deciduous multiple-pore wood samples were the European beech (Fagus sylvatica L.) and alder (Alnus glutinosa L.). Wood dust samples were prepared in Wood Technical Laboratory of Technical University in Zvolen Slovakia, which simulate the original conditions in wood manufacturing. Wood dust samples were made using a hand orbital sander BOSCH pss 200ac. The samples were prepared by a grinding specialist. The aim was to bring grinding process as close to reality as it is possible, in terms of pressure of the grinding surface of the component, grinding speed, and grinding direction (cross). During the experiments, sandpaper with the grain size P 80 (P 80 Norton H231) was used. The dust was collected in a manual extraction equipment pocket of belt sanders, from which it spilled into plastic bags, carefully sealed to prevent moisture contact. Approximately 300 g of dust was obtained from each pocket. This sample, prepared for all wood species (1 kg), was the basis for the granulometric analysis.
The sixth sample was taken during timber production from the premises of a sander (SCM SANDYA 300RCS), a powder mixture that consisted of spruce, beech, and oak dust from private wood manufacturing in Zvolen, Slovakia.
The moisture of the wood dust samples was determined by gravimetric method (Table 1). Subsequently, sieve analysis was made via the automatic vibration sieving machine Retsch AS 200 control according to ISO 3310-1:2007. The bag was cleared by a vacuum cleaner after processing each wood dust species. Different types of wood dust were divided in nine fractions according to the mesh size of the sieve based on sieve analysis in Wood Technical Laboratory of Technical University in Zvolen.
Sieve analysis was carried out on an automated vibratory sieving machine Retsch AS 200 control; a set of control stainless steel sieves, diameter of the sieve was 200 mm, and the height 50 mm. The diameter of the sieve meshes were 32 μm, 63 μm, 80 μm, 125 μm, 250 μm, 500 μm, 1 mm and 2 mm). Residues on each sieve and bottom were measured using a digital laboratory balance Radwag WPS 510/C/2 with an accuracy of 0.001 g. Sieving parameters included an amplitude of 2 mm.g-1 with an interval of 10 s and a sieving time of 20 min. Measurement process was realized according to ISO 3310-1:2007 in Physical laboratory Faculty of Nature Sciences Matej Bel University Banská Bystrica, Slovakia.
Table 1. Basic Features of Analyzed Wood Dust Samples

Thermogravimetry TGA
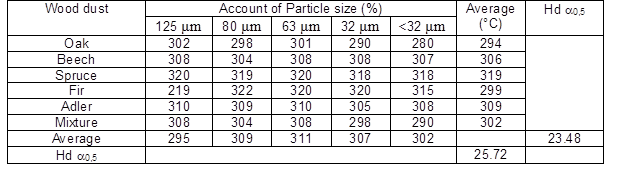
The TGA was performed on a Mettler STARe SW 01/09, evaluation of relevant software. The TGA was realized in Fire-technique Institute in Bratislava, Slovakia. Samples (Table 1) are indexed as oak (DB) – raw materials and DB + number particle size. For example, the particle sizes (fractions) of oak wood dust of 125 µm are DB 125. Other samples were given the following indices: beech, BK; spruce, SM; alder, JD; fir, JL; and mixture, ZM. The air flow ratio of the thermal analyzer was under 50 mL.min-1, and the temperature increased from the ambient temperature to 1000 °C at the heating rate of 10 °C.min-1. Two replicates were tested for each sample.
RESULTS AND DISCUSSION
Determination of Particulate Sizes (Fractions) of Selected Wood Dust Samples
Results obtained from the sieve analysis were evaluated by using distributive columns from selected samples of the wood dust. The sum percentage of obtained values always had less weight compared with the samples from the loss during sorting. The obtained distributive columns (Fig. 1) define the dependence of proportional representation of weight of certain grain sizes (fractions) in the analyzed group of natural ground.
Results of the sieve analysis were evaluated using the distributive curves of selected wood dust samples, as well as by one-way analysis of variance. The objective of the variance analysis was to determine whether statistical significance could be found in the impact of tree species on the particle size distribution of grinding dust. The analysis also looked for statistical significance in the effect of wood on dust particles of less than 100 μm. The weight and the percentages of the various fractions of selected samples of wood dust, after the sieve analysis, were evaluated using distributive curves. The percentage sum of obtained values was always lower compared with samples from the loss during sorting. The obtained distributive curve (Fig. 1) defines the dependence of proportional representation of weight of certain grain sizes (fractions) in the analyzed group of natural ground.
The most abundant fractions in all wood dust sample fractions were 32 µm and < 32 µm (bottom), which both fractions in oak samples represented 55.8% of the total sample of oak wood dust (Fig. 1). Fractions of 2 mm and 1 mm (0.99% of the total weight of the sample) were the least abundant fractions in oak wood dust samples. In a sample of beech wood dust, the fraction consisted of 32 µm and <32 µm 49.6% of the whole sample. The least abundant fractions were fractions 2 mm and 1 mm (0.5% of the total sample weight of beech wood dust) (Marková et al. 2018). In the sample of spruce wood dust fraction, 32 µm and < 32 µm formed 65.1% of the total sample, less than spruce; abundant fractions were those 2 mm and 1 mm (1.01% of total weight).
The fir wood dust sample was a 59.3% fraction, formed 32 µm and < 32 µm from weight of the sample; 0.98% from weight represented fractions of 2 mm and 1 mm. The alder wood dust sample had the highest representation in the fraction of 32 µm, < 32 µm and that of 78.3% from weight of the entire sample. The least number of fractions were those of 2 mm and 1 mm, which formed 1.21% of the total weight compared with the other samples. A wood dust mixture sample showed the same frequency of alder wood dust samples, where fractions were 32 µm less than 32 µm and formed 78.7% of the entire sample.
In the wood dust samples, there were some percentage differences in all the fractions, however, in a percentage comparison of all the fractions of less than 100 μm (bottom, 32 μm, 63 μm and 80 μm), there were similar results for all monitored wood dust. The similar results were found in the range from 86.4% to 93.1%, and at 86.4% which oak, 87.2% for beech, 87.1% for spruce, 88.4% for fir, 93.1% for alder, and 90.61% for the mixture.


Fig. 1. Distributive granularity curves of selected wood dust samples, which partical size of oak [%], partical size of beech [%], partical size of spruce [%], partical size of fir [%], partical size of alder [%] and partical size of mixture[%].
Table 2. The Impact of Wood Species and the Impact of Particle Size on the Particle Count through 2-Factor Analysis of Variance (ANOVA) Using the LSD ( = 0.05)

ANOVA – LSD test (=0.5); Different letters indicate a statistically significant difference; Standard Error of the mean
Statistical evaluation of particulate sizes
Assessing the impact of wood on the granulometric composition of abrasive dust and the impact of wood on a particle size <100 μm was made by statistical analysis. This analysis was performed by the multifactor analysis of variance (ANOVA) using Least Significant Difference LSD (95%, 99% level of provability) of the test (software: Statgraphics, version (5.0), Virginia, United States. Impact factors were: species of wood (beech, oak, spruce, fir, and alder) and particle size values (32 μm, 63 μm, 80 μm, 125 μm, 250 μm, 500 μm, 1 mm, and 2 mm).
Standard error of the mean (software: STATGRAPHICS Vers. 5.0, procedure: Descriptive methods – Summary statistics) was calculated from the data measured in five attempts. Standard errors are included in the statistical evaluation in Table 2.
Table 2 confirms significant differences for individual fractions. The 1-Factor ANOVA using the LSD test sought a link between the wood species and the particle size. The particle size of the first four fractions showed that the difference was statistically insignificant. The statistically significant difference is found in the 32 μm fraction and also in the fraction <32 μm. Fractions of 125 μm, 80 μm, 63 μm, and the first four fractions (2 mm, 1 mm, 500 μm, and 250 μm) were not significantly different. A significantly different number of particles occurred between fraction 125 μm and 32 μm. The consequence of excessive dust formation in fractions of 32 μm and <32 μm, which also included a respirable dust component, increased the health risk for employees.
Statistical evaluation of the results of the sieve analysis showed that the majority of particles are in fractions of 32 µm, followed by the fraction over 32 µm. Due to excessive dust formation just above fractions (<32 μm), which also include a respirable dust component, the risk of serious danger to the health of employees increases at these levels.
Results of Thermal Analysis
Gravimetric analysis of the fractions of selected wood dusts showed that the 2 mm, 1 mm, 0.5 mm, and 0.250 mm fractions represented a maximum of 1% of wood dust content. Thermal analyses were performed only for fractions of 125 μm, 80 μm, 63 μm, 32 μm, and a fraction <32 μm. All samples were signified by wood species and particle sizes. For example, beech dust samples were signified as BK 125, BK 80, BK 63, BK 32, BK <32. The measurement data were evaluated by statistical analysis, demonstrating the impact of wood species and the size of the fraction on the thermal parameters, the initiation temperature (Table 3), and the weight loss (Table 4).
The most common method used to investigate thermal decomposition was TGA. The thermal stability of the wood can be evaluated from the TGA data produced (Lowden and Hull 2013). Table 2 shows that the starting level of degradation represented drying. The TGA showed that the courses of fraction 63 µm and 125 µm had the same behaviour as raw beech wood (Fig. 2a) during the two stages of thermal decomposition. Wood dust beech samples in fractions 80 µm, 32 µm, and ˂32 µm indicated (Table 3) only one stage of thermal decomposition.

a) TGA curves of beech dust samples

b) TGA curves of oak dust samples

c) TGA curves of spruce dust samples

d) TGA curves of fir dust samples

e) TGA curves of alder dust samples

f) TGA curves of mixed dust samples
Fig. 2. TGA curves of wood dust samples from oak (a), beech (b), spruce (c), fir (d), alder (e) and mixture (f).
The thermogravimetric analysis of spruce dust samples (Fig. 2c) confirmed only the fraction curve 32 μm (0.032 mm), comparable with the two-step decomposition of compact wood.
Table 3. Parameters of DTG Analysis of Wood Dust Beech Samples for Individual Fractions
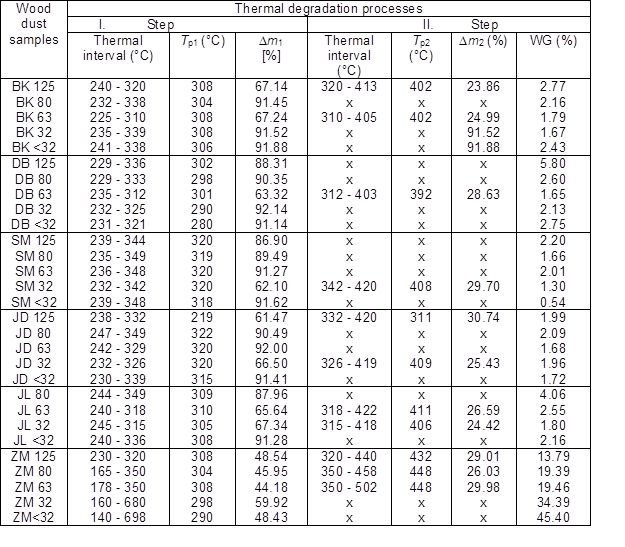
The TGA curves (samples of spruce wood dust in fractions of 125 μm, 80 μm, 63 μm, and in the fraction <32 μm) did not show a two-stage thermal decomposition. Zachar et al. (2012) described the determination of the technical parameters of spruce. The first dust samples, as seen in Fig. 2d, described a two-step thermal decomposition that occurred in fractions of 32 μm and 125 μm.Legend: DB = Oak dust, BK= Beech dust, SM = Spruce dust, JD = Alder dust, JL = Fir dust, ZM = Mixture wood dust
For the purpose of thermal analysis of alder dust samples (Fig. 2e), only four examined fractions were used (Table 2) because the fraction of 125 μm was only minimal based on screen analysis (Table 3).
The TGA analysis of alder dust samples (Table 3; Fig. 2f) described a two-stage thermal decomposition fraction of 32 μm and 63 μm. Remaining samples (80 μm and fraction <32 μm) thermally degraded in one step. The TGA curves of the wood dust mixture fractions (Fig. 2f), from the woodworking, showed the variability of the thermal degradation in the individual fractions.
Statistical evaluation of Thermal Analysis
The impact of the wood species and the particle size of wood dust were assessed by statistical analysis. The multifactor analysis of variance (ANOVA) was performed using LSD (95%, 99% level of provability) of the test (software Statgraphics version 5.0). Impact factors were: wood species (beech, oak, spruce, fir, and jelly) and particle size values ((32 μm, 63 μm, 80 μm, 125 μm, 250 μm, 500 μm, 1 mm, and 2 mm).
Evaluation parameters were the initiation temperature (Table 4) and the weight loss (Table 5).
Table 4. Impact of Wood Species and Particle Size on Initiation Temperature Ti (°C) for Thermal Degradation of Dust Samples by Two-factor Variance Analysis (ANOVA) using LSD ( = 0.05)
The statistical analysis did not show a significant influence by the wood species or by the particle size on the initiation temperature Ti (°C) on thermal degradation of the dust samples.ANOVA – LSD test (=0.5) – statistically significant difference were not confirmed.
Table 5. Impact of Wood Species and Particle Size on Weight Loss (%) during the Thermal Degradation of Dust Samples by Two-factor Analysis of Variance (ANOVA) using LSD ( = 0.05)

The statistical analysis (Table 5) showed a significant influence of the wood species on the percent change of weight loss (%) in the thermal degradation of the dust samples. A significant difference was not confirmed when assessing the impact of particle size on the mass loss of thermally degraded samples.ANOVA – LSD test (=0.5) a,b – statistically significant difference
All wood dust samples were separated on fraction to 250-micron graduation, and represented a maximum of 1% of the total (Markova et al. 2016). Other lower fractions were exposed to heat and watched their thermal degradation. The samples of the beech wood dust fraction mainly consisted of 32 µm and ˂32 µm, comprising ˂49.6% of the whole sample. The least abundant fractions were fractions 2 mm and 1 mm (0.5% of the total sample weight of beech wood dust). These results corresponded with the results of Očkajová and Banski (2013), which studied the quantity of particles under 100 μm (Picture 2) in wood dust samples of beech, from automated vibratory sieving machine (Retsch AS 200 control). Očkajová and Banski (2013) examined particles of similar size, and found that the quantity of particles less than 100 μm were as follows: 92.0% for beech (granularity 80), 85.1% for pine (granularity 80), and 95.0% for spruce (granularity 120).
Increased percentages of dust fractions represent an increased risk of explosive dust, which mixes with air and forms in an enclosed workplace. According to ISO 3569: 1995-09, based on the size of the particles, dust is classified into a very fine powder designed as A D2 (0.07 to 0.40 mm), fine dust D1 (0.50 to 3.50 mm), fine-grained dust C (3.60 to 13.0 mm), medium-grained B dust (14.0 to 75.0 mm), coarse-grained dust (more than 75.0 mm), and irregularly shaped fibrous dust particles E (Dzurenda and Orlowski 2011). For all tested samples of the present study, a very fine and fine dust were the dominant components. In terms of the risk of explosion, the risk of explosion increases with an increase of the very fine dust proportion, and, when mixed with air, is the optimal fuel at the fraction 80 µm, 32 µm, and ˂32 µm. The finer dust results in a higher maximum explosion pressure and the maximum rate of explosion pressure rise (brisance), and thus less ignition energy is required to initiate the dust-air mixture.
At approximately 150 °C, some components begin to break down chemically; low temperature degradation at low rate occurs in lignin and hemicelluloses. The mass loss between 300 and 500 °C corresponds to the degradation of cellulose, and has also been associated with the pyrolytic degradation of lignin in the evolving fragmentation of inter-unit decomposition, and condensation of the aromatic rings (Popescu et al. 2011).
CONCLUSION
- The most frequent percentages of dust particles (between 50 and 79%) in all samples of the different species studied were fractions of 32 µm and less than 32 µm (bottom). The most abundant percentage created conditions in which there was the potential of formation of a dust-air explosive mixture and a risk of inhaling respirable components, contained in the fraction over 32 µm.
- Fractions 32 m and m were the most numerous in beech wood dust, representing over 50% of the wood dust. The thermal loading of fractions 32 m and m resulted in the 90% thermal degradation of the samples at a relatively low temperature (260 °C). This occurrence confirmed an increased risk of adverse events. Fraction 80 m was thermally degraded only in one step (the rest was ash).
- The first thermal decomposition’s temperatures of all fractions dust samples were not significantly different.
- The thermal decomposition of all samples of wood dust fraction in the size 32 μm occurred in one step.
- The residuals after thermal decomposition of the wood dust samples in each fraction were in the interval 0.54% (for 32 μm spruce fraction) to 5.80% (for 125 μm oak fraction). All fractions of a mixed wood dust sample averaged 26.5%.
ACKNOWLEDGEMENTS
This work was supported by the Slovak Research and Development Agency under contract No. APVV-17-0211 “Progressive dust reduction model for large-scale degraded areas with the possibility of their ecological recover” and by the Slovak Education Grand Agency No. 014UKF-4/2016 Manual for quality prediction of school buildings environment”.
REFERENCES CITED
Alfredsen, G., Bader, T. K., Dibdiakova, J., Filbakk, T., Bollmus, S., and Hofstetter, K. (2012). “Thermogravimetric analysis for wood decay characterisation,” European Journal of Wood and Wood Products 70(4), 527-530. DOI: 10.1007/s00107-011-0566-7
Cichy, W., and Pawlowski, J. (2010). “Współspalanie węgla kamiennego i odpadów drzewnych na urządzeniach energetycznych małej mocy (Co-burning of hard coal and wood waste in low power energy installations),” Drewno 53(183), 5-33.
Dzurenda, L., and Orlowski, K. A. (2011). “The effect of thermal modification of ash wood on granularity and homogeneity of sawdust in the sawing process on a sash gang saw PRW 15-M in view of its technological usefulness,” Drewno 54(186), 27-37.
García, T. J., Ramírez-Gómez, Á., Fernandez-Anez, N., Medic Pejic, L., and Tascón. A. (2016). “Influence of the composition of solid biomass in the flammability and susceptibility to spontaneous combustion,” Fuel 184, 503-511. DOI: 10.1016/j.fuel.2016.07.045.
Fantozzi, F., Colantoni, S., Bartocci, P., and Desideri, U. (2017a). “Rotary kiln slow pyrolysis for syngas and char production from biomass and waste – Part I: Working envelope of the reactor,” Journal Engineering for Gas Turbines and Power 129(4), 901-907. DOI: 10.1115/1.2720521
Fantozzi, F., Colantoni, S., Bartocci, P., and Desideri, U. (2017b). “Rotary kiln slow pyrolysis for syngas and char production from biomass and waste – Part II: Introducing product yields in the energy balance,” Journal of Engineering for Gas Turbines and Power 129(4), 908-913. DOI: 10.1115/1.2720539
ISO/IEC 80079-20-2. (2016). “Explosive atmospheres—Part 20-2: Material characteristics—Combustible dusts test methods,” International Organization for Standardization, Geneva, Switzerland.
ISO 3310-1. (2007). “Test sieves—Technical requirements and testing—Part 1: Test sieves of metal wire cloth,” International Organization for Standardization, Geneva, Switzerland.
ISO 3569 (1995). “Continuous mechanical handling equipment—Classification of unit loads,” International Organization for Standardization, Geneva, Switzerland.
ISO 7708 (1995). “Air quality — Particle size fraction definitions for health-related sampling,” International Organization for Standardization, Geneva, Switzerland.
Krentowski, J. (2015). “Disaster of an industrial hall caused by an explosion of wood dust and fire,” Engineering Failure Analysis (56), 403-411. DOI: 10.1016/j.engfailanal.2014.12.015.
Lowden, L. A., and Hull, T. R. (2013). “Flammability behaviour of wood and a review of the methods for its reduction,” Fire Science Reviews 2(4), 1-19. DOI: 10.1186/2193-0414-2-4
Lyon, R. E., Walters, R. N., and Stoliarov, S. I. (2007). “Thermal analysis of flammability,” Journal of Thermal Analysis and Calorimetry 89, 441-448. DOI: 10.1007/s10973-006-8257-z
Marková, I., Mračková, E., Očkajová, A., and Ladomerský, J. (2016). “Granulometry of selected wood dust species of dust from orbital sanders,” Wood Research 61(6), 983-992.
Marková, I., Ladomerský, J., Hroncová, E., and Mračková, E. (2018). “Thermal parameters of beech wood dust,” BioResources 13(2), 3098-3109. DOI: 10.15376/biores.13.2.3098-3109
Mračková, E., and Tureková, I. (2016). “The dimensional characteristics of the particles of wood dust of selected deciduous trees considering to explosion,” Key Engineering Materials(688), 182-189. DOI: 10.4028/www.scientific.net/KEM.688.182
Mračková, E., Krišťák, Ľ., Kučerka, M., Gaff, M. Gajtanská, M. (2016). “Creation of wood dust during wood processing: Size analysis, dust separation, and occupational health,” BioResources 11(1), 209-222. DOI: 10.15376/biores.11.1.209-222
Očkajová, A., and Banski, A. (2013). “Granulometry of wood abrasive dust from narrow-band grinders,” Acta Facultatis Xylologiae 55(1), 85-90.
Očkajová, A., Stebila, J., Rybakowski, M., Rogozinski, T., Krišták, L., and Ľuptáková, J. (2014). “The granularity of dust particles when sanding wood and wood-based materials,” Advanced Materials Research (1001), 432-437. DOI: 10.4028/www.scientific.net/AMR.1001.432
Očkajová, A., and Marková, I. (2016). “Particular size analysis of selected wood dust species particles generated in the wood working environment,” ACTA Universitatis Matthiae BELII series Environmental Management 18(2), 24-31.
Osvaldová, L. M., Osvald, A., and Kačíková, D. (2014). “Char layer of various tree parts from selected coniferous wood,” Advanced Materials Research (1001), 276-281. DOI: 10.4028/www.scientific.net/AMR.1001.276
Popescu, C. M., Spiridon, I., Tibirna, C. M., and Vasile, C. (2011). “A thermogravimetric study of structural changes of lime wood (Tilia cordata Mill.) induced by exposure to simulated accelerated UV/Vis-light,” Journal of Photochemistry and Photobiology A: Chemistry 217(1), 207-212. DOI: 10.1016/j.jphotochem.2010.10.010
Tabari, H. Z., Rafiee, F., Khademi-eslam, H., and Pourbakhsh, M. (2012). “Thermo-chemical evaluation of wood plastic nanocomposite,” Advanced Materials Research II (463-464), 565-569. DOI: 10.4028/www.scientific.net/AMR.463-464.565
Top, Y., Adanur, H., and Öz, M. (2016). “Comparison of practices related to occupational health and safety in microscale wood-product enterprises,” Safety Science (82), 374-381. DOI: 10.1016/j.ssci.2015.10.014
Tureková, I., Szabova, Z., Kasalova, I., and Chrebet, T. (2013a). “Determination of inductive ignition period and activation energy of food dust,” Advanced Materials Research 750-752, 1860-1863. DOI: 10.4028/www.scientific.net/AMR.750-752.1860
Tureková, I., Turnova, Z., Harangozo, J., Kasalova, I., and Chrebet, T. (2013b). “Determination of ignition temperature of organic dust layers,” Advanced Materials Research 690-693, 469-1472. DOI: 10.4028/www.scientific.net/AMR.690-693.1469
Zachar, M., Mitterová, I., Xu, Q., Majlingová, A., Cong. J, and Galla, Š. (2012). “Determination of fire and burning properties of spruce wood,” Drvna Industrija 63(3), 217-223. DOI: 10.5552/drind.2012.1141
Zajemska, M. (2012). “Analiza teoretyczno-eksperymentalna wpływu współspalania odpadów drzewnych w formie paliw reburningowych z gazem ziemnym na skład chemiczny spalin (Theoretical and experimental analysis of the impact of wood co-combustion, as a reburning fuel, with natural gas on the chemical composition of flue gases),” Drewno 55(188), 71-86.
Article submitted: June 10, 2018; Peer review completed: July 31, 2018; Revised version received and accepted: August 28, 2018; Published: September 7, 2018.
DOI: 10.15376/biores.13.4.8041-8060