
Abstract
Chinese fir (Cunninghamia lanceolata) has great potential as a future bio-energy resource in China. Thermogravimetry (TG) was used to investigate the thermal decomposition process of Chinese fir, including heartwood and sapwood. The Flynn-Wall-Ozawa and Coats-Redfern (modified) methods were used to determine the activation energy. A combination of TG and Fourier transform infrared spectrometry (TG-FTIR) was used to analyze the pyrolysis products. The TG curve indicated that the degradation processes of heartwood and sapwood were similar, but the degradation temperature of heartwood was lower than that of sapwood. The main decomposition occurred within the temperature range of 500 K to 660 K, and over 70% of the mass was degraded. The activation energy of Chinese fir with heartwood and sapwood changed slightly with an increase in conversion rate from 10 to 70. That of heartwood and sapwood was 155.38 to 158.37 KJ/mol and 155.93 to 180.04 KJ/mol, respectively, using the Flynn-Wall-Ozawa method. TG-FTIR analysis showed that the main pyrolysis products included absorbed water (H2O), methane gas (CH4), carbon dioxide (CO2), carbon monoxide (CO), acids and aldehydes, nitrogen dioxide (NO2), nitric oxide (NO), and ammonia gas (NH3). The results from this study are helpful for designing a better bio-energy manufacturing process for Chinese fir via gasification and pyrolysis methods.
Download PDF
Full Article
Thermal Decomposition Characteristics of Chinese Fir
Zhijia Liu,* Zehui Jiang, Benhua Fei, and Xing’e Liu
Chinese fir (Cunninghamia lanceolata) has great potential as a future bio-energy resource in China. Thermogravimetry (TG) was used to investigate the thermal decomposition process of Chinese fir, including heartwood and sapwood. The Flynn-Wall-Ozawa and Coats-Redfern (modified) methods were used to determine the activation energy. A combination of TG and Fourier transform infrared spectrometry (TG-FTIR) was used to analyze the pyrolysis products. The TG curve indicated that the degradation processes of heartwood and sapwood were similar, but the degradation temperature of heartwood was lower than that of sapwood. The main decomposition occurred within the temperature range of 500 K to 660 K, and over 70% of the mass was degraded. The activation energy of Chinese fir with heartwood and sapwood changed slightly with an increase in conversion rate from 10 to 70. That of heartwood and sapwood was 155.38 to 158.37 KJ/mol and 155.93 to 180.04 KJ/mol, respectively, using the Flynn-Wall-Ozawa method. TG-FTIR analysis showed that the main pyrolysis products included absorbed water (H2O), methane gas (CH4), carbon dioxide (CO2), carbon monoxide (CO), acids and aldehydes, nitrogen dioxide (NO2), nitric oxide (NO), and ammonia gas (NH3). The results from this study are helpful for designing a better bio-energy manufacturing process for Chinese fir via gasification and pyrolysis methods.
Keywords: Chinese fir; Thermal decomposition; TG; XRD; TG-FTIR
Contact information: International Centre for Bamboo and Rattan, Beijing, China, 100102;
* Corresponding author: liuzj@icbr.ac.cn
INTRODUCTION
There are several alternative energy sources that can be used as substitutes for fossil fuels in the future, such as hydro, solar, wind, biomass, and ocean thermal energy. Among these energy sources, biomass is the only carbon-based sustainable energy source, and the wide variety of potential raw materials enables it to be utilized by most people around the world (Faizal et al.2010). Forest residues are major fuel sources for potential bio-energy projects in many developing countries (McMullen et al. 2004). Chinese fir is an important forest resource and has been widely cultivated in the south of China. Currently, Chinese fir is abundant and has great potential as a future bio-energy resource. This study on the thermal characteristics of Chinese fir will be very helpful in designing better bio-energy manufacturing processes via thermo-chemical conversion methods such as gasification and pyrolysis.
Thermogravimetry (TG), a thermo analytical technique, is widely used to study the thermal properties of polymers. Travis et al. (2006) studied the thermal behavior and kinetics of biomass-derived materials using TG. Gao and Dai (2006) analyzed the thermal degradation of cellulosic fibers using TG, while Mostashari (2008) investigated the thermal properties of cotton fabrics. Gao et al. (2004) analyzed the thermal decomposition kinetics of natural fibers and activation energy with TG. Bradbury et al. (1979) and Koufopanos et al. (1989) studied a kinetic model for the thermal decom-position of cellulose materials. The most common ‘model-free’ methods include the Friedman method (Friedman 1964), Kissinger method (Kissinger 1956), Flynn-Wall-Ozawa method (Flynn and Wall 1966; Ozawa 1965), Coats-Redfern (modified) method (Brown et al. 2000), and Doyle method (Doyle 1961). Even though these methods are suitable to analyze non-isothermal solid-state kinetic data from TGA, they can be divided into two types: model-fitting and model-free methods. Usually, model-fitting methods are widely used for solid-state reaction due to their ability to directly determine the kinetic parameters from a single TGA measurement. But for non-isothermal data, they suffer from several problems because of their inability to uniquely determine the reaction model (Khawam and Flanagan 2005). Several models can be found as statistically equivalent, whereas the fitted kinetic parameters may differ by an order of magnitude, and therefore selection of an appropriate model can be difficult (Slopiecka et al. 2011). The advantage of the model-free analysis is founded on its simplicity and on the avoidance of errors connected with the choice of a kinetic model (Opfermann et al. 2002). These methods allow estimates of the activation energy, at specific extent of conversion, for an independent model. In this research, the Flynn-Wall-Ozawa and the Coats-Redfern (modified) methods, which respectively belong to model-free and model-fitting methods, were selected to determine the activation energy value.
Chinese fir wood is mainly composed of cellulose, hemicelluloses, and lignin. It is well known that the content of three main components is different for heartwood vs. sapwood of Chinese fir. Furthermore, the inner structure of heartwood and sapwood is also varied. These properties of Chinese fir can be expected to affect its thermal decomposition processes. Despite the fact that previous research is very helpful in understanding the thermal decomposition kinetics of lignocellulosic polymers, informa-tion on the thermal decomposition of Chinese fir is unavailable; therefore, it was investigated using TG in this research. The Flynn-Wall-Ozawa and Coats-Redfern (modified) methods were used to determine the activation energy, and TG-FTIR was used to analyze the pyrolysis products of Chinese fir. The results of this research will provide guidelines for the bio-energy manufacturing process for Chinese fir.
THEORETICAL APPROACH
The fundamental rate equation used in all kinetics studies is generally described as,
dα/dt = kf(α) (1)
where k is the rate constant and f(α) is the reaction model, a function depending on the actual reaction mechanism. Eq. 1 expresses the rate of conversion, dα/dt, at a constant temperature as a function of the reactant conversion loss and rate constant. In this research, the conversion rate (α) is defined as,
α = (w0–wt)/(w0–wf) (2)
where wt, w0, and wf are the weight at time t, the initial weight, and the final weight of the sample, respectively. The rate constant (k) is generally given by the Arrhenius equation,
k = A exp(-Ea/RT) (3)
where Ea is the apparent activation energy (kJ/mol), R is the gas constant (8.314 J/K mol), A is the pre-exponential factor (min-1), and T is the absolute temperature (K). The combination of Eq. 1 and 3 give the following relationship:
dα/dt = A exp(-Ea/RT)f(α) (4)
For a dynamic TGA process, introducing the heating rate, β = dT/dt, to Eq. 4, Eq. 5 can be obtained as:
dα/dT = (A/β)exp(-Ea/RT)f(α) (5)
Equations 4 and 5 are the fundamental expressions of the analytical methods used to calculate kinetic parameters on the basis of TGA data.
MATERIALS AND METHODS
Material
Chinese fir was used in this research. It is well known that the properties of sapwood and heartwood from Chinese fir are different. Therefore, sapwood samples were selected from growth rings 15 to 17, and heartwood samples were selected from growth rings 3 to 6. The initial moisture content of samples was about 8.4%. Prior to the experiment, samples were ground with a Wiley mill. The size of wood particles ranged from 250 to 425 μm.
Next, the wood particles were dried in a drying oven at 105 °C for 8 h. They were replaced and cooled in a desiccator to room temperature, and the mass was measured with a digital balance (0.0001 g resolution). They were returned to the drying oven at 105 °C for 2 h and were weighed. When the mass variance of wood particles was less than 0.2%, the samples were transferred to the desiccator.
Thermal Decomposition
Thermal decomposition was observed in terms of global mass loss using a TA Instrument, TGA Q 500 thermogravimetric analyzer (TA Instrument, USA). Wood particles were evenly and loosely distributed in an open sample pan with an initial sample weight of about 3 to 6 mg. Temperature variation was controlled from room temperature (300 ± 5 K) to 1000 K with heating rates of 10 K/min, 20 K/min, 30 K/min, and 40 K/min, respectively. A high-purity nitrogen stream with a flow rate of 60 mL/min was continuously passed into the furnace before thermal decomposition was carried out to prevent any unwanted oxidative decomposition.
The experimental data were directly obtained through the TGA Q 500 thermogravimetric analyzer and analyzed using Universal Analysis software from TA Instruments and Origin 8.0 software.
X-ray Diffraction (XRD) Analysis
XRD tests were carried out using an X-ray generator (Diffraktometer D5000, Siemens, Germany) with a Co target (λ = 0.1729 nm) at a scanning speed of 3 °/min. The data were recorded every 0.02° (2θ) for the angular range of 2θ = 5 to 45°. The crystallinity index (CrI) and the width of crystals (W) were respectively calculated according to Equations 6 and 7,
CrI = (I002-Iam)/I002 (6)
where I002 is the intensity of the peak at 2θ of about 22° and Iam is the intensity of the baseline at 2θ at about 18°.
W = k×λ/(Bcosθ) (7)
where k is the Scherrer constant (0.9), λ is the wavelength of the X-ray, B is the half-bandwidth in radians, and θ is the Bragg angle.
TG-FTIR Analysis
The experimental setup consisted of a combination of thermogravimetry (TA Instrument, USA) and Fourier transform infrared spectrometry (Bruker IFS 66/S, Bruker Optics, Billerrica, MA). A helium sweep gas flow of 500 mL/min was used to bring the evolved pyrolysis gases from the TGA directly to the gas cell, which was heated to 423 K. The system collected FTIR spectra every 30 s, and the sample temperature and mass were logged every 3 s. The sample pan was placed close to the end of the furnace, where a steeply decreasing temperature profile existed. This, combined with the high gas flow, minimized the residence time of the evolved gases in the hot zone. In this work, the sample’s mass was about 20 mg, and it was heated from 323 K to 823 K at a heating rate of 10 K/min.
RESULTS AND DISCUSSION
Overall Thermal Decomposition Process of Chinese Fir
Figure 1 presents the thermal decomposition process of Chinese fir heartwood and sapwood at a heating rate of 10 K/min. The thermal decomposition process of Chinese fir included three steps. The initial temperature of every step is defined as a critical point of weight loss for the sample in the TG curve. The initial temperature of thermal decomposition for the next step is the same as the final temperature for the previous step. In the third step, the final temperature is defined as the critical point, where the sample weight does not change (Jiang et al. 2012).
In the first step, the degradation temperature was 300 K to 480 K and the weight loss was about 2.30% for heartwood. For sapwood, the degradation temperature was 300 K to 490 K and weight loss was about 2.41%. The removal of absorbed moisture from samples was responsible for this weight loss. In the second step, the degradation temperature was 480 K to 650 K and weight loss was about 70.70% for heartwood; the degradation temperature was 490 K to 660 K and weight loss was about 70.82% for sapwood. The degradation of cellulose, hemicelluloses, and partial lignin from Chinese fir occurred in this step. In the third step, the degradation temperature was from 650 K to 900 K and weight loss was about 8.73% for heartwood. For sapwood, the degradation temperature was 660 K to 920 K and weight loss was about 10.43%. The degradation of lignin residues from the second step or tar and char from the main components resulted in weight loss of the sample during this stage.
The thermal decomposition parameters of Chinese fir from TG are shown in Table 1. It was found that the degradation processes of Chinese fir heartwood and sapwood were similar, but the degradation temperature of heartwood was lower than that of sapwood. This phenomenon could be attributed to differences in the content and structure of heartwood and sapwood. Qin et al. (2004) found that the cellulose and lignin contents of Chinese fir heartwood were lower than that of sapwood. Among hemicel-luloses, cellulose, and lignin, lignin has the highest degradation temperature, while hemicelluloses have the lowest. Therefore, the higher the cellulose and lignin contents, the more difficult thermal degradation is. The structural differences between heartwood and sapwood were tested by XRD in this research. Figure 2 presents the XRD curve of Chinese fir heartwood and sapwood samples. The degree and width of crystallinity can be calculated based on Eqs. 6 and 7. The degree and width of crystallinity of heartwood were 32.31% and 2.66 nm, respectively. Those of sapwood were 40.41% and 2.97 nm, respectively. It is well known that the cellulose of biomass material degrades from the amorphous region to the crystalline region (Yao et al. 2008), which indicates that the degradation temperature of the crystalline region is higher than that of the amorphous region. The increase of the degree and width of crystallinity of cellulose therefore made degradation more difficult.
Table 1. Thermal Decomposition Parameters of Chinese Fir from TG

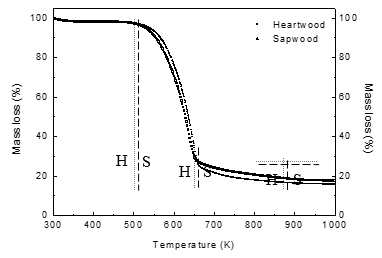
Fig. 1. Thermal decomposition of Chinese fir heartwood (H) and sapwood (S) at a heating rate of 10 K/min
Table 2. Index and Width of Crystallinity for Heartwood and Sapwood of Chinese Fir


Fig. 2. XRD curve of Chinese fir heartwood and sapwood samples
Activation Energy of Chinese Fir
The Flynn-Wall-Ozawa and Coats-Redfern (modified) methods were also used to determine the activation energy in this research. The Flynn-Wall-Ozawa method is an integral method that determines –Ea/R from the slope of the line given by plotting log(β) against 1/T at any conversion rate. The modified Coats-Redfern method is a multi-heating rate application of the Coats-Redfern equation. Plotting the left hand side for each heating rate versus 1/T at that heating rate gives a family of straight lines of slope –Ea/R. The full solution is performed iteratively by first assuming a value for activation energy and then recalculating the left-hand side until convergence occurs. Here, a quick solution, however, is also available by moving (1 to 2RT/Ea) into the intercept and assuming that it is a constant (Yao et al. 2008). Both methods are shown in Table 3.
Table 3. Flynn-Wall-Ozawa and Coats-Redfern (Modified) Model-free Method

The typical Flynn-Wall-Ozawa plots (Fig. 3) and Coats-Redfern (modified) plots (Fig. 4) for Chinese fir heartwood showed a similar trend for activation energy. The typical Flynn-Wall-Ozawa and Coats-Redfern (modified) plots of Chinese fir sapwood are not shown because they are very similar to that of heartwood. Figures 3 and 4 show that the fitted lines were nearly parallel with a conversion rate increase from 10 to 70, which indicated approximate activation energy at different conversions. This also implied the possibility of a single reaction mechanism. Table 4 summarizes the activation energy of Chinese fir calculated with conversion rate increase from 10 to 70 using the Flynn-Wall-Ozawa and Coats-Redfern (modified) methods. The activation energy of heartwood were 155.38 to 158.37 KJ/mol with conversion rate increase 10 to 70 for Flynn-Wall-Ozawa method. Similar results using the Coats-Redfern (modified) method also confirmed this observation, where the activation energy were 153.40 to 155.71 KJ/mol. The activation energy of sapwood were 155.93 to 180.04 KJ/mol at conversion rate of 10 to 70 using the Flynn-Wall-Ozawa method, while they were 153.88 to 179.96 KJ/mol using the Coats-Redfern (modified) method. It was found that the activation energy of sapwood at conversion rate of 10 is obviously higher that of other conversion rate for both methods. The heartwood with more extract content may be attributed to this phenomenon. It is well known that wood extracts are small molecular substances, and they are easier to thermally decompose than other components. Heartwood, however, needed less activation energy to degrade these extracts at conversion rate of 10. The variance between the activation energy of Chinese fir heartwood and sapwood was very slight with an increase in the conversion rate. The average activation energy of heartwood and sapwood was 157.39 KJ/mol and 161.99 KJ/mol for using the Flynn-Wall-Ozawa methods, respectively. For the Coats-Redfern (modified) method, the average activation energy of heartwood and sapwood was 155.02 KJ/mol and 160.00 KJ/mol, respectively.

Fig. 3. The typical Flynn-Wall-Ozawa plot of Chinese fir heartwood

Fig. 4. The typical Coats-Redfern (modified) plot of Chinese fir heartwood
Table 4. Activation Energy of Chinese Fir Determined by Flynn-Wall-Ozawa and Coats-Redfern (Modified) Methods

Pyrolysis Products of Chinese Fir
In this experiment, approximately 20-mg samples were heated at 323 K for 4 min, and then to 823 K at a heating rate of 10 K/min. When the temperature reached 823 K and was steady for 4 min, the samples were immediately cooled to 323 K. The typical absorbance peaks of the pyrolysis products of Chinese fir heartwood and sapwood are shown in Figs. 5 and 6, respectively.

Fig. 5 The absorbance spectra stack plot of Chinese fir heartwood at a heating rate of 10 K/min
It is clear that the absorbance peaks of Chinese fir heartwood and sapwood were similar. This indicated that the main pyrolysis products were the same. Some pyrolysis gases could be evolved at the same temperature, which led to more difficulty determining the absorbance peak of small gas quantities. The typical absorbance peaks and pyrolysis products of Chinese fir are shown in Table 5 and are as follows: the absorbance at 3429 cm-1 was O-H stretching vibration and the pyrolysis product was mainly absorbed water (H2O), the absorbance at 2916 cm-1 was C-H stretching vibration and the pyrolysis product was methane gas (CH4), and the pyrolysis product of the absorbances at 2245 cm-1 and 645 cm-1 was carbon dioxide (CO2). The absorbance at 1710 cm-1 was C=O stretching vibration in hemicelluloses, and the absorbance at 1615 cm-1 was C=C stretching vibration in lignin, which probably came from the pyrolysis products of acids and aldehydes. The absorbances at 1500 cm-1 and 1378 cm-1 appeared when nitrogen dioxide (NO2) was released, and the absorbance at 860 cm-1 expressed ammonia gas (NH3). This information is very useful and significant to the design of the bio-energy manufacturing process.

Fig. 6. The absorbance spectra stack plot of Chinese fir sapwood at a heating rate of 10 K/min
Table 5. Typical Absorbance Peaks and Pyrolysis Products of Chinese fir

CONCLUSIONS
- The degradation processes of Chinese fir heartwood and sapwood were found to be similar, but the degradation temperature of heartwood was lower than that of sapwood, due to differences in content and structure. The main decomposition occurred in the temperature range of 500 K to 660 K, and over 70% of the mass was degraded. The main degradation compositions were cellulose, hemicelluloses, and partial lignin from Chinese fir.
- The differences in activation energy between heartwood and sapwood were slight with an increase in conversion rates from 10 to 70. The activation energy of heartwood and sapwood were 155.38 to 158.37 KJ/mol and 155.93 to 180.04 KJ/mol, respectively, using the Flynn-Wall-Ozawa method. Similar results using the Coats-Redfern (modified) method were also found. The activation energy of heartwood and sapwood were 153.40 to 155.71 KJ/mol and 153.88 to 179.96 KJ/mol, respectively.
- The main pyrolysis products included absorbed water (H2O), methane gas (CH4), carbon dioxide (CO2), carbon monoxide (CO), acids and aldehydes, nitrogen dioxide (NO2), nitric oxide (NO), and ammonia gas (NH3).
ACKNOWLEDGEMENTS
This research was financially supported by the 12th Five Year Plan- Study on Manufacturing Technology of Functional Bamboo (Rattan)-based Materials (grant No. 2012BAD54G01) and Basic Scientific Research Funds of the International Centre for Bamboo and Rattan (grant No. 1632012002).
REFERENCES
Bradbury, A. W., Sakai, Y., and Shafizadeh, F. (1979). “A kinetic model for pyrolysis of cellulose,” Journal of Applied Polymer Science 23(11), 3271-3280.
Brown, M. E., Maciejewski, M., Vyazovkin, S., Nomen, R., Sempere, J., and Burnham, A. (2000). “Computational aspects of kinetic analysis. Part A: The ICTAC kinetics project-data, methods and results,” Thermochim. Acta 355(1-2), 125-143.
Doyle, C. D. (1961). “Kinetic analysis of thermogravimetric data,” Journal of Applied Polymer Science 5(15), 285-292.
Faizal, H. M., Latiff, Z. A., Wahid, M. A., and Darus, A. N. (2010). “Physical and combustion characteristics of biomass residues from palm oil mills,” New Aspects of Fluid Mechanics, Heat Transfer and Environment: Proceedings of the 8th International Conference on Heat Transfer, Thermal Engineering and Environment, August 20-22, Taipei, Taiwan, 34-38.
Flynn, J. H., and Wall, L. A. (1966). “General treatment of thermogravimetry of polymers,” Journal Research Nat. Bur. Stand. Sect. A- Physics and Chemistry 70A(6), 487-523.
Friedman, H. L. (1964). “Kinetics of thermal degradation of char-forming plastics from thermogravimetry. Application to phenolic plastic,” Journal Polymer Science Part C- Polymer Symposia 6(1), 183-195.
Gao, M., and Dai, Q. J. (2006). “Studies on thermal degradation of cellulosic fibers treated with flame retardants,” Journal of Process Engineering 6(2), 244-249.
Gao, M., Zhu, K., and Sun, C. Y. (2004). “Thermal degradation of wood treated with amino resins and amino resins modified with phosphate in nitrogen,” Journal of Fire Science 22(6), 505-515.
Jiang, Z. H., Liu, Z. J., Fei, B. H., Cai, Z. Y., Yu, Y., and Liu, X. E. (2012). “The pyrolysis characteristics of moso bamboo,” Journal of Analytical and Applied Pyrolysis 94, 48-52.
Koufopanos, C. A., Maschio, G., and Lucchesi, A. (1989). “Kinetic modeling of the pyrolysis of biomass and biomass components,” Canadian Journal of Chemical Engineering 67(1), 75-84.
Khawam, A., and Flanagan D.R. (2005). “Complementary use of model-free and modelistic methods in the analysis of solid-state kinetics,” The Journal of Physical Chemistry B. 109(20), 10073-10080.
Kissinger, H. E. (1956). “Variation of peak temperature with heating rate in differential thermal analysis,” Journal Research Nat. Bur. Stand. 57(4), 217-221.
McMullen, J., Fasina, O., Wood, W., Feng, Y., and Mills, G. (2004). “Physical characteristics of pellets from poultry litter,” ASABE Paper No. 046005, American Society of Agricultural and Biological Engineers, St. Joseph, MI.
Mostashari, S. M., and Mostashari, S. Z. (2008). “Combustion pathway of cotton fabrics treated by ammonium sulfate as a flame-retardant studied by TG,” Journal of Thermal Analysis and Calorimetry 91(2), 437-441.
Opfermann, J. R., Kaisersberger, E., Flammersheim, H. J. (2002). “Model-free analysis of thermoanalytical data-advantages and limitations,” Thermochimica Acta (391)1-2, 119-127.
Ozawa, T. (1965). “A new method of analyzing thermogravimetric data,” Bulletin of the Chemical Society of Japan 38(11), 1881-1887.
Qin, T. F., Huang, L. H., and Zhou, Q. (2004). “Studies on longitudinal variation of main chemical compositions of Chinese fir and poplar I-72/58 tree,” Forest Research 17(1), 47-53.
Slopiecka, K., Bartocci, P., and Fantozzi, F. (2011). “Thermogravimetric analysis and Kinetic study of poplar wood pyrolysis,” Third International Conference on Applied Energy, 1687-1698.
Yao, F., Wu, Q. L., Lei, Y., Guo, W. H., and Xu, Y. J. (2008). “Thermal decomposition kinetics of natural fibers: Activation energy with dynamic thermogravimetric analysis,” Polymer Degradation and Stability 93(1), 90-98.
Article submitted: June 3, 2013; Peer review completed: August 5, 2013; Revised version received and accepted: August 6, 2013; Published: August 12, 2013.