
Abstract
A Hot Disk thermal constant analyzer was used to obtain the thermal parameters of composite boards, solid wood floor, and ceramic tiles (CT). FLUENT software was used for the model establishment and the temperature field simulation, and the effects caused by different surface materials were analyzed. A 2D unsteady model was constructed to analyze floor surface temperature and indoor temperature fields in an enclosure space. Comparison of temperature fields caused by different materials showed that both steady indoor temperature and surface temperature of CT were the highest, which is due to its good thermal properties. Thermal conductivity and thermal capacity are the two main factors affecting floor thermal performance in the initial hours, while thermal conductivity is the key factor in the steady period. For the compared floor materials, CT and Sindora glabra (SG) are the optimal choices from the perspective of thermal performance, while composite boards are almost the same in thermal performance.
Download PDF
Full Article
Thermal Properties of Radiant Floor Surface Materials and Numerical Evaluation of the Thermal Performance
Shiyu Zhou,a,* Jiaqi Cao,a Zhili Zhang,b,c HaiboWang,a and Jiying Liu a
A Hot Disk thermal constant analyzer was used to obtain the thermal parameters of composite boards, solid wood floor, and ceramic tiles (CT). FLUENT software was used for the model establishment and the temperature field simulation, and the effects caused by different surface materials were analyzed. A 2D unsteady model was constructed to analyze floor surface temperature and indoor temperature fields in an enclosure space. Comparison of temperature fields caused by different materials showed that both steady indoor temperature and surface temperature of CT were the highest, which is due to its good thermal properties. Thermal conductivity and thermal capacity are the two main factors affecting floor thermal performance in the initial hours, while thermal conductivity is the key factor in the steady period. For the compared floor materials, CT and Sindora glabra (SG) are the optimal choices from the perspective of thermal performance, while composite boards are almost the same in thermal performance.
DOI: 10.15376/biores.18.2.3909-3922
Keywords: Radiant heating; Wood floor; Thermal performance; Temperature
Contact information: a: School of Thermal Engineering, Shandong Jianzhu University, Jinan 250101, China; b: 801 Institute of Hydrogeology and Engineering Geology, Shandong Provincial Bureau of Geology & Mineral Resources, Jinan 250013, China; c: Shandong Engineering Research Center for Environmental Protection and Remediation on Groundwater, Jinan 250014, China;
* Corresponding author: zhou-1sy@163.com
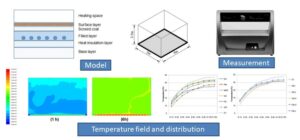
GRAPHICAL ABSTRACT
INTRODUCTION
In China, building operations comprise 21.2% of the total energy consumption (2021). Air conditioning and heating systems consume the maximum energy amount in buildings. With the improvement of living standards, more and more heating systems have been developed for residents. Radiant floor heating system (RFHS) is one of them. In a RFHS, radiant heat transfer covers more than 50% of the amount of heat exchange with a conditioned space (ASHRAE 2016). Compared with fan coil or conventional radiator, RFHS has many advanced properties such as more thermal comfort and higher efficiency (Rahimi and Sabernaeemi 2021).
There have been several studies comparing different RFHS terminal forms. Atienza Márquez et al. (2017) evaluated the performance of a combined system in terms of energy consumption and comfort level. Some new design ideas have emerged; for example, Shin et al. (2015) proposed a design principle that was based on the floor surface temperature by studying the correlation between heat flux and design parameters such as the type of floor covering, the pipe spacing, and heating water temperature. Wang et al. (2014) investigated the effect of the design parameters on the floor heat storage and heat release processes. These parameters include pipe spacing, filling layer thickness, and supplying water temperature. The pipe spacing has the dominant effect on the preheating period, while the filling layer thickness plays a more important role during the heat release period. Zhang et al. (2013) analyzed the operating characteristics of a lightweight RFHS system for which the pipes are placed in aluminum foil instead of a concrete layer. They also studied the effects of design parameters on the performance of the floor heating system. Zhou and He (2015) compared the performance of the RFHS system with different heat storage materials (sand and PCM-phase change material) and heating pipes (PE coils and capillary mat). The discharging time for PCM was nearly twice as long as for sand to keep the indoor temperature in comfortable range. When capillary mat was used for heating pipes in the floor, the heat release rate was higher than that for PE coils during the charging process. Ren et al. (2010) proposed a new type of radiant end system with even lower supply temperature compared with the conventional RFHS. In their new system, the supply and return flow temperatures of the circulating water are 35 °C/25 °C for heating and 20 °C/10 °C for cooling. The performance of RFHS in the large space buildings has been studied by Zhao et al. (2014) in an airport terminal. They demonstrated that indoor thermal comfort was improved by RFHS compared with the jet ventilation system adopted in the other terminals in both cooling and heating modes. Compared with the conventional heating system, the supplying water temperature of RFHS was reduced to about 45 °C or even lower.
Most of the studies of RFHS concentrate on the system optimization based on the design parameters. The current research studied thermal performance of different filled materials, but few relevant studies are about surface material. As the boundary between heating source and indoor air, surface material has significant influence on the indoor thermal environment. Yi et al. (2017) studied the thermal properties of different floor materials including wood-plastic composites (WPCs), solid wood, and ceramic tile. By measuring floor surface temperature variations caused by heating system operation, correlating with human feeling evaluations, a composite floor structure of combining WPCs and solid wood were recommended. To promote thermal performance of wood floor material, Seo et al. (2012) proposed a method of stirring exfoliated graphite nanoplatelets (xGnP) in the epoxy resin with hardener and polyurethane (PU) resin, and then validated its effectiveness through measurements.
With the development of phase change materials (PCM), the recent research about radiant heating flooring concentrates on the study of PCM, including the thermal energy storage performance of different PCMs by means of experimental or simulation (Larwa et al. 2021; González and Prieto 2021; Babaharra et al. 2022; Jiang et al. 2022; Jin et al. 2022; Nair et al. 2022; Xuet al. 2022). However, few studies dealing with traditional floor materials such as wooden materials or ceramic tiles have emerged in recent years. Since these common materials have been widely applied in human indoor decoration, they should be further studied, especially wooden materials because of its anisotropic properties. Seo et al.(2011) measured thermal conductivity and transfer performance of 21 replicates of wood flooring materials generally used in Korea. They found that the heating performance not only depends on the material structure but also affected by its installation method. Bishara et al.(2017) performed numerical analysis towards the first panel prototypes of the wooden floor for evaluating design parameters. They also performed comprehensive measurements in a climate chamber to study the hydrothermal transport processes within the wooden panel.
In China, the most common used surface materials of the indoor floor are ceramic tile, composite plane, and wooden floor. To compare the heat release performance of different flooring materials, and also to study the influence of different surface materials to the room heating effect, the paper conducts a study about the comparison among these commonly used surface materials by simulating their effect on the indoor thermal environment. Previously, Cao et al. (2022) measured thermal properties of 65 kinds of wood species, including thermal conductivity, specific heat capacity, and surface emissivity. Based on these measured values, they constructed wood classification models using an artificial neural network. As an extension of the previous measurement work, the study used simulation, meaning that the simulation conditions are supposed to be ideal.
EXPERIMENTAL
The structural layer of a radiant floor heating system (RFHS) usually adopts concrete embedded with pipes; the water pipes are buried in the concrete layer or cement slurry layer within the upper part of the floor. The structure is shown in Fig. 1. The layers laid from top to bottom are surface layer, screed coat, filled layer, heat insulation layer, and base layer. A water proof layer is needed in some situations but is not depicted in the figure.

Fig. 1. Diagram of the floor structure
Model description
A model cuboid enclosure space is constructed with size of 4 m × 3 m × 2.5 m (length × width × height), which is a common bedroom size in China.


Fig. 2. Physical model of the space Fig. 3. Cross-section of the RFHS
There is less activity in the bedroom, meaning that its temperature field is more stable. In this study, the space is empty. The heating pipe is arranged as shown in Fig. 2. The model parameters are shown in Table 1.
Table 1. Parameters of the Room and RFHS

Considering the importance of the floor structure, its model should be constructed in detail according to Fig. 2. The designed model of the RFHS is shown in Fig. 3 with some simplifications, while its parameters are shown in Table 1. In Fig. 3, heat insulation layer and base layer are not listed and constructed in the model for the reason that the bottom of filled layer is defined as adiabatic condition.
In the Table, 1) PE-RT means polyethylene of raised temperature resistance. 2) Buried depth is the distance from the pipe center to the floor surface. 3) Stipulation from the standard code: ‘the water supply temperature of civil buildings should be 35~50 degrees, not more than 60 degrees, and the temperature difference between supply and return water should be less than or equal to 10 degrees ‘. 4) Only surface material is changed, while the other layer materials are kept constant in the simulation work.
Hypothesis conditions
To simplify the simulation process, the following hypothesis conditions are defined:
- The whole heat transfer process is kept as an unsteady state;
- The heat transfers along the horizontal direction with a very small temperature gradient which can be ignored. Therefore, the heat transfer process in the floor can be deemed as a 2D process;
- The deviation between each layer in Fig. 1 is for display purposes. Actually, each layer is in close contact without thermal resistance, as shown in Fig.3;
- All materials are homogeneous substances whose physical properties are kept constant;
- Heat insulation effect of the adiabatic layer is good enough without down-flowing heat;
Measurement of the Thermal Data
The thermal parameters of floor materials for simulation were determined with a thermal constant analyzer (TPS2200, Hot Disk, Gothenburg, Sweden), as shown in Fig. 4(a). The analyzer can measure volume specific heat, thermal conductivity, and thermal diffusion coefficient of different materials. Figure 4(b) is the component for testing volume specific heat, which is called golden vessel. There is a mathematical relationship between thermal conductivity and thermal diffusion coefficient, so the two parameters can be measured with the same probe, as shown in Fig. 4(c). The test principle is based on Transient Plane Source Method, which is an accepted and popular method for testing thermal properties (He 2005).

Fig. 4. Experimental apparatus.(a) Thermal constant analyzer (TPS2200); (b) Golden vessel; (c) Polyimide coated probe
Five different kinds of wooden composite board and six different kinds of solid wood, together with a piece of ceramic tile were tested. Hot-disk thermal analyzer was used for the measurement work. Next, Fluent software was used for the simulation work based on these measured data. Firstly, the specimens need to be processed to be suitable for the measurement. The processing tool and specimen are shown in Fig. 5, and the testing process is shown in Figs. 6 and 7. The measure results are listed in Table 2.

Fig. 5. The processing tool and the processed specimens (a) processing tool; (b) processed specimens

Fig. 6. Heat capacity measurement

Fig. 7. Thermal conductivity measurement
Table 2. Measured Data of the Specimens

Note: These parameters are tested for the reason that they are main factors affecting heat performance of the flooring surface; CB represents composite board, while the abbreviations of other boards are listed in the brackets.
Considering the construction manner of wood floor, axial thermal conductivity values would be adopted for the simulation work in the following text.
Model Construction and Parameter Settings
Simulation model
Considering the symmetry, to simplify the computation model, a 2D model of the cross section (4m×2.5m) was constructed. In the 2D model, the wall temperature of the heating pipe was set as the average temperature of the supply and backwater temperature, i.e., 45 ℃. Because the computational model was a simple 2D model, and the computation was not time-consuming, the study was conducted without mesh sensitivity tests. The mesh division could be fine enough. There was a total 173265 grids in the whole space model. The study was conducted by taking a northern city in China, e.g. Jinan, for example. According to the practical situation, indoor initial temperature was set as 5 °C. The detailed parameters of the model were defined according to Table 1.
Mathematical description
FLUENT software was used for the simulation work. The description of the flow and heat transfer in the enclosure space with conservation equations of mass, momentum, and energy are shown as follows:
 (1)
(1)
 (2)
(2)
 (3)
(3)
 (4)
(4)
where u, v are velocities in x, y directions, respectively, t is time, μ is viscosity of air, P is air pressure, T is air temperature, ρ is air density, and g is acceleration of gravity.
The energy equation of the flooring is as follows,
 (5)
(5)
where, T is the temperature of the flooring, λ is the axial thermal conductivity of the floor material, ρ is the density of the floor material, and Cp is the thermal capacity.
Boundary conditions
The floor surface condition of the enclosure space was set as a mixed condition including convection and radiation. According to the previous study (Zhang et al.2011), convection coefficient was set as h = 8 W/(m2·K), external emissivity was set as 0.91, and internal emissivity was set as 1. Considering the actual boundary conditions, the roof and sidewalls were also set as mixed heat-exchange conditions. In which, air temperature on the roof was set as 27 °C, while that of sidewalls were set as 5 °C. It is worth noting that the setting of heat transfer conditions may not coincide with the actual changing boundary conditions, but the simulation results could also reflect the relative relationships of the heating performance of different floor boards.
RESULTS AND DISCUSSION
Indoor Temperature Field Analysis
The temperature fields of the enclosure space caused by floor material of CB-I at different hours are displayed in Fig. 8. It is hard to distinguish the difference of the temperature distribution among different floor materials from the figure. It is necessary to define a feature value for evaluating floor thermal performance.
Three vertical lines at different locations are defined as x-1, x-2 and x-3, respectively, which are shown in Fig. 9. Temperature distributions of the three vertical lines for CB-I are shown in Fig. 10. The left figure is that of 1 h and the right figure is that of 6h. The temperature distributions of the three lines in the initial hours are almost the same, while the difference emerges with time elapses. Because of the heat-convection effect, temperature at x-2 is the lowest compared with that of the other two lines, which is opposite to the distribution that only considering heat- conduction process.

Fig. 8. Temperature fields of the space with CB-I at different hours(K)

Fig. 9. Location descriptions of the three vertical lines

Fig. 10. Temperature distributions of the three vertical lines at 1 h and 6h for CB-I
For further comparison, the temperatures of the three lines are averaged as mean values corresponding to the vertical coordinates. The average temperature variations with time are shown in Fig. 11 as an example. In the figure, D-1hmeans data at 1 hour after simulation begins. It can be seen that the temperature distributions at the initial hours vary greatly, while the temperature field tends to be steady after 9h. The temperature difference between 9h and 15 h is small enough. Therefore, the temperature distribution at 15 h could be deemed as the final steady temperature field.

Fig. 11. The average temperature variations with time for CB-I and DO (listed for example)

Fig. 12. The average temperature distributions of different boards at 1 h and 15 h
To analyze the heating performance of different boards, the mean temperature distribution lines of different boards at 1 h and 15 h are listed in Fig. 12. It can be seen that the temperature distributions at 1 h is evidently different from that at 15 h. The temperature distributions at 15 h are more uniform in the vertical direction, while data at 1 h present a ‘C’ form, i.e., temperature of the subaerial and subroofing is higher than that of the middle height. The reason for this distribution is that the heat is produced under the heating floor, and also the heat concentrates below the ceiling due to the buoyancy of the hot air.
The temperature change rates of boards are different. To compare temperature variations along with time among different boards, a mean value of the averaged temperature line depicted in the former sections is defined to represent the mean room temperature. The time-variations of this temperature caused by different boards are shown in the following figures. Temperature variation of CT is shown in the two figures for the reason of its specificity. It can be deemed as a comparison benchmark.


Fig. 13. Time-variations of the mean room temperature caused by different boards
Figure 13 shows that indoor temperature tends to be stable after 9 hours with little fluctuations. Therefore, indoor temperature at 15 h can be deemed as the final value (operative temperature) for comparison. Because the indoor temperature is mainly affected by the outdoor heat transfer conditions, its value may not conform to the recommended range from the standard (JGJ 142-2016). But their relative relationships displayed in Fig. 13 could also reflect the heating performance of different boards.
The initial temperature for each board is the same value, while the difference began to emerge after 1 h. The relative relationship among temperature values of these boards may be changed in the whole process. For example, the indoor temperature of CT in the former several hours is not the highest, but its final stable temperature is the highest. Similarly, the indoor temperature of PS in the former several hours is not the lowest, but its final stable temperature is the lowest. The indoor temperature variation trend of PM is opposite to that of PS, which is caused by their thermal capacity difference. Temperature variations of different solid wood boards are different, while those of composite boards are closer to each other.
Floor surface temperature analysis
Because the indoor thermal environment (temperature distribution in space) is mainly affected by the flooring surface temperature, it is necessary to analyze this temperature of different floor materials. The average flooring surface temperature is usually used for the evaluating work in China standard code (JGJ 142-2016). In order to ensure the human body comfort, the average floor temperature should meet the requirements listed in Table 3. The data listed in the table are derived from <Technical specification for radiant heating and cooling (JGJ 142-2016)>, which is a standard specification of China.
Table 3. Suggested Value of the Floor Surface Temperature (JGJ 142-2016)

Figure 14 shows the floor surface average temperature variations along with time. The variation of the boards is consistent with the indoor temperature variations in Fig. 13. Therefore, the proportional relationship between the floor temperature and the indoor temperature can be verified. When the indoor temperature field comes to steady, the average surface temperature (data of 15 h) is extracted and listed in Table 4.


Fig. 14. The floor average surface temperature variations along with time
Table 4. Average Surface Temperature for the Whole Space Model with Different Floor Materials

Generally, the surface temperature of the composite boards is higher than that of solid wood. The surface temperature of ceramic tile is the highest, which is caused by its good thermal conductivity. Because of the ideal conditions of the simulation work, the floor surface temperature obtained from the simulation mostly exceeds the upper limit of the comfortable range (32 °C) recommended by the code (JGJ 142-2016). They can also reflect the objective performance difference among different floor surface materials.
To analyze the simulated temperature variations, three key thermal parameters are picked up for comparison, as shown in Fig. 15. The comparison is conducted to analyze the relationship between thermal properties and temperature field. Because only the heat conduction in the vertical direction of the floor is considered in the simulation, the axial values of thermal conductivity and thermal diffusivity are listed in the figure.
It can be found that thermal conductivity of CT is the highest, but its indoor temperature increase is not the fastest in the initial period. This is caused by its higher thermal capacity, meaning that CT’s heat storage performance is better than that of other studied materials. Indoor temperature variation of SG is the fastest among the solid wood boards because of its high thermal conductivity. However, thermal comfort is an important heating target other than high temperature. For the people that prefer higher indoor temperature in winter, CT would be the optimal choice. If solid wood is preferred together with higher indoor temperature, SG should be selected. For the composite boards, their thermal performances are almost the same without obvious difference, which is caused by their similar thermal properties.

Fig. 15. Comparison among thermal properties of the studied boards
CONCLUSIONS
- Density, specific heat capacity, thermal conductivity, and thermal diffusivity in axial and radial directions were measured. The measured thermal property values of CT are found to be comparatively higher, especially thermal conductivity. Thermal properties of composite boards are almost the same, which are inferior to that of CT. Thermal properties of solid woods are quite different, meaning that their thermal performance would be uneven.
- A 2D unsteady model was constructed and indoor temperature fields were acquired by simulation. Indoor temperature tends to be steady at 9 hours after simulation starts, and the temperature increasing rates are different for each board because of the difference of thermal property. The final stable temperature is used for comparison and analysis. Comparison between PM and PS reflects the fact that the temperature variation is not only determined by thermal conductivity but also affected by thermal capacity, and thermal capacity is the main factor affecting the temperature increasing rate in the initial period.
- The relationship between floor surface temperature and thermal properties of floor was analyzed. In the whole, the floor surface temperature variation trends are almost the same as that of indoor air temperature. For the studied floor materials, CT and SG would be the optimal choices from the perspective of thermal performance, while composite boards are almost the same in thermal performance.
ACKNOWLEDGMENTS
This work acknowledges the Plan of Introduction and Cultivation for Young Innovative Talents in Colleges and Universities of Shandong Province.
REFERENCES CITED
American Society of Heating, Refrigerating, and Air Conditioning Engineers (ASHRAE) (2016).ASHRAE Handbook-HVAC Systems and Equipment, Atlanta,GA, USA.
Babaharra, O., Choukairy, K., Hamdaoui, S., Khallaki, K., and Mounir, S. (2022).“Thermal behavior evaluation of a radiant floor heating system incorporates a microencapsulated phase change material,” Construction and Building Materials 330, article 127293. DOI: 10.1016/j.conbuildmat.2022.127293
Bishara, N., Schulz, T., Gecks, J., Plagge, R., and Wehsener, J. (2017). “Thermal optimization and performance analysis of an innovative wooden radiant heating system made for room temperature control—Laboratory and numerical investigation of prototypes,” Energy and Buildings138, 569-578. DOI: 10.1016/j.enbuild.2016.12.091
Cao, S., Zhou, S., Liu, J., Liu, X., and Zhou, Y. (2022). “Wood classification study based on thermal physical parameters with intelligent method of artificial neural networks,” BioResources 17, 1187-1204. DOI: 10.15376/biores.17.1.1187-1204
China Association of Building Energy Efficiency. (2021). “China Building Energy Consumption and Carbon Emission Research Report,”Chongqing University.
González, B., and Prieto, M. (2021). “Radiant heating floors with PCM bands for thermal energy storage: A numerical analysis,” International Journal of Thermal Science162, article 106803. DOI: 10.1016/j.ijthermalsci.2020.106803
He, Y. (2005). “Rapid thermal conductivity measurement with a hot disk sensor,” Thermochimica Acta 436(1), 122-129. DOI: 10.1016/j.tca.2005.06.026
Jiang, T., Zheng, C., You, S., Zhang, H., Wu, Z., Wang, Y., and Wei, S. (2022).“Experimental and numerical study on the heat transfer performance of the radiant floor heating condenser with composite phase change material,” Applied Thermal Engineering 213, article 118749. DOI: 10.1016/j.applthermaleng.2022.118749
Jin, X., Yang, J., Li, M., Huang, G., and Lai, A. (2022).“Experimental and numerical study on the thermal energy storage performance of a novel phase-change material for radiant floor heating systems,” Building and Environment 223, article 109491. DOI: 10.1016/j.buildenv.2022.109491
Larwa, B., Cesari, S., and Bottarelli, M. (2021) “Study on thermal performance of a PCM enhanced hydronic radiant floor heating system,” Energy225, article 120245. DOI: 10.1016/j.energy.2021.120245
Márquez, A.A., López, J.M.C., Hernández, F.F., Muñoz, F.D., and Andrés, A.C. (2017). “A comparison of heating terminal units: Fan-coil versus radiant floor, and the combination of both,” Energy & Buildings138, 621-629. DOI: 10.1016/j.enbuild.2016.12.092
Ministry of Housing and Urban-Rural Development of the People’s Republic of China, Technical specification for radiant heating and cooling (JGJ 142-2016).
Nair, A., Wilson, C., Huang, M., Griffiths, P., and Hewitt, N. (2022).“Phase change materials in building integrated space heating and domestic hot water applications: A review,” Journal of Energy Storage54, article 105227. DOI: 10.1016/j.est.2022.105227
Rahimi, M., andSabernaeemi, A. (2011). “Experimental study of radiation and free convection in an enclosure with under-floor heating system,” Energy Conversion and Management 52(7), 2752-2757. DOI: 10.1016/j.enconman.2011.02.020
Ren, J., Zhu, L., Wang, Y., Wang, C., and Xiong, W.(2010). “Very low temperature radiant heating/cooling indoor end system for efficient use of renewable energies,” Solar Energy84(6), 1072-1083. DOI: 10.1016/j.solener.2010.03.015
Seo, J., Jeon, J., Lee, J., and Kim, S. (2011). “Thermal performance analysis according to wood flooring structure for energy conservation in radiant floor heating systems,” Energy and Buildings 43, 2039-2042. DOI: 10.1016/j.enbuild.2011.04.019
Seo, J., Cha, J., and Kim, S. (2012). “Enhancement of the thermal conductivity of adhesives for wood flooring using xGnP,” Energy &Buildings51, 153-156. DOI: 10.1016/j.enbuild.2012.05.003
Shin, M.S., Rhee, K.N., Ryu, S.R., Yeo, M.S., and Kim, K.W. (2015). “Design of radiant floor heating panel in view of floor surface temperatures,” Building and Environment 92, 559-577. DOI: 10.1016/j.buildenv.2015.05.006
Wang, D., Liu, Y., Wang, Y., and Liu, J. (2014). “Numerical and experimental analysis of floor heat storage and release during an intermittent in-slab floor heating process,” Applied Thermal Engineering62(2), 398-406. DOI: 10.1016/j.applthermaleng.2013.09.028
Yi, X., Zhao, D., Ou, R., Ma, J., Chen, Y., and Wang, Q. (2017).“Comparative study of the performance of wood-plastic composites and typical substrates as heating floor,” BioResources 12(2), 2565-2578. DOI: 10.15376/biores.12.2.2565-2578
Xu, T., Wu, F., Zou, T., Li, J., Yang, J., Zhou, X., Liu, D., and Bie, Y. (2022). “Development of diatomite-based shape-stabilized composite phase change material for use in floor radiant heating,” Journal of Molecular Liquids 348, article 118372. DOI: 10.1016/j.molliq.2021.118372
Zhang, D., Cai, N., and Wang, Z. (2013). “Experimental and numerical analysis of lightweight radiant floor heating system,” Energy & Buildings 61, 260-266. DOI: 10.1016/j.enbuild.2013.02.016
Zhang, Q., Sun, J., and Zhou, Y. (2011). “Numerical simulation and optimization of floor radiant heating with different surface course materials,” Building Energy Efficiency39(239), 25-29. (in Chinese)
Zhao, K., Liu, X.-H., and Jiang, Y. (2014). “On-site measured performance of a radiant floor cooling/heating system in Xi’an Xianyang International Airport,” Solar Energy 108, 274-286. DOI: 10.1016/j.solener.2014.07.012
Zhou, G., and He, J. (2015). “Thermal performance of a radiant floor heating system with different heat storage materials and heating pipes,” Applied Energy138, 648-660. DOI: 10.1016/j.apenergy.2014.10.058
Article submitted: March 13, 2023; Peer review completed: March 25, 2023; Revised version received: April 14, 2023; Accepted: April 15, 2023; Published: April 19, 2023.
DOI: 10.15376/biores.18.2.3909-3922