
Abstract

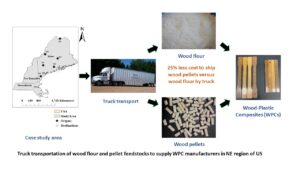
This study evaluated and analyzed transportation costs for manufacturing wood-plastic composites (WPCs) using wood flour and wood pellet feedstocks. The study area ranged from Maine (ME) to Massachusetts (MA) in the Northeast region of the United States (US). Wood mills in ME were the raw material providers, and the WPC manufacturers in ME and MA were the destinations. The methodologies included the Origin-Destination (OD) cost matrix feature in ArcGIS to find least-cost pathways from each facility to each destination; baseline scenarios based on trucking costs, travel distances, and wood feedstocks; and sensitivity analyses to study the effects of fluctuating input variables (travel distance, shipment weight, and shipping costs over distance) to the shipping costs by weight. Accordingly, the best and worst-case scenarios were identified. The OD-cost matrix showed that shipping feedstocks from southern ME required shorter travel distances than from other regions because of proximity. Transporting wood pellets in a truck would reduce shipping costs by at least 25% compared to wood flour. The shipping costs by weight were inversely related to the shipment weight. The shipment weight of wood pellets was higher than flour in a truck trailer with fixed volume. It is foreseen that the transportation of wood pellets as opposed to wood flour would be economical.
Download PDF
Full Article
Transportation Cost Analysis on Alternative Wood Feedstocks for Manufacturing Wood-Plastic Composites
Geeta Pokhrel,a,* Anil Raj Kizha,a and Douglas J. Gardner a, b
This study evaluated and analyzed transportation costs for manufacturing wood-plastic composites (WPCs) using wood flour and wood pellet feedstocks. The study area ranged from Maine (ME) to Massachusetts (MA) in the Northeast region of the United States (US). Wood mills in ME were the raw material providers, and the WPC manufacturers in ME and MA were the destinations. The methodologies included the Origin-Destination (OD) cost matrix feature in ArcGIS to find least-cost pathways from each facility to each destination; baseline scenarios based on trucking costs, travel distances, and wood feedstocks; and sensitivity analyses to study the effects of fluctuating input variables (travel distance, shipment weight, and shipping costs over distance) to the shipping costs by weight. Accordingly, the best and worst-case scenarios were identified. The OD-cost matrix showed that shipping feedstocks from southern ME required shorter travel distances than from other regions because of proximity. Transporting wood pellets in a truck would reduce shipping costs by at least 25% compared to wood flour. The shipping costs by weight were inversely related to the shipment weight. The shipment weight of wood pellets was higher than flour in a truck trailer with fixed volume. It is foreseen that the transportation of wood pellets as opposed to wood flour would be economical.
DOI: 10.15376/biores.17.1.634-651
Keywords: Wood flour; Wood pellets; Wood-plastic composites; Bulk density; Truck transport; Transportation costs
Contact information: a: School of Forest Resources, 5755 Nutting Hall, University of Maine, Orono, ME 04469 USA; b: Advanced Structures and Composites Center, 35 Flagstaff Road, University of Maine, Orono, ME 04469 USA; *Corresponding author: geeta.pokhrel@maine.edu
GRAPHICAL ABSTRACT
INTRODUCTION
Wood Feedstocks (flour and pellets) for Wood-plastic Composites (WPCs)
Wood-plastic composites (WPCs) are hybrid materials of wood, typically comprised of wood flour, thermoplastic or thermoset resins, and several additives. These composite products are utilized in multiple forms such as decking, automotive, siding, fencing, technical applications, furniture, and other consumer goods. The global market size of WPCs is expanding and is forecasted to reach USD 9.03 billion by 2027 (Fortune Business Insights 2021). Images of WPC samples and the feedstocks that can be used for manufacturing WPCs are shown in Fig. 1.
Wood flour, also called “wood fiber”, is a highly comminuted wood material with a fine particle size distribution that is generally used as the raw material for producing WPCs (Reineke 1966). The particle sizes of wood flour can range from 20 to 400 United States (US) mesh (850 to 35 microns). Wood flour is typically manufactured by secondary processing of mill residues. In the US, most of the wood flour comes from shavings and sawdust. The bulk density of wood flour is influenced by several factors such as the moisture content, particle size, and species (Clemons and Caulfield 2010).
Wood pellets are a biofuel manufactured using compressed organic matter or biomass. In this study, wood pellets were considered as an alternative feedstock to wood flour for the manufacture of WPCs. Wood pellets are produced in a temperature range of 110 to 130 °C and a pressure range of 210 to 450 MPa (Nielsen et al. 2009). The manufacturing process creates the elastic and plastic deformation of particles and the softening of natural binders such as starch, protein, lignin, fat, and fibers (Gilvari et al. 2020). The raw materials that are used to manufacture wood pellets are drawn from multiple sources including unmerchantable roundwood from the forest, sawdust and board edging residues from sawmills, wood chips and odd pieces from furniture production, and stalks and straws from agriculture. The utilization of wood pellets has increased throughout the world from approximately 12 million metric tons (MT) in 2008 to 56 million MT in 2018 (Calderón et al. 2019). Nearly one-third of global wood pellet production is exported to Europe from the US and Canada.

Fig. 1. Images of the a) wood flour, b) wood pellets, and c) WPCs (Pokhrel, Han et al. 2021).
Transportation of WPC Feedstocks and the Properties that Affect Shipping
In the US, the average hauling distance for primary forest products was highest in the North compared with other regions, which increased the price of the final products made there (Libbey 2000). Transportation costs for woody biomass are a function of the travel time, transportation form, and energy density of the product. Transportation accounts for approximately half of the total woods-to-gate production costs in the forest supply chain (Kizha et al. 2015). Transportation costs can impact supplies from the forestland to processing facilities, and from the processing facilities to the markets (Paulson et al. 2019). The logistics and supply chain of the feedstock are key in determining the final price of the end product (Koirala et al. 2018). Lower costs in freight movement have a positive effect on all entities engaged in the production, distribution, trade, and/or retail sale.
The theoretical comparison of the bulk density of wood pellets (700 to750 kg/m3) and wood flour (190 to 220 kg/m3) reflects that transporting pellets can be almost four times more economical than the latter (Pokhrel, Gardner, et al. 2021). Wood flour is not considered a dangerous product to transport, so it is shipped in fleets of dry vans with walking-floor van trailers or closed-van trailers, in super sacks for large quantities, or as bagged wood flour for small quantities. The physical and mechanical properties of WPCs formulated using wood flour or ground wood pellets with polypropylene plastics are similar (Pokhrel, Han, et al. 2021).
The total energy requirement of pressing wood pellets from wood flour followed by re-grinding to be used for manufacturing WPCs should be determined to ensure that the costs do not exceed the savings obtained from the lowered transportation costs. Knowledge is limited on topics involving the comparison of transportation costs for shipping wood flour and pellets concerning variation in travel distances and shipment weight. Thus, this research aimed to compare the transportation costs for shipping two wood feedstocks for WPC manufacturing – wood flour and pellets- under different scenarios. The discussion on transportation related to wood flour and pellets presented in this study was focused on the perspective of WPC manufacturers, not on the other applications where each of these products has its own indispensable role.
Truck and Rail Transportation
In the US, there has been a shifting from the railway to the road transportation in the forest products industry. This shift has been attributed to the unavailability of railcars, delayed delivery or inflexible rail schedules, and the costs associated with the construction of railways (Kizhakkepurakkal 2012). Fuel costs can always be a challenge for the shipment of lighter weight forest products such as mill residues or wood flour. For lighter weight materials, it might be economical to supply to the local market via a truck rather than transporting farther distances via rail. However, the larger payload in rail transportation makes it more economical to ship to farther distances compared to trucks (Lindholm and Berg 2005). Thus, valuable products could be hauled economically by rail transport. Railways could have a greater applicability on shipping wood residues or their subsequent products from their collection site to utilization sites if the collection site is near to a railway intermodal terminal (Kizhakkepurakkal 2012).
Scope of the Study
This study covered the area from Maine (ME) to Massachusetts (MA) in the Northeast region of the US. In ME, forest products industries are a key part of the state’s economy. In recent years, the industry has shifted towards engineered wood products, biofuels, high-performance fibers, and natural chemicals (FOR Maine 2018). As one of the most densely forested states in the nation, ME has many wood mill processors. More than 90% of the wood and wood products are transported via truck (Koirala et al. 2017a). There is a strong interest among forest industry stakeholders to understand the potentials of utilizing a compact form of wood flour as a raw material to manufacture WPCs. The idea is that the densified material could be shipped economically over greater distances. The first objective of the study was to evaluate the cost of trucking from each origin to each destination. The second objective was to capture the variation in total shipping cost by weight ($/MT) due to fluctuation in the travel distance (km), shipping cost over distance ($/km), and the weight of the shipment (MT). A sensitivity analysis was performed for the shipping cost by weight ($/MT) for both wood flour and wood pellets. Finally, the difference in shipping costs over weight was expressed in percentages of change with respect to each variable for each material type, followed by which the base-case, best-case, and worst-case scenarios were determined. The schematic representation of the manufacturing and transportation process along with the boundary of this study is defined in Fig. 2.

Fig. 2. The schematic representation and boundaries of transportation cost analysis for utilizing wood flour and wood pellets as feedstock to manufacture WPCs
EXPERIMENTAL
Terminologies Used in the Study
Feedstocks: Wood feedstocks that are required to manufacture WPCs. Wood pellets and wood flour were the two wood feedstocks compared in this study.
Shipment weight: In the state of Maine, the maximum gross vehicle weights for public roads and interstate highways are 45 and 36 MT, respectively.
Shipment cost by weight ($/MT): The transportation cost incurred when shipping 1 MT of the wood feedstock via truck.
Shipment cost over distance ($/km): The transportation cost incurred when shipping a truck load of the wood feedstocks over a 1 km distance.
Travel distance: The one-way travel distance between facility (origin) and destination (WPC manufacturer) in km.
Base case scenario: The average values of the input variables related to trucking, wood feedstocks, and travel distance. These were obtained either from personal communication or literature review.
Best and worst-case scenarios: The input variables were increased and decreased from the base-case values by 15% for the best and worst-case scenarios, respectively. The intention here was to evaluate the effect of fluctuations at different levels. When the input variable was increased or decreased by 15% from the base value, the best case represented minimum shipping cost by weight ($/MT) and the worst-case represents the maximum shipping cost by weight. The input variables were analyzed at both the individual and combined level.
Case Study
The analysis of the transportation costs began by selecting wood mills as facilities from different geographical regions within ME (i.e. east, west, north, south, and central), along with WPC manufacturers in ME and MA as destinations (Fig. 3). The coordinate data (longitude and latitude) for the locations of the wood mills were obtained from Google Earth and were uploaded to ArcGIS 10.7.1 (Esri, Redlands, CA). The selected mill in each geographical region was the largest processor for a particular wood species. The study considered shipping of both wood flour and wood pellet feedstocks from each of the selected facilities to the destinations, via trucking.

Fig. 3. Locations of the facilities and destinations utilized for the transportation cost analysis
Roads Network and Building Roads Network Dataset
The datasets for the roads were obtained from the US Census’s Topographically Integrated Geographic Encoding and Referencing (TIGER) data set. The speed limits for the different road types (i.e. interstate, state, private, and local roads) were assigned for each state. The assumption was based on the fact that once the feedstock leaves the state of ME, trucks will only be using highways (interstate and state). This doesn’t hold when the truck delivers feedstock to the WPC manufacturer in MA after leaving the highway. In ME, the speed limits on the interstate, state, private, and local roads were set at 120, 90, 40, and 50 km/hr, respectively. For New Hampshire, the speed limit on interstate and state roads was 110 and 90 km/hr, respectively; and in MA it was 105 and 90 km/hr, respectively.
Network Analysis and Origin-Destination (OD) Cost Matrix
Using the OD cost matrix feature in the Network Analyst tool in ArcGIS software, least-cost pathways from multiple origins to the two destinations were calculated. The Network Analyst tool is used for maintaining network dataset through modeling and carrying out network analysis through different features. In the OD cost matrix feature, the origins and destinations were set as the six wood mills (facilities) and two WPC manufacturers, respectively. The default cut-off value or the maximum distance was set at 800 km for this analysis, which was primarily attributed to shipping costs not being economically feasible after that. The line table that represents the OD cost matrix shows the network distance, not the straight line distance (Montgomery et al. 2016).
Baseline Scenario
The range of input variables for the baseline logistics scenario of shipping wood flour and pellets from the wood mills to WPCs manufacturers were obtained from literature review and personal communications. The input variables selected were bulk density (kg/m), market price ($), shipping volume (m3), travel distance (km), shipping cost over distance ($/km), and shipment weight (MT). Similarly, the market price of wood flour and pellets also varied depending on several factors including purchasing in bulk vs. small quantities, product quality, supply and demand, travel distance from origin to destination, and production cost.
Two types of trailer configurations are commonly used in the New England region, and they vary based on the length and the maximum volume they occupy. The travel distance from each facility to the destination was obtained from the first objective of the study. The shipment weight (MT) of the wood flour and pellets was derived from the bulk density (kg/m) and the shipping volume (m3) of the trailer. The total shipping cost ($) was obtained by multiplying travel distance (km) and the shipping cost over distance ($/km) (Eq. 1). The shipping cost by weight ($/MT) was calculated by dividing the total shipping cost ($) and the weight of the shipment (MT) (Eqs. 2 and 3).
Shipment weight = Bulk density × Shipping volume (1)
Total shipping cost = Travel distance × Shipping cost over distance (2)
Shipping cost by weight = Total shipping cost ÷ Shipment weight = (Travel distance × Shipping cost over distance) ÷ Shipment weight (3)
Table 1. The Input Variables Range and the Average Values for the Feedstocks Related to Hauling (via Truck)

The values were obtained from literature search and personal communication with the business personnel in ME. Similar values for both wood flour and pellets are merged in a single cell. The weight and legal gross vehicle weight (GVW) of the trailer was 6 MT and 30 MT, respectively.
The major input variables related to the feedstock properties and transportation were average travel distance, shipping cost over distance, and shipment weight. The average values of the above input variables were determined and used to perform the sensitivity analysis (Table 1).
Sensitivity Analysis
A sensitivity analysis was performed to study the effects of fluctuating input variables (travel distance, shipping cost over distance, and weight of the shipment) on the output variable (i.e., shipping cost over weight for both feedstocks). This was done by changing one or more input variables at a time while keeping the others constant. The sensitivity analysis helped provide a better idea of the uncertainty involved in any economic analysis and investment (George et al. 2019). The graphs for the sensitivity analysis were generated on RStudio 4.0.3 (Boston, MA).
For this analysis, seven cases of the input variables (travel distance, shipping cost over distance, and shipment weight) with reference to the baseline scenario (fluctuation by %) were considered, including one with the baseline scenario values:
Case I: All input variables were decreased by 15%.
Case II: All input variables were decreased by 10%.
Case III: All input variables were decreased by 5%.
Case IV: All input variables were kept equal to the baseline scenario.
Case V: All input variables were increased by 5%.
Case VI: All input variables were increased by 10%.
Case VII: All input variables were increased by 15%.
For each case, the average increase or decrease of the shipping cost by weight ($/MT) by percentage for both feedstocks was compared to the base-case value to determine the worst-case and the best-case scenarios.
Assumptions
The following assumptions were made for the analysis:
- Both the wood flour and wood pellet feedstocks were manufactured in the same facility (even though currently there are no commercial producers of wood flour in ME).
- Both the wood feedstocks can be utilized to manufacture WPCs without compromising the physical and mechanical properties of the end product (Pokhrel, Han, et al. 2021).
- Even though railways are the most economical mode of land transportation, trucking was the mode of transporting the wood feedstocks. Despite the presence of a railway system in ME, only a few counties have access to them. In this study, the selected origins are based on different geographical locations in ME.
RESULTS
Logistics
Within ME, the nearest travel distance was within the range of 0 to 100 km and the farthest was 500 to 600 km. Each procurement zone had one mill (Table 2). No mills were found within the ranges of 300 to 400 km and 400 to 500 km. Similarly, to reach the WPC manufacturer in MA, the nearest travel distance was within the range of 200 to 300 km and the farthest was within the procurement range of 700 to 800 km (Table 2). There were no wood mills within the travel distance of 600 to 700 km. The average travel distance among all the origin-destinations considered in the study was 372 km.
Table 2. The Procurement Zones and Number of Facilities in Each Procurement Zone Based on the Distances (km) from Wood Mills in ME to WPC Manufacturers in ME and MA via Truck

Factors Influencing Shipping Cost by Weight ($/MT)
Four sensitivity graphs were plotted (two each) to illustrate variations in shipping cost by weight ($/MT) for both feedstocks. The first graph (Fig. 5a) shows the influence of changing one, two, and three variables. The second graph (Fig. 5b) shows the influence of each variable individually.
The input variables (i.e., travel distance, shipment weight, and shipping cost over distance) were changed either one, two, or three at a time. The value of the shipping cost by weight for wood flour and pellets ranged between $20 and $50 per MT and $20 and $38 per MT, respectively. The average of the total shipping cost for both feedstocks was $866 per trip. In addition, the shipping cost by weight over distance for the wood flour and the wood pellets was $0.11 and $0.08 per MT·km, respectively.
The sensitivity analysis showed that total shipping cost by weight was directly related to the travel distance and shipping cost over distance for both feedstock (Figs. 5 and 6). The shipment weight (MT) was inversely related to the transportation cost by weight ($/MT) and had the highest impact on the latter while keeping other input variables constant. Conversely, the combined change induced to the other variables (i.e., shipment weight and travel distance; and shipment weight and shipping cost over distance) did not affect the shipping cost by weight.
Logistics Scenarios
Fluctuation in shipment weight
The total shipping cost of wood flour by weight ($/MT) increased by 5, 11, and 18% in response to a 5, 10, and 15% decrease in the shipment weight, respectively, when compared to the baseline (i.e., Case III, II, and I). However, when increased by the same values (i.e., Case V, VI, and VII), the total shipping cost by weight decreased by 5, 9, and 13%, respectively. Similar percentage changes were obtained for the wood pellets.

Fig. 5. The sensitivity analysis conducted on the shipping cost by weight ($/MT) of wood flour by increasing and decreasing the input variables (travel distance, shipment weight, and shipping cost over distance) by 5, 10, and 15%

Fig. 6. The sensitivity analysis conducted on the shipping cost by weight ($/MT) of wood pellets by increasing and decreasing the input variables (travel distance, shipment weight, and shipping cost over distance) by 5, 10, and 15%
Table 3. Shipping Cost by Weight ($/MT) with the Change in Shipment Weight (MT) of Wood Flour and Wood Pellets

Fluctuation in travel distance and shipping cost over distance
When the travel distance was decreased and increased by 5, 10, and 15% from the base value, the total shipping cost by weight also decreased and increased by 5, 10, and 15%, respectively (Table 4). Both the wood flour and the wood pellets had the same trend in terms of similar fluctuation of shipping cost over distance ($/km) on shipping cost by weight ($/MT).
Table 4. Shipping Cost by Weight ($/MT) with the Change in Travel Distance (km) and Shipping Cost over Distance ($/km)

Effect of combined changes
The combined changes in the shipment weight and the travel distance as well as the combined changes in the shipment weight and shipping cost over distance had no effect on the shipping cost by weight. The shipping cost by weight for the wood flour and wood pellets remained a constant of $39 and $29 per MT, respectively.
The shipping cost by weight of both wood feedstocks decreased by 10, 19, and 28% when the travel distance and shipping cost over distance decreased together by 5, 10, and 15%, respectively (Case III, II, and I). Likewise, the shipping cost by weight increased by 10, 21, and 32% when these variables increased by 5, 10, and 15%, respectively, from the base values (i.e., Case V, VI, and VII) (Table 5). On the other hand, as the shipment weight, travel distance, and shipping cost decreased over distance by 5, 10, and 15% (Case III, II, and I), the shipping cost by weight decreased by 5, 10, and 15%, respectively. When these three variables increased by 5, 10, and 15% (Case V, VI, and VII), the shipping cost by weight increased by the same percentage, respectively (Table 5).
Table 5. Shipping Cost by Weight ($/MT) with the Change in Travel Distance (km) and Shipping Cost over Distance ($/km) as well as the Change in Weight of the Shipment (MT), Distance (km), and Shipping Cost over Distance ($/km)

The analysis showed that changing the three variables (shipment weight, travel distance, and shipping cost over distance) in varying degrees resulted in an average increment of 26% shipping cost by weight in wood flour compared to that of wood pellets.
DISCUSSION
Raw Material Supply Chain
The OD cost matrix tool computes the most appropriate travel route based on road types and their speed limits. Since both the WPC manufacturers were in the southern part of the states, wood mills near them have the advantage of shorter travel distances. However, the wood resources (timberlands) are concentrated in the northern and western part of ME. Although the southern region has less travel distance to supply the wood feedstocks for WPC, the northern and western mills have much more access to the timber supply at a lower delivery cost.
Wood processing facilities are dispersed throughout ME. The higher concentration of wood facilities towards the southern part of ME is because of the potential markets for the final product (wood flour and wood pellets), rather than the procurement zone of the raw material. There is a cluster of these companies ranging from secondary wood products manufacturers to biomass energy and power firms to sawmills. They have a greater connection and dependency on one another for the development and raw material procurement (Colgan et al. 2002). The wood-based facilities export a significant amount of forest-based products to New England, New York, and the Mid-Atlantic states (Department of Conservation-Maine Forest Service and Maine Technology Institute 2005).
Sensitivity Analysis Graphs
Of the seven different sensitivity analyses performed, only four showed a distinct trend (Figs. 5a and 6a). The combined changes in the shipment weight of wood feedstocks and the shipping cost over distance, as well as combined changes in the shipment weight and the travel distance presented straight lines parallel to the x-axis, as they did not influence the shipping cost by weight ($/MT). Furthermore, the values of the shipping cost by weight versus the travel distance, shipping cost over distance, and combination of all three (shipment weight, travel distance, and shipping cost over distance) remained the same. Here, the shipping cost by weight increased as the percentage values of input variables increased and vice-versa. In summary, the wood flour and wood pellet sensitivity graphs follow a similar pattern but with different numerical values of shipping cost by weight ($/MT).
In general, residues (feedstock) generated from forest products industries have low-value and bulk density, and a result, it becomes a challenge to provide cost-effective means of transportation (Department of Conservation-Maine Forest Service and Maine Technology Institute 2005). Density is an important factor that affects the transportation of wood products (Abdoli et al. 2018). Shipping wood flour costs more than shipping sawdust (Reineke 1966). The volume of the goods to be shipped can directly affect the road transportation costs (Mokhirev et al. 2019). The lower bulk density of wood flour can result in the shipping cost exceeding the feedstock’s actual price (Pokhrel, Gardner, et al. 2021). This is because the loaded truck trailer has not attained the maximum legal load capacity. Likewise, factors such as moisture content, particle size, composition of the feedstocks, pressure, temperature, and die diameter of the pellet mill can affect the unit or bulk density of wood pellets (Tumuluru 2016). Materials with a higher moisture content, a larger particle size, and a higher temperature and pressure during processing of the materials can increase the unit/bulk density (Beauchemin and Tampier 2008).
Logistics Scenario Evaluation
Based on the shipment weight for both feedstocks, the best case of shipping cost by weight was observed when the shipment weight increased by 15% (Table 3). Likewise, the worst-case was observed when the weight of the shipment decreased by 15% from the base-case scenario.
On the other hand, individually considering the travel distance and shipping cost over distance yields an opposite result. For both these input variables fluctuation, the best-case scenario was observed by decreasing their respective values by 15% (Table 4). Likewise, the worst-case scenario was observed on increasing their respective values by 15%. The reduced travel distance resulted in more trips per day, which enhanced the truck utilization. The savings from the longer travel distance of the wood pellets over wood flour could compensate for the extra step of compacting wood flour into pellets before transportation, followed by pulverizing the pellets back to wood flour after reaching the WPC processors. The optimum economic shipping distance and weight for similar feedstocks such as wood chips were within 386 km and 30 tons, respectively (Gonzales et al. 2013). The authors suggested that shipping via truck is economical to reach shorter destinations by carrying the goods with less volume.
The shipping cost by weight did not have best or worst-case scenarios based on the combined changes in the shipment weight and the travel distance along with the combined changes in the shipment weight and the shipping cost over distance. Considering the combined changes in travel distance and shipping cost over distance, decreasing by 15% from the baseline gave the best-case of shipping cost by weight for both wood feedstocks. Likewise, the worst-case was observed on increasing the values by 15% (Table 5).
In addition, in changing three variables at a time, the best case was also observed by decreasing all the variables below the baseline scenario and worst case by increasing all the variables above the baseline by 15%, respectively (Table 5). The shipping cost by weight had a direct relation with two variables (i.e., travel distance and shipping cost over distance) and an inverse relation with the shipment weight. Attributable to the combination of variables having more influence than just one, there is a direct relationship between the increase or decrease of a pair of variables and the shipping cost by weight.
Increasing the weight of the shipment from the baseline value reduced the total shipping cost over distance. However, trucks cannot be loaded over their legal GVW, which limits the applicability of the effect of shipment weight on reducing the transportation costs (Department of Conservation-Maine Forest Service and Maine Technology Institute 2005).
Shipping of Wood Flour and Pellets via Truck
With respect to other biomass fuels, wood pellets are easy to handle, store, and transport (Proskurina et al. 2016). When transporting wood pellets, bulk density is expected to decrease as the pellets break and produce smaller particles during long-distance transportation (Sjöström and Blomqvist 2014). Pellets may break either through splitting into two or more pellets but keeping their cylindrical shape, weakening of pellet surfaces and ends, and crushing of the whole pellet (Thomas 1998; Boac et al. 2008; Oveisi et al. 2013). However, this could be advantageous for WPC manufacturers, as the wood feedstocks need to be re-ground for feeding into the extruders. Low-density biomass creates difficulties during feeding, handling, and transportation (Tumuluru 2016). During road transportation, wood flour is limited by volume, whereas pellets are limited by shipment weight. For example, a fully loaded containment with wood flour wouldn’t reach the maximum GVW and conversely, the containment with the wood pellets that had the same weight as the wood flour would have extra space available.
The selection of an appropriate truck and trailer depends on the geography, road conditions, and climate (Koirala et al. 2017b). Trucks are popular because of their ease of accessibility and well-developed road network in the region. Based on the theoretical calculations of bulk density and total volume for wood pellets, the shipment weight of a fully loaded truck should be approximately 72 MT. This would then reduce the shipment cost by weight for wood pellets by approximately 69% compared to wood flour. The described ideal situation of reducing the cost for shipping wood pellets as opposed to wood flour could be attainable through other forms of transportation that can carry huge shipment weights (e.g., train). However, because of the shipment weight limits on trucks, the transportation cost of wood pellets is 25% less expensive than wood flour. The handling and transportation costs for the densified biomass are lower than that of the unprocessed feedstock (Gonzales et al. 2013). As a result, densifying products for long distance transportation is a procedure worth exploring. Decreasing the size of the compressed biomass can increase the number of unit operations involved such as grinding (Sokhansanj and Turhollow 2004).
Alternatives to Trucking
Considering other forms of transportation, railroad lines can accommodate loaded railcars of 130 MT or greater, but significant portions of the rail network in ME can only accommodate 120 MT rail cars (ME Department of Transportation 2014). Maine has 1,770 km of rail oriented predominantly east-west, where the forest products industry is the primary customer base (ME Department of Transportation 2014; ME Department of Transportation 2017). For railway transportation, the major factors that affect the costs can be ownership of the railcar, service provider, shipment origin and destination, and competition with the other transportation modes (Gonzales et al. 2013). However, rail transportation in general offers higher shipment weights and lower long-distance transportation costs than trucks. Therefore, rail could be considered the best mode for shipping wood feedstocks over longer distances. Improving accessibility to rail transport, increasing the numbers and size of rail cars, and private (shipper-owned and controlled) car fleets can improve railway transportation (Wilbur Smith Associates 2003).
CONCLUSIONS
- This study was carried out to address the current issue of high shipment costs of wood flour over long distances to supply WPC manufactures and explore the effects of various variables on the transportation costs. Furthermore, the increased interest of concerned stakeholders to explore densified forms of wood flour in the region has led to the concept of utilizing wood pellets as feedstock for WPC manufacturing.
- The sensitivity analysis showed that in the study area, road transportation of wood pellets was at least 25% more cost-effective than the alternative feedstock, wood flour. We expect this could be at least 69% more cost-effective when considering other forms of transportation where the shipment load limit is quite high.
- Sourcing the wood feedstocks from the wood mills located in southern ME can lower the transportation costs, as they have closer proximity to WPC manufacturers.
- The best-case scenario was observed when increasing (maximum at 15%) the shipment weight of the feedstock and decreasing (maximum at 15%) the travel distance and shipping cost over distance from the baseline scenario. Increasing the shipment weight of the wood feedstocks decreased the shipping cost by weight the most compared to other input variables. The weight of the shipment is also related to the bulk density.
- The densification of the wood flour would benefit the WPC manufacturers in terms of transportation costs.
ACKNOWLEDGMENTS
The authors are grateful to the United States Department of Agriculture (USDA) Agriculture Research Service (ARS) with Agreement Number/FAIN: 58–0204-9–166 and Project Number: 0204–41510-001–90S for funding. This project was supported by the USDA National Institute of Food and Agriculture, Hatch (or McIntire-Stennis, Animal Health, etc.) Project Numbers ME0-41809 and ME0-41909 through the Maine Agricultural and Forest Experiment Station. Maine Agricultural and Forest Experiment Station Publication Number 3858.
REFERENCES CITED
Abdoli, M. A., Golzary, A., Hosseini, A., and Sadeghi, P. (2018). “Wood pellet characteristics (definition, determination and internal relation),” in: Wood Pellet as a Renewable Source of Energy: From Production to Consumption, M. A. Abdoli, A. Golzary, A. Hosseini, and P. Sadeghi (eds.), Springer International Publishing, Basel, Switzerland, pp. 111-138.
Beauchemin, P. A., and Tampier, M. (2008). “Emissions from wood-fire combustion equipment,” Envitrochem Services Inc., North Vancouver, B.C.
Boac, J. M., Casada, M. E., and Maghirang, R. G. (2008). “Feed pellet and corn durability and breakage during repeated elevator handling,” Applied Engineering in Agriculture 24(5), 637-643. DOI: 10.13031/2013.25262
Calderón, C., Gauthier, G., and Jossart. J.-M. (2019). Bioenergy Europe Statistical Report 2019 – Key Findings, European Association Bioenergy Europe, Brussels, Belgium.
Clemons, C. M., and Caulfield, D. F. (2010). “Wood flour,” in: Functional Fillers for Plastics, M. Xanthos (ed.), Wiley-VCH, Weinheim, Germany.
Colgan, C. S., Baker, C., Buterfield, N., and Cote, M. (2002). “Assessing Maine’s technology clusters,” Maine Science and Technology Foundation, Portland, ME.
Department of Conservation-Maine Forest Service and Maine Technology Institute. (2005). “Current conditions and factors influencing the future of Maine’s forest products industry,” Innovative Natural Resource Solutions LLC, Portland, ME.
George, A. K., Kizha, A. R., and Kenefic., L. (2019). “Economic feasibility of timber harvesting in lowlands,” in: FORMEC 2019 – Exceeding the Vision: Forest Mechanisation of the Future, Sopron, Hungary, pp. 379-393.
Gilvari, H., Cutz, L., Tiringer, U., Mol, A., de Jong, W., and Schott, D. L. (2020). “The effect of environmental conditions on the degradation behavior of biomass pellets,” Polymers 12(4), 970. DOI: 10.3390/polym12040970
Gonzales, D., Searcy, E. M., and Ekşioğlu, S. D. (2013). “Cost analysis for high-volume and long-haul transportation of densified biomass feedstock,” Transportation Research Part A: Policy and Practice 49, 48-61. DOI: 10.1016/j.tra.2013.01.005
Forest Opportunity Roadmap / Maine (FOR Maine) (2018). (http://formaine.org/wp-content/uploads/2020/09/FORMaine_Report_DL_041119.pdf.), Accessed 8 August 2020.
Fortune Business Insights (2021). “Wood plastic composite market to worth USD 9.03 billion by 2027 | Says Fortune Business InsightsTM,” Globe Newswire News Room, (https://www.globenewswire.com/news-release/2021/09/14/2296333/0/en/Wood-Plastic-Composite-Market-to-Worth-USD-9-03-Billion-by-2027-Says-Fortune-Business-Insights.html), Accessed 22 September 2021.
Kizhakkepurakkal, A. R. (2012). Biomass Energy Production in Louisiana: A GIS Study on the Supply Chain, Doctoral Thesis, Louisiana State University, Baton Rouge, LA, USA.
Kizha, A. R., Han, H.-S., Montgomery, T., and Hohl., A. (2015). “Biomass power plant feedstock procurement: Modeling transportation cost zones and the potential for competition,” California Agriculture 69(3), 184-190. DOI: 10.3733/ca.v069n03p184
Koirala, A., Kizha, A. R., de Hoop, C. F., Roth, B. E., Han, H.-S., Hiesl, P., Abbas, D., Gautam, S., Baral, S., Bick, S., et al. (2018). “Annotated bibliography of the global literature on the secondary transportation of raw and comminuted forest products (2000–2015),” Forests 9(7), 415. DOI: 10.3390/f9070415
Koirala, A., Kizha, A. R., and de Urioste-Stone, S. M. (2017a). “Policy recommendation from stakeholders to improve forest products transportation: A qualitative study,” Forests 8(11), 434. DOI: 10.3390/f8110434
Koirala, A., Kizha, A. R., and Roth, B. (2017b). “Perceiving major problems in forest products transportation by trucks and trailers: A cross-sectional survey,” European Journal of Forest Engineering 3(1), 23-34.
Libbey, S. S. (2000). An Assessment of Regional Variation in the Factors Affecting the Mill-Delivered Price of Softwood Sawlogs and Pulpwood in Nine States, Master’s Thesis, University of Maine, Orono, ME, USA.
Lindholm, E. L., and Berg, S. (2005). “Energy requirement and environmental impact in timber transport,” Scandinavian Journal of Forest Research 20, 184-191.
Maine Department of Transportation (2014). 2014 Maine State Rail Plan, MaineDOT, Augusta, ME.
Maine Department of Transportation (2017). Maine Integrated Freight Strategy Cambridge Systematics Inc., Medford, MA.
Mokhirev, A., Gerasimova, M., and Pozdnyakova, M. (2019). “Finding the optimal route of wood transportation,” IOP Conference Series: Earth and Environmental Science 226, 012053. DOI: 10.1088/1755-1315/226/1/012053
Montgomery, T. D., Han, H.-S., and Kizha. A. R. (2016). “Modeling work plan logistics for centralized biomass recovery operations in mountainous terrain,” Biomass and Bioenergy 85, 262-270. DOI: 10.1016/j.biombioe.2015.11.023
Nielsen, N. P. K., Gardner, D. J., Poulsen, T., and Felby, C. (2009). “Importance of temperature, moisture content, and species for the conversion process of wood residues into fuel pellets,” Wood and Fiber Science 41(4), 414-425.
Oveisi, E., Lau, A., Sokhansanj, S., Lim, C. J., Bi, X., Larsson, S. H., and Melin, S. (2013). “Breakage behavior of wood pellets due to free fall,” Powder Technology 235, 493-499. DOI: 10.1016/j.powtec.2012.10.022
Paulson, J. S., Kizha, A. R., and Han, H.-S. (2019). “Integrating biomass conversion technologies with recovery operations in-woods: Modeling supply chain,” Logistics 3(3), 16. DOI: 10.3390/logistics3030016
Pokhrel, G., Gardner, D. J., and Han, Y. (2021). “Properties of wood–plastic composites manufactured from two different wood feedstocks: Wood flour and wood pellets,” Polymers 13(16), 2769. DOI: 10.3390/polym13162769
Pokhrel, G., Han, Y., and Gardner, D. J. (2021). “Comparative study of the properties of wood flour and wood pellets manufactured from secondary processing mill residues,” Polymers 13(15), 2487. DOI: 10.3390/polym13152487
Proskurina, S., Rimppi, H., Heinimö, J., Hansson, J., Orlov, A., Raghu, K. C., and Vakkilainen, E. (2016). “Logistical, economic, environmental and regulatory conditions for future wood pellet transportation by sea to Europe: The case of Northwest Russian seaports,” Renewable Sustainable Energy Reviews 56, 38-50. DOI: 10.1016/j.rser.2015.11.030
Reineke, L. H. (1966). Wood Flour (Report No. FPL-0113), U. S. Department of Agriculture Forest Service Forest Products Laboratory, Madison, WI.
Sjöström, J., and Blomqvist, P. (2014). “Direct measurements of thermal properties of wood pellets: Elevated temperatures, fine fractions and moisture content,” Fuel 134, 460-466. DOI: 10.1016/j.fuel.2014.05.088
Sokhansanj, S., and Turhollow, A. F. (2004). “Biomass densification – Cubing operations and costs for corn stover,” Applied Engineering in Agriculture 20(4), 495-499. DOI: 10.13031/2013.16480
Thomas, M. (1998). Physical Quality of Pelleted Feed: A Feed Model Study, Ph.D. Thesis, Wageningen Agricultural University, Wageningen, The Netherlands.
Tumuluru, J. S. (2016). “Specific energy consumption and quality of wood pellets produced using high-moisture lodgepole pine grind in a flat die pellet mill,” Chemical Engineering Research and Design 110(C), 82-97. DOI: 10.1016/j.cherd.2016.04.007.
Wilbur Smith Associates (2003). Louisiana Statewide Rail System Plan, Louisiana Department of Transportation and Development, Baton Rouge, LA.
Article submitted: October 9, 2021; Peer review completed: November 21, 2021; Revised version received and accepted: November 29, 2021; Published: December 3, 2021.
DOI: 10.15376/biores.17.1.634-651