
Abstract
A vacuum-assisted sheet former was used for analyzing water removal from refined bleached hardwood kraft pulp furnishes. The Schopper Riegler (SR) values of the studied furnishes ranged from 43 to 97. Water removal time increased significantly with increasing SR value; the water removal time for SR97 furnish was two orders of magnitude longer than for SR43. Retention behaved differently with different SR levels. Retention was approximately constant for SR43 and SR72, for SR85 retention was initially slightly lower, and for SR97 retention was initially very low. The clogging of the wire due to the fines was very strong for SR97. A simple model of flow resistance of the filtered sheet worked very well for SR43 and SR72, and the model worked reasonably well for SR85. However, for higher SR levels, a retention model is needed to predict accurately the water removal in real-life applications.
Download PDF
Full Article
Vacuum-assisted Water Removal from Highly Refined Furnishes
Antti Koponen,a,* Juan Cecchini,b Samuli Heiskanen,b Merja Selenius,a and Ari Jäsberg a
A vacuum-assisted sheet former was used for analyzing water removal from refined bleached hardwood kraft pulp furnishes. The Schopper Riegler (SR) values of the studied furnishes ranged from 43 to 97. Water removal time increased significantly with increasing SR value; the water removal time for SR97 furnish was two orders of magnitude longer than for SR43. Retention behaved differently with different SR levels. Retention was approximately constant for SR43 and SR72, for SR85 retention was initially slightly lower, and for SR97 retention was initially very low. The clogging of the wire due to the fines was very strong for SR97. A simple model of flow resistance of the filtered sheet worked very well for SR43 and SR72, and the model worked reasonably well for SR85. However, for higher SR levels, a retention model is needed to predict accurately the water removal in real-life applications.
DOI: 10.15376/biores.18.1.1398-1419
Keywords: Forming; Furnish; Highly refined; Water removal; Vacuum; Sheet former
Contact information: a: VTT Technical Research Centre of Finland Ltd, Koivurannantie 1, 40400 Jyväskylä, Finland; b: Valmet Technologies, Inc., Rautpohjankatu 3, 40700 Jyväskylä, Finland;
* Corresponding author: Antti.Koponen@vtt.fi
GRAPHICAL ABSTRACT
INTRODUCTION
Micro or nanofibrillated celluloses (MFC or NFC) have been studied as additives in paper making. The composite papers produced by such addition have many beneficial properties and possible applications. For example, they have improved barrier, strength, surface, and optical properties (Lavoine et al. 2012; Balea et al. 2020; Das et al. 2020). However, the addition of MFC/NFC leads to a significant reduction in the rate of dewatering due to the sealing of the fiber web. The small fibrils contained in MFC/NFC are very effective at sealing the web due to their large surface area, high aspect ratio, and high hydrophilicity (Rantanen et al. 2015; Sjöstrand et al. 2019; Balea et al. 2020).
One way to produce furnishes containing MFC is by extensive refining using a conventional refiner (Chen et al. 2016; Nechyporchuk et al. 2016; Shafei-Sabet et al. 2016; Hubbe et al. 2017). This method has the advantage that it is a developed technology, and industrial-scale equipment already exists. However, this method does not produce a homogeneous suspension of MFC but a mixture of fibrillated fibers and fines; both are generated at the same time in the refining process. Fibrillation is generated from the secondary fiber wall, and fines are produced by primary wall removal and fiber cutting (Tripattharanan 2003). Thus, the produced furnishes suffer from web sealing due to the large proportion of fines (Hubbe 2002; Chen et al. 2009) in addition to the fibrils. However, the produced fines may also lead to increases in strength and other mechanical properties (Lindqvist et al. 2012; Fischer et al. 2017).
These highly refined fibers could be applied in various ways. For example, it has been suggested that fines could be used in many applications where the use of MFC is currently being evaluated (Fischer et al. 2017). An alternative interesting approach would be to utilize highly refined fibers directly for novel cellulose-based applications. The tethered MFC produced by the refining can lead to equivalent strength properties as MFC composites, but with considerable drainage benefits (Su et al. 2013). Highly refined fibers could be used together with MFC as paper composites leading to a combination of tethered and free MFC.
The main challenge for applications is the difficult dewatering of these furnishes. This is big a challenge, as the dewatering of the wet fiber web requires more energy than any other part of the paper manufacturing process. On a conventional paper machine, water is removed in three consecutive sections, which are the forming, pressing, and drying sections. The cheapest section to remove a unit of water is by far the forming section, where water is removed from the web by gravity, shear, and vacuum dewatering. Thus, considering possible applications it is important to understand the factors affecting the dewatering at the forming section so that water removal there can be maximized, and overall costs minimized. This is especially the case for highly refined furnishes or furnishes containing a large amount of MFC, which are difficult to dewater especially at the forming section where the included fibrils and fines lead to web sealing as described above.
Due to its importance, the dewatering process has been widely studied (Hubbe and Heitmann 2007; Ramaswamy 2003; Kalliokoski 2011; Hubbe et al. 2020). Recent research has focused on the dewatering of composite furnishes containing MFC or NFC (Rantanen et al. 2015; Sjöstrand et al. 2019; Ahadian et al. 2022). However, not much focus has been put on the dewatering of highly refined fibers, which, as described above, could be used as a substitute for MFC or in combination with it. Understanding the dewatering process of such furnishes is useful as the equipment needed for their application already exists on an industrial scale since conventional refiners and paper machines can be utilized.
This paper examines the dewatering process for highly refined furnishes at different refining levels. The goal is to understand the parameters affecting the dewatering rate and to identify the operating window on a pilot or production machine for such furnishes. The Schopper-Riegler (SR) values of the studied furnishes range from 43 to 97. Notice that SR97 is so high that it is, e.g., clearly outside the range of the AFT freeness conversion chart (AFT 2018), which ends at SR80. When identifying the operating window, certain limitations need to be taken into consideration. A pilot or production machine is limited to certain vacuum levels. Initially, the vacuum level must be kept very low to help minimize the air permeance, and the maximum vacuum level at the end of the former is tens of kPa. The dewatering time is also limited, since the former length is set, and the machine speed must be high enough for a profitable process.
In this article, the effects of the refining level (SR43, SR72, SR85, and SR97) on the dynamics of the dewatering process are investigated. First, the sheet former setup used for the dewatering measurements is described. Next, the effects of the refining level, basis weight, and vacuum level on the retention and the dewatering time are discussed. Then, the effect of these parameters on the time evolution of the water column height and the resistivity of the fiber web is analyzed. Finally, a linear resistivity model is applied to the resistivity data; the model is found to work reasonably well up to SR85.
EXPERIMENTAL
Materials
Furnishes
Three BHKP (eucalyptus) furnishes were made at the refining levels of SR43, SR85, and SR97. Moreover, SR72 furnish was made by mixing SR43 and SR85 furnishes at mass fractions of 60% and 40%, respectively. Furnish light microscopy images are shown in Fig. 1. In addition to increasing the fines content, increasing SR level led to higher fiber fibrillation and shorter fiber length. The furnish properties are shown in Table 1. The Schopper Riegler (SR) values were determined according to the ISO 5267-1 (2000) standard. The conversions between the CSF and SR values were performed using the AFT freeness conversion chart (AFT 2018). SR97 was clearly outside the freeness range presented in this chart. The fines content was determined using an L&W fiber tester plus (ABB AB/Lorentzen & Wettre, Kista, Sweden). Water retention value (WRV) was measured according to the ISO23714 (2014) standard. For SR97, the WRV could not be measured with this method, but it is likely between 3 and 4 (Ahadian et al. 2022). (In the ISO23714 (2014) standard, the suspension is put in a small cup that has a metal wire at its bottom. Then, a mild vacuum is made below the wire with a Büchner funnel. Next, the cup is placed in a centrifuge to continue the water removal. With SR97 the wire was blocked by the fines almost immediately and most of the water stayed in the suspension.)

Fig. 1. Light microscopy images of a) SR43, b) SR72, c) SR85, d) SR97
Table 1. The Properties of the Furnishes

Vacuum-assisted sheet former
The forming studies were performed with a vacuum-assisted sheet former (Lehmonen et al. 2020). This forming device (Fig. 2) has a larger sheet size (210 mm × 300 mm) and enables higher vacuum levels when compared to conventional sheet formers. Water removal can be performed with the device with vacuum levels between 5 and 70 kPa. Vacuum levels are thus comparable with those used in real paper machine forming sections. Valmet Forming Fabric GM (thread count 108 to 140) was used as the wire mesh.

Fig. 2. a) Schematic of the vacuum-assisted sheet former. b) The pulp chamber during mixing of the furnish by injected air. c) The wet sheet on the wire after forming.
At the beginning of processing, the water inlet valve was opened. The valve was kept open until the 10-L underside of the mold was full of process water and the acrylic mold was filled up to the level of 50 mm. The fibers were added as a fiber suspension to the mold, and the mold was filled with process water up to 200 mm level. Finally, before forming, the suspension was mixed by injecting air from below the wire (Fig. 2b).
During forming, a wet sheet was formed on the wire (Fig. 2c). At the end of the process, after the water column above the sheet had vanished, air flowed through the sheet a few seconds, and the solid content of the final sheet was of the order of 10%. After forming, the sample was collected for determination of retention. The sheet could also be pressed and dried for further analysis. In addition to the time evolution of vacuum, P(t), measured below the wire (Fig. 3a), the time evolution of the position of the fiber suspension surface, h(t), was measured with an ultra-sonic detector (Fig. 3b). Figure 3a shows that pressure under the wire reached its maximum value, Pmax, 0.2 s after the valve had been opened (at t = tP). The vacuum initially slightly overshot and oscillated before reaching a constant value. These tests reflect water removal dynamics taking place in a forming section before the waterline, after which air starts flowing through the filtered sheet.
In this study, the forming consistency ranged between 0.015 and 0.03% depending on the target basis weight and the furnish retention. Vacuum levels varied between 5 and 42 kPa. The furnish temperature was 20°C during forming. At this temperature, the viscosity of water is 1.0 mPas.

Fig. 3. a) Measured pressure under the wire during forming. b) Measured height of the fiber suspension column during forming. c) Velocity of the suspension surface calculated from the height data. d) Resistivity of the filtered sheet calculated from Eq. 5. In this case basis weight was 30 g/m2 and the SR level was 85 (Trial point 22 in Table 2).
Trial points
An overview of the trial setup for the study is shown in Table 2. The parameters included in the table are SR level, basis weight (BWsheet), vacuum level (P) and water removal time (T). With SR43, SR72, and SR97 two forming measurements and with SR85 three forming measurements were performed for each trial point. In Table 2 the values of P and T are averages over the successive measurements. Notice that the pressure levels were not identical for different SR levels. For SR97, water removal times are shown for all measurements, as T was clearly higher with the second run due to the fines clogging the wire very efficiently (the first measurements were always performed with a clean wire). With other furnishes, water removal times were similar with successive measurements.
Table 2. Trial Setup for the Study

Methods
The resistivity of the filtered sheet during forming
The flow of water through a filtered sheet is usually described by Darcy’s law (Bear 1972), as follows,
 (1)
(1)
where v is the superficial velocity of water, µ is the water dynamic viscosity, P is the pressure difference over the sheet, L is the thickness of the sheet, and k is the sheet permeability. Equation 1 neglects inertial effects, which usually play a minor role in the flow through fibre sheets (Wildfong et al. 2000).
In practice, determination of the thickness of the fiber sheet is very challenging during the filtering process (Kataja and Hirsilä 2001; Paradis et al. 2002). In such a case Darcy’s law (Eq. 1) can be written in the form,
 (2)
(2)
where D is the drainage resistance of the sheet. If the basis weight is known, Eq. 2 can be written in the form (Ingmansson 1952; Ingmansson and Whitney 1954; Ramaswamy 2003, Roux and Rueff 2012),
 (3)
(3)
where BW is the basis weight, and
 (4)
(4)
is the resistivity of the filtered sheet. (Notice that between the permeability k and resistivity K there is the relation  , where
  is the density of the fibers in the filtered sheet.)
In the vacuum-assisted sheet former, one has to take into account both the flow resistance, R, due to the wire and the porous plate supporting it, and the hydrostatic pressure of water, ρgh. In this case, the velocity during the forming process is at time t
 (5)
(5)
Model for the resistivity K
Sayegh and Gonzales (1995) studied fluid flow through pre-formed sheets made from various paper-making furnishes with vacuum levels up to 35 kPa. They found that the resistivity of a fiber sheet could be described with good accuracy using Eq. 6,
 (6)
(6)
where I is the pressure impulse density,
 (7)
(7)
and β, α, and ɣ are pulp-dependent material parameters. The model assumes that the sheet behaves as a first order approximation like a viscoelastic Maxwell material, wherein the elastic behaviour of the sheet is reflected in the term ![]() and the plastic behaviour in the term
and the plastic behaviour in the term ![]() . The parameter
. The parameter ![]() is called the zero-pressure resistivity of the furnish.
is called the zero-pressure resistivity of the furnish.
Koponen et al. (2015) showed that the resistivity at the end of the filtering process could be described well with Eq. 6. However, the obtained very small and negative values of γ for some furnishes suggested that Eq. 6 might need to be modified. Koponen et al. (2016) suggested for resistivity the modified formula, as follows:
 (8)
(8)
Here
 (9)
(9)
is a term that takes into account the different impulse histories of sheet fiber layers (c is the consistency of the pulp). In the work of Koponen et al. (2016), Eq. 8 gave values for γ similar to (Sayegh and Gonzales 1995) for various furnishes having SR levels between 15 and 40, basis weights between 80 and 570 g/m2, and vacuum levels between 5 and 70 kPa. The model also predicted in Koponen et al. (2016) the consistency development of an NSSC furnish in a Fourdrinier pilot machine with a reasonable accuracy up to the waterline. In the present work, likely due to lower basis weights, Eq. 8 gave only slightly different model parameters to Eq. 6. Thus, Eq. 6 was used as the model of sheet resistivity.
RESULTS AND DISCUSSION
Retention
Retention was over 95% for SR43 and SR72 and over 90% for SR85. For these furnishes, the correct dosage of the furnish could be obtained with a few test sheets. However, for SR97 retention was lower and strongly dependent both on the basis weight and the vacuum level (Fig. 4). Finding the correct amount of SR97 furnish was thus challenging, and the basis weights of the final SR97 sheets varied somewhat.
As can be seen below (e.g. Fig. 18), retention was approximately constant during the filtering process for SR43 and SR72. With SR85 retention was initially slightly lower, especially with higher vacuum levels and lower basis weights. SR97 behaved very differently: retention was initially much lower than in the later parts of the process.
In Fig. 4, the retention of SR97 decreased strongly with an increasing vacuum level due to the stress forces becoming strong enough to deform the flexible fines and fibrils to fit into the pores of the wire and the filtered sheet. The clearly improved retention with an increasing basis weight is likely due to SR97 having a critical basis weight of the filtered sheet, after which the retention clearly improves (see Fig. 7 and explanations therein).
A regression analysis was performed for SR97 in which retention, RET (expressed in %), was the dependent variable. The basis weight (BW, g/m2) and vacuum (P, kPa) were the independent variables. The following power law type formula worked very well:
 (10)
(10)
Table 3 shows the obtained values for the regression coefficients a, b, and c.

Fig. 4. Retention of the SR97 furnish as a function of basis weight for three vacuum levels. (This figure also shows the retention for test points that are not included in Table 2.)
Table 3. Regression Coefficients of Regression Analysis for Retention of SR97 Furnish

Water Removal Time
Figure 5 shows the water removal time as a function of the sheet basis weight for different SR levels. The vacuum levels have been indicated in Fig. 5 with color coding. Water removal time obviously increased with increasing basis weight, decreased with increasing vacuum level, and increased strongly with an increasing SR value. With a higher SR level, there is more solid surface area in the filtered sheet that causes viscous friction to the flow. Moreover, there are more fines that can travel and clog pores in the wire and the filtered sheet.
A regression analysis was performed separately for each SR level, for which the dependent variable was the water removal time (T, seconds). The basis weight (BW, g/m2) and the vacuum level (P, kPa) were the independent variables. A power law type model worked very well. The regression formula can be described by Eq. 11,
 (11)
(11)
where a, b, and c are the regression parameters. Table 4 shows the obtained values of the parameters.
Table 4 shows that power b increased with increasing SR value. The dependence of the water removal time on the basis weight was linear for SR43. For SR85 and SR97, the basis weight dependence was quadratic. SR72 with b = 1.6 was in a transient zone between linear and quadratic behaviour. For SR43, SR72, and SR85 the water removal time was approximately inversely related to the square root of P. This indicates that the sheet became compressed significantly during the process. For SR97 water removal time was almost inversely related to P. This is likely due to very poor retention at the beginning of the filtering, especially with higher vacuum levels, which leads to a very rapid initial water removal rate.

Fig. 5. Water removal time of the four furnishes as a function of basis weight for different vacuum levels (color-coded)
Table 4. Regression Coefficients of Regression Analysis for Water Removal Time of Different Furnishes

Suspension Column Height as a Function of Time
Figure 6 shows the suspension column height as a function of time for a) low and b) high vacuum levels. The basis weight was here 40 g/m2, but the curves were similar for other basis weights. The water removal time increased strongly with an increasing SR level. The shape of the curves was similar for SR43, SR72, and SR85; height decreased approximately exponentially as a function of time. SR97 behaved very differently. Initially, during the first second of forming, height decreased very quickly, and the SR97 curve followed the SR43 and SR72 curves being below the SR85 curve. Then the flow speed decreased significantly and the water removal time of SR97 was finally much lower than for the other furnishes.

Fig. 6. Measured height as a function of time for different SR levels. Basis weight is ca. 40 g/m2. a) Low vacuum level; b) High vacuum level
Figure 7 shows that the shapes of the SR97 height curves were similar with different basis weights and vacuum levels. In all cases there seemed to be an inflection point, shown with a red circle, at which the forming dynamics changed. This was likely due to a strong change in retention. Initially, retention was very low and most of the SR97 fibrils traveled through the wire – the growth of the filtered sheet was slow and was mainly due to the longest fibrils. When the filtered sheet reached a critical basis weight BWcr, which was dependent on the vacuum level, retention clearly improved and the water flow through the wire slowed down significantly.

Fig. 7. Measured suspension column height as a function of time for SR97. The red circles show the locations of the inflection points, where the forming dynamics changes.
A regression analysis was performed where the total height change Δh (expressed in millimeters) by the inflection point was the dependent variable. The basis weight calculated from the fiber dosage (BWini, g/m2) and vacuum (P, kPa) were the independent variables. It was found that the following regression formula worked very well:
 (12)
(12)
Table 5 shows the obtained values for the regression coefficients a, b, and c. Δh increased with an increasing vacuum level due to decreasing retention (Eq. 10). Δh was approximately inversely related to BWini. This supports the hypothesis suggested above that retention started to increase significantly when the filtered sheet had reached a critical basis weight.
Table 5. Regression Coefficients of Regression Analysis for of SR97 Furnish

Drainage Resistance
Figure 8 shows examples of drainage resistance D, calculated from Eq. 2, as a function of removed water in millimeters, Δhr, and time, for different SR levels. The drainage resistance of SR97 was initially below that of SR85. The curves of SR43, SR72, and SR85 differed qualitatively from SR97. Unlike the other curves, the SR97 curve consisted of two regions with a similar slope and of a transition zone between them where the drainage resistance increased rapidly. In Figure 9 some drainage resistance curves are shown for SR97 with different vacuum levels. Figure 9a shows that the transition zone started with higher Δhr when the vacuum level increased. The explanation is the decrease in retention with higher vacuum levels.

Fig. 8. a) Drainage resistance D, calculated from Eq. 2, as a function of a) removed water, and b) time for different SR levels. Basis weight is ca. 40 g/m2 and vacuum level is ca. 40 kPa.

Fig. 9. a) Drainage resistance D, calculated from Eq. 2, as a function of a) removed water, and b) time for different vacuum levels of SR97. Basis weight is ca. 40 g/m2.
Resistivity
Equation 3 was used to calculate the time evolution of the resistivity K of different furnishes (Fig. 3d). The velocity v(t) was obtained from the measured h(t)-curve by numerical differentiation (Fig. 3b and Fig. 3c). The basis weight of the filtered sheet during forming was estimated as follows,
 (13)
(13)
where is the basis weight of the final sheet. It was thus assumed that retention was constant during the filtering process. This assumption worked very well for SR43 and SR72, and reasonably well for SR85. However, for SR97 it was a significant simplification, and the calculated resistivities were rough approximations.
When calculating the resistivity, the measured vacuum, P(t), and height, h(t), were replaced with their spline-fitted versions to decrease the noise level in the experimental data. A spline fit was made for the measurement points with 5 mm < h < 190 mm. Points outside this region were omitted in the resistivity analysis. The flow resistance of the wire and the porous plate was estimated to be R = 3 × 10⁶ 1/m. Its effect on the total flow resistance was thus negligible.
The resistivity curves are shown for all the trial points in Figs. 10 to 13. Notice that the curves with the same colour (i.e. the same vacuum level) didn’t completely overlap due to experimental uncertainties and different BW-dependent suspension consistencies.
Figures 10 and 11 show the resistivity as a function of time and the basis weight of the filtered sheet for SR43 and SR72, respectively. Resistivity increased with increasing vacuum levels due to the compression of the sheet. Experiments with different sheet basis weights (BWsheet) overlapped quite well. With t < 0.5 s the shape of the curves was due to the pressure profile being initially not constant (see Fig. 1c). After this transient region resistivity increased slightly with time. In the end, the resistivity of SR72 was ca. 3 times higher than that of SR43.

Fig. 10. a) Resistivity as a function of basis weight, and b) resistivity as a function of time for the SR43 furnish

Fig. 11. a) Resistivity as a function of basis weight, and b) resistivity as a function of time for the SR72 furnish
Figure 12 shows the resistivity for SR85. As the water removal time was higher, the resistivity of SR85 increased due to plastic compression during forming much more than for SR43 and SR72. For the highest vacuum level, the increase was 7-fold. At the end of forming, the resistivity of SR85 was ca. 7 times higher than that of SR72.

Fig. 12. a) Resistivity as a function of basis weight, and b) resistivity as a function of time for the SR85 furnish
The resistivity curves of SR97 are shown in Fig. 13. During forming the resistivity of SR97 increased by two orders of magnitude and it was one order of magnitude higher than for SR85. Notice that the initially very low retention of SR97 made the resistivity values very inaccurate, especially with lower basis weights. In Fig. 13a, the alignment of the resistivity curves was very different from the curves of the other SR levels. The basis weight in the resistivity calculations was too high in the earlier part of the forming and the calculated resistivity of the sheet was too low.

Fig. 13. a) Resistivity as a function of basis weight, and b) resistivity as a function of time for the SR97 furnish.
Table 6. The Coefficients of the Model Eq. 6 for the Different SR Levels

Model for Resistivity
As discussed above, Eq. 6 was chosen as the model of the sheet resistivity. The model was fit to the data points where t > tP ∼ 0.4 s (i.e., after the vacuum level had reached its maximum value). Table 6 shows the coefficients β, α, and ɣ of the model for the different SR levels. β and ɣ increased rapidly with an increasing SR level. For SR43 and SR73, the model described the dependence of resistivity on the vacuum level and pressure impulse density very well during the whole forming process. During the first 1-2 seconds of forming SR85 had some nonlinearity in the dependence of resistivity on the pressure impulse. In this region, the fitted model somewhat overestimated the resistivity. For SR97 the dependence of resistivity on the pressure impulse was clearly nonlinear. Moreover, as retention varied a lot during forming, the model coefficients of SR97 should be taken only as order of magnitude estimates.
Figure 14 shows the parameters β, α, and ɣ of the resistivity model as a function of total fines content obtained from Table 1. The relation between parameters β and ɣ and the total fines content was with a very good accuracy an exponential function, i.e.,
 (14)
(14)
where FC is the total fines content in percentages and a and b are the fitting parameters (Table 7).

Fig. 14. Resistivity model parameters β, α, and ɣ as a function of total fines content. The dashed line shows a fit of function y = a exp(bx) to the data (the values of parameters a and b are shown in Table 7).
Table 7. The Fitting Parameters of Eq. 14

To analyze the accuracy of the resistivity model, Eq. 4 was solved iteratively for SR43, SR72, and SR85. The measured pressure profile, sheet basis weight, wire and porous plate resistivity, and the model parameters of Table 6 were taken as input. Figures 15 and 16 show the results for SR43 and SR72, respectively. The model predicted the water removal dynamics in both cases with good accuracy. The results of SR85 are shown in Fig. 17. In this case, the water removal rate was initially higher than the prediction of the model, but the result was still rather good. Likely, the retention of SR85 was initially lower, and water flowed through the sheet easier than the model predicted. Due to retention decreasing with an increasing vacuum level the difference between the measured and modelled curve is higher in Fig. 17b than in Fig. 17a. The results of SR97 are not shown, as the present resistivity model assumes that retention is constant. The resistivity model could, however, be used for very rough estimates of the SR97 forming process – typically the modelled water removal time was two times higher than the measured value.

Fig. 15. Comparison of measured (black line) and simulated (red line) suspension height as a function of time for SR43 with a) low and b) high vacuum level. Basis weight is 40 g/m2.

Fig. 16. Comparison of measured (black) and simulated (red) suspension height as a function of time for SR72 with a) low vacuum level and b) high vacuum level. Basis weight is 40 g/m2.

Fig. 17. Comparison of measured (black) and simulated (red) suspension height as a function of time for SR85 with a) low vacuum level and b) high vacuum level. Basis weight is 40 g/m2.
Time Evolution of Retention
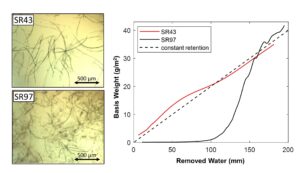
The basis weight of the filtered sheet during the filtering process was estimated, given by the resistivity model, by combing the measured pressure and height profiles, Eqs. 4 and 6, and the parameters of the resistivity model (Table 6). Figure 18 shows the development of the basis weight as a function of removed water for different SR levels for basis weight of ca. 40 g/m2 and a vacuum level of ca. 40 kPa. This analysis confirms the retention behaviour of the different furnishes discussed above: The retention of SR43 and SR72 was approximately constant; for SR85 retention was smaller during the first half of the forming process than during the second half; for SR97 retention was very low during the first half of the process and started to increase at the inflection point of the height-time curve shown in Fig. 7. As was discussed above, the stress forces due to flow deformed the flexible SR97 fines and fibrils to fit into the pores (of the wire and the filtered sheet) and retention was initially low. When the basis weight of the filtered sheet reached the critical level, retention strongly improved.

Fig. 18. Basis weight as a function of removed water for different SR levels. The trial points are the same as in Figure 6. The basis weight is ca. 40 g/m2 and the vacuum level is ca. 40 kPa.
Discussion
In a real forming section, the slice opening is of the order of one centimeter. Moreover, the operation temperature is ca. 35 °C and the viscosity is thus 30% smaller than in this study. With these parameters, and with the assumption that the real water removal time is 50% smaller than the modelled value, one can roughly estimate how long the water removal would take for the SR97 furnish from the slice opening to the water line with different vacuum levels. With 30 g/m2 basis weight, e.g., the estimated water removal times are of the order of 3, 1.5, and 1 s for the vacuum levels of 10, 25, and 40 kPa, respectively. In real life, the initial water removal is improved by the impingement of the jet on the wire and by the hydrofoils (Hubbe et al. 2020). In contrast, water removal must be continued after the waterline to raise the sheet dryness high enough for the press section. As the length of a Fourdrinier forming board is typically about 10 m and it is rarely longer than 20 m (Liebeler et al. 1987), the machine speed must be kept rather low for the SR97 furnish, which decreases the profitability of the process. Other challenges are the strong wire-clogging tendency and the complex behaviour of retention which could be sources of process instabilities.
Ongoing pilot-scale work has shown that the water removal timescales discussed above are realistic. While the highly refined furnishes present a challenge for standard forming sections, they can be successfully formed with carefully chosen process parameters.
CONCLUSIONS
- Water removal time increased significantly with increasing degrees of Schopper-Riegler (SR value). (For instance, with a vacuum level of ca. 40 kPa and a basis weight of ca. 40 g/m2: SR43 ~ 1 s, SR72 ~ 2 s, SR85 ~ 10 s, SR97 ~ 100 s.)
- Retention was approximately constant during forming of SR43 and SR72. For SR85 retention was initially slightly lower. For SR97 retention was initially very low.
- The SR97 fines clogged the wire very efficiently, and the wire had to be changed after each measurement.
- Due to very low retention, water removal was initially (during the first 1 to 2 seconds) very quick for SR97, even more so than for SR85. More than 50% of water was removed during this phase of forming. Water removal then slowed down significantly when retention started to improve.
- The resistivity model Eq. 6 worked very well for SR43 and SR72 and reasonably well for SR85. For higher SR levels a retention model is needed before the model can be used for accurately predicting water removal in real-life applications.
- There was an exponential relation between the resistivity model parameters β and ɣ and the total fines content.
- Highly refined furnishes present a challenge for standard forming sections.
REFERENCES CITED
AFT (2018). “Pulp freeness conversion chart,” (https://aft-global.com/en/resources/pulp-freeness-conversion-chart), Accessed 18.12.2022.
Ahadian, H., Sharifi Zamani, E., Phiri, J., Coelho, M., and Maloney, T. (2022). “Sheet sealing in single and multilayer nanopapers,” Cellulose 29, 7663-7676. DOI: 10.1007/s10570-022-04751-y
Balea, A., Fuente, E., Concepcion Monte, M., Merayo, N., Campano, C., Negro, C., and Blanco, A. (2020). “Industrial application of nanocelluloses in papermaking: A review of challenges, technical solutions, and market perspectives,” Molecules 25, 526. DOI: 10.3390/molecules25030526
Bear, J (1972). “Dynamics of fluids in porous media,” Dover, New York.
Chen, G., Yu, H., Zhang, C., Zhou, Y., and Yao, J. (2016). “A universal route for the simultaneous extraction and functionalization of cellulose nanocrystals from industrial and agricultural celluloses,” J. Nanoparticle Res. 18(2), 48. DOI: 10.1007/s11051-016-3355-8
Chen, H., Park, A., Heitmann, J., and Hubbe, M. (2009). “Importance of cellulosic fines relative to the dewatering rates of fiber suspensions,” Ind. Eng. Chem. Res. 48(20), 9106–9112. DOI: 10.1021/ie9006613
Das, A., Islam, M., Ashaduzzaman, M., and Nazhad, M. (2020). “Nanocellulose: Its applications, consequences and challenges in papermaking,” Journal of Packaging Technology and Research. 4(3). DOI: 10.1007/s41783-020-00097-7
Fischer, W., Mayr, M., Spirk, S., Reishofer, D., Jagiello, L., Schmiedt, R., Colson, J., Zankel, A., and Bauer, W. (2017). “Pulp fines—Characterization, sheet formation, and comparison to microfibrillated cellulose,” Polymers 9(8), 366. DOI: 10.3390/polym9080366
Hubbe, M. (2002). “Fines management for increased paper machine productivity,” Proc. Sci. Tech. Advan. Wet End Chemistry, Pira, Barcelona, May 22-23, 2002.
Hubbe, M., and Heitmann, J. (2007). “Review of factors affecting the release of water from cellulosic fibers during paper manufacture,” BioResources 2(3), 500-533. DOI: 10.15376/BIORES.2.3.500-533
Hubbe, M., Tayeb, P., Joyce, M., Tyagi, P., Kehoe, M., Dimic-Misic, K., and Pal, L. (2017). “Rheology of nanocellulose-rich aqueous suspensions: A review,” Bioresources 12(4), 9556-9661. DOI: 10.15376/biores.12.4.Hubbe
Hubbe, M., Sjöstrand, B., Nilsson, L., Koponen, A., and McDonald, J. (2020). “Rate-limiting mechanisms of water removal during the formation, vacuum dewatering, and wet-pressing of paper webs: A review,” Bioresources 15(4), 9672-9755. DOI: 10.15376/biores.15.4.Hubbe
Ingmanson, W. (1952), “An investigation of the mechanism of water removal from paper slurries,” TAPPI Journal 35(10), 439-448.
Ingmanson, W., and Whitney, R. (1954). “The filtration resistance of pulp slurries,” TAPPI Journal 37(11), 523–533.
Kalliokoski, J. (2011). Models of Filtration Curve as a Part of Pulp Drainage Analyzers, Ph.D. Dissertation, University of Oulu.
Kataja, M., and Hirsilä, P. (2001). “Application of ultrasound anemometry for measuring filtration of fibre suspensions,” The Science of Papermaking, Trans. of the XIIth Fund. Res. Symp. Oxford, 2001, (C.F. Baker, ed.), pp. 591-604, FRC, Manchester, 2018.
Koponen, A., Haavisto, S., Liukkonen, J., and Salmela, J. (2015). “Analysis of the effects of pressure profile, furnish, and microfibrillated cellulose on the dewatering of papermaking furnishes,” TAPPI Journal 14(5), 325-337. DOI: 10.32964/TJ14.5.325
Koponen, A., Haavisto, S., Liukkonen, J., and Salmela, J. (2016). “The flow resistance of fiber sheet during initial dewatering,” Drying Technology 34(12), 1521-1533. DOI: 10.1080/07373937.2015.1132427
Lavoine, N., Desloges, I., Dufresne, A., and Bras, J. (2012). “Microfibrillated cellulose – Its barrier properties and applications in cellulosic materials: A review,” Carbohydrate Polymers 90(2), 735-764. DOI: 10.1016/j.carbpol.2012.05.026
Lehmonen, J., Retulainen, E., Paltakari, J., Kinnunen-Raudaskoski, K., and Koponen, A. (2020). “Dewatering of foam-laid structures and formed web properties,” Cellulose 27(3), 1127-1146. DOI: 10.1007/s10570-019-02842-x
Liebeler, S., Brunsdale, A., Stern, P., Eckes, A., Lodvick, S., and Rohr, D. (1987). “Certain papermaking machine forming sections for the continuous production of paper,” 1949 (Investigation No. 337-TA-147), 1987.
Lindqvist, H., Salminen, K., Kataja-aho, J., Retulainen, E., Fardim, P., and Sundberg, A., (2012). “The effect of fibre properties, fines content and surfactant addition on dewatering, wet and dry web properties,” Nordic Pulp and Paper Research Journal 27(1), 104-111, DOI: 10.3183/npprj-2012-27-01-p104-111
Nechyporchuk, O., Belgacem, M., and Bras, J. (2016). “Production of cellulose nanofibrils: A review of recent advances,” Industrial Crops and Products 93, 2-25. DOI: 10.1016/j.indcrop.2016.02.016
Ramaswamy, S. (2003). “Vacuum dewatering suring paper manufacturing,” Drying Technology 4(4), 685-717. DOI: 10.1081/DRT-120019058
Rantanen, J., Dimic-Misic, K., Pirttiniemi, J., Kuosmanen, P., and Maloney, T. (2015). “Forming and dewatering of a microfibrillated cellulose composite paper,” BioResources 10(2), 3492-3506. DOI: 10.15376/biores.10.2.3492-3506
Roux, J., and Rueff, M. (2012). “Characterization of the fiber–water separation process through a suction box of a single-wire pilot paper machine,” Separation and Purification Technology 92, 136-142. DOI: 10.1016/j.seppur.2011.07.034
Paradis, M., Genco, J., Bousfield, D., Hassler, J., and Wildfong, V. (2002). “Determination of drainage resistance coefficients under known shear rate,” TAPPI Journal, August 2002. 12-18.
Shafei-Sabet, S., Martinez, M., and Olson, J. (2016). “Shear rheology of micro-fibrillar cellulose aqueous suspensions,” Cellulose 23:5, 2943-2953. DOI: 10.1007/s10570-016-1040-9
Sayegh, N., and Gonzalez, T. (1995). “Compressibility of fibre mats during drainage,” Journal of Pulp and Paper Science 21(7), 255-261.
Sjöstrand, B., Barbier, C., Ulkten, H., and Nilsson, L. (2019). “Dewatering of softwood kraft pulp with additives of microfibrillated cellulose and dialcohol cellulose,” BioResources 14(3), 6370-6383. DOI: 10.15376/biores.14.3.6370-6383
Su, J., Mosse, W., Sharman, S., Batchelor, W., and Garnier, G. (2013). “Effect of tethered and free microfibrillated cellulose (MFC) on the properties of paper composites,” Cellulose 20, 1925-1935. DOI: 10.1007/s10570-013-9955-x
Tripattharanan, T. (2003). Effect of Different Forming Regimes on Retention Aid Programs (PPJ Studies), Master’s Thesis, North Carolina State University, Raleigh, NC.
Wildfong, V., Genco, J., Shands J., and Bousfield, D. (2000). “Filtration mechanics of sheet forming. Part II: Influence of fine material and compression,” Journal of Pulp and Paper Science 26(8), 280-283.
Article submitted: November 11, 2022; Peer review completed: December 3, 2022; Revised version received and accepted: December 19, 2022; Published: January 4, 2023.
DOI: 10.15376/biores.18.1.1398-1419