
Abstract
Many environmental advantages of wood in buildings have been thoroughly documented; however, this material’s effects on occupants are not well known or fully comprehended. This research aims to study comfort parameters in a multifunctional room characterised by extensive wood surfaces in comparison with a similar room with more conventional surfaces at Laval University, Quebec, Canada. The objectives of this research focus on determining the thermal, visual, and acoustical similarities and differences between two rooms using on-site surveys. Analysis of instrumental measurements and images of each room’s indoor environment under overcast skies determined the colour and texture of the surfaces. Quantitative and qualitative analyses revealed that both rooms share similar thermal and acoustic comfort parameters, but have contrasting visual characteristics. The colour, knots, and grain of the wood contributed to producing visually warm experiences resulting in a yellowish room, whereas a mix and match of artificial finishes generates a colder, bluish ambiance in the other room. The conclusion suggests that architects and designers should consider the indoor use of wood for its unique visual ambiances that enhance comfort levels.
Download PDF
Full Article
Wood and Comfort: A Comparative Case Study of Two Multifunctional Rooms
Mélanie Watchman,* André Potvin, and Claude M. H. Demers
Many environmental advantages of wood in buildings have been thoroughly documented; however, this material’s effects on occupants are not well known or fully comprehended. This research aims to study comfort parameters in a multifunctional room characterised by extensive wood surfaces in comparison with a similar room with more conventional surfaces at Laval University, Quebec, Canada. The objectives of this research focus on determining the thermal, visual, and acoustical similarities and differences between two rooms using on-site surveys. Analysis of instrumental measurements and images of each room’s indoor environment under overcast skies determined the colour and texture of the surfaces. Quantitative and qualitative analyses revealed that both rooms share similar thermal and acoustic comfort parameters, but have contrasting visual characteristics. The colour, knots, and grain of the wood contributed to producing visually warm experiences resulting in a yellowish room, whereas a mix and match of artificial finishes generates a colder, bluish ambiance in the other room. The conclusion suggests that architects and designers should consider the indoor use of wood for its unique visual ambiances that enhance comfort levels.
Keywords: Comfort; Indoor environmental quality; Visual perception; Building materials; Wood
Contact information: School of Architecture, Laval University, 1 Cote de la Fabrique, Quebec, G1K 7P4, Canada; *Corresponding author: melanie.watchman.1@ulaval.ca
INTRODUCTION
As a natural building material with unique features, wood is visually appealing and has the potential to contribute to occupants’ well-being. In comparison with other building materials, wood is comfortable for the eyes because it absorbs rather than reflects ultraviolet light (Masuda 1992). Its range of colours, knots, and grains carries a symbolic value that produces different psychological responses across cultures. In North America, wood in the yellow-red colour hue is often associated with the perception of warmth, while the presence of knots creates a natural and rustic appearance (Rice et al. 2006). In an increasingly urban society, which often isolates people from the outside world, it is becoming ever more important to bring more natural elements, such as wood, into the modern built environment. Biophilic design, which relates to an innate attraction humans have for “life and life-like processes” (Wilson 1984), integrates this principle in architecture by connecting humans with nature.
The psychophysiological effects of natural elements such as wood have been demonstrated by recent studies. Over the course of a school year, Kelz et al. (2011) found that secondary school pupils’ heart rates significantly decreased in a classroom with solid wood furnishings but significantly increased in a control classroom with standard materials demonstrating that the use of solid wood in classrooms can reduce pupils’ stress levels. Sakuragawa et al. (2005) compared the psychological and physiological effects of viewing either a wooden or white steel wall. The blood pressure of participants who preferred it when wood was used as a finishing material dropped considerably when they faced the wooden wall, but the blood pressure of those who disliked wood as a building material was not affected. The total architectural experience is much more complex, encompassing such elements as time, light, colour, texture, and material (Holl et al. 2006). Good design and use of favourable materials in architecture appeals to sensory perceptions, whereas each sense enriches the understanding of space. The presence of wood surfaces can be studied with various 3D numerical simulation tools, but only in situ surveys in actual spaces can describe the positive effects of wood with accuracy. In a comparison of six wooden spaces within the Gene-H.-Kruger building (Quebec City) under different sky conditions, Jafarian et al. (2016) concluded that increasing the amount of wooden surfaces lowered contrasts and shadows and increased luminance values, thus enhancing the visual comfort levels of the occupants. Adekunle and Nikolopoulou (2016) studied occupant thermal satisfaction and the indoor thermal conditions of two residential wooden buildings in the UK. Summertime overheating can lead to occupant discomfort, and this case study indicated a higher risk in timber buildings due to their lack of thermal mass in comparison to other buildings materials such as bricks. Although designers and architects generally assume the positive impacts and preferences for wood, specific research on the effects of wood in existing buildings remains limited and has not combined visual, thermal, and acoustic comfort. This research therefore addresses the impacts of wood in the built environment in relation to comfort, a fundamental building attribute. Considering that “every touching experience of architecture is multi-sensory” (Pallasmaa 2005), notions of thermal, acoustic, and visual comfort should be equally studied.
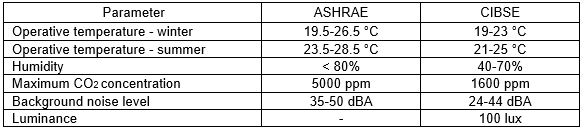
Architectural, climatic, psychological, social, and cultural parameters influence occupant comfort and the physical variables that contribute to it. This paper focuses on understanding the effects and influences of interior wood surfaces on comfort levels in the built environment. As a complex phenomenon difficult to measure directly, comfort tends to be “operationally defined as the absence of discomfort” (Brager and de Dear 2003), which is more readily acknowledgeable and measurable. Discomfort focuses on the physical variables that influence comfort, such as air temperature, humidity, background noise, and luminance levels. The building industry provides standards to avoid occupant discomfort. The parameters measured in this study are discussed according to comfort standards defined by the authorities on building services engineering: American Society of Heating, Refrigerating and Air-Conditioning Engineers (ASHRAE) and the Chartered Institution of Building Services Engineers (CIBSE). The comparison with both standards results from slightly diverging comfort parameters between the American standard setter and its European counterpart.
The objective of this research was to determine the impact wooden spaces have on comfort levels by quantitatively and qualitatively comparing thermal, acoustical, and visual parameters in the wood and non-wood rooms. The research compares comfort parameters in two similar rooms, one of which contains a variety of wood finishes while the other consists of other finishes. The quantitative analysis consists of measuring the indoor temperature, humidity, carbon dioxide, sound, and luminance values in both rooms. The qualitative analysis compares colour temperatures as well as material textures in the interior spaces. The research hypothesis suggests that knowing the impacts wooden spaces generate on comfort levels should contribute to increasing the use of wood in architecture.
EXPERIMENTAL
Case Study Rooms
This study comprises an investigation of two multifunctional rooms with different interior surface finishes at Laval University in Quebec City. It is acknowledged that in comparing rooms, additional variables, such as contrasting room heights, window areas, and construction years, may influence the quality of the indoor environment and therefore potentially compromise some of the findings. Building features along with personal characteristics and work-related variables can influence occupant satisfaction despite their distinction from traditional indoor environmental quality (IEQ) parameters (Schiavon and Altomonte 2014). Given the difficulty of identifying identical rooms in all of the above aspects and within close proximity, the focus of this analysis centred on comparing a multifunctional room with abundant interior wood finishes and a similar room with limited wood finishes.
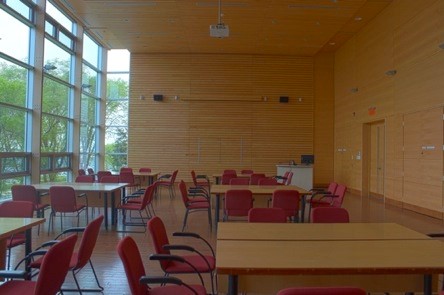
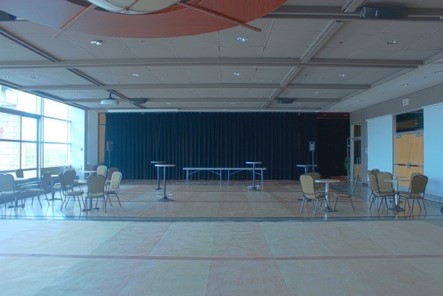
Fig. 1. Photographs of wood room (left) and non-wood room (right) from viewpoint 2 (see Fig. 3)
The selected rooms show similarities in terms of typology and uses. Both multifunctional spaces are rectangular with a unilateral window-wall daylighting system facing north-west (Fig. 1). They are both accessed through two sets of double doors located opposite from the windows. The wood room (87% indoor wood finishes) is located on the second floor of the Gene-H.-Kruger Pavilion. It was built in 2004 as an extension of Laval University’s Faculty of Forestry, Geography, and Geomatics. This 204-m2 room has a height of 5.4 m and a window area of 96.7 m2 (Table 1).
Table 1. Characteristics of the Wood and Non-Wood Multifunctional Rooms
The area of operable windows is 9.0 m2, but the handles have been removed, making them inoperable. The indoor environment in this room was compared with a non-wood room (less than 3% indoor wood finishes) located on the fourth floor of the Alphonse-Desjardins Pavilion. Various university services and associations have occupied this pavilion since its construction in 1996. The 238-m2 room is 3.4 m high, and the window area is 42.7 m2. This room does not have any operable windows, and the glass doors (6.2 m2) that enable access to an exterior terrace are kept locked.
The composition of interior finishes of the two rooms differs in many ways. In the wooden multi-purpose room of the Gene-H.-Kruger building, decorative yellow birch panels (Betula alleghaniensis Britt.) cover the long interior wall. Yellow birch slats decorate the ceiling and the narrower walls, whereas sugar maple boards (Acer saccharum) cover the floor. The ratio of the area finished with wooden material to the whole area of the ceiling, walls, and floor is 87%. In contrast to the wood room, the colour and texture of the finishes in the non-wood room are diverse. In the non-wood room of the Alphonse-Desjardins building, a dominant beige and orange linoleum floor includes red and black linear inserts. White perforated steel panels act as an acoustic ceiling. The gypsum walls are painted light grey, and a black curtain conceals a food preparation space on one side of the room. A retractable partition in polyvinyl chloride (PVC) with a black frame acts as a wall on the opposite side. The wall separating the room from the corridor contains aluminium-framed windows surrounding one of the sets of double doors. Glossy yellow wood panels enclose the second set of double doors. The wood ratio in this room is less than 3%.
Methods
Instrumental and photographic survey measurements of the interior environmental parameters were taken in both multifunctional rooms. The instrumental survey tools involved the following instruments: a laser thermometer (IR Thermometer – 62max+, FLUKE, Everett, USA) for surface temperatures; a thermal anemometer (Environmental Meter EN100, Extech Instruments by FLIR Systems Inc., Nashua, USA) that measures air temperature, humidity, air speed, and luminance levels; and a thermo-hygro-NDIR CO2 meter (TES Electrical Electronic Corp., Taipei, Taiwan) for carbon dioxide concentrations. The SoundMeter application for iPhone/iPad/iPod touch (Faber Acoustical LLC., Lehi, USA) recorded background noise levels in the rooms. Amongst the many Smartphone sound measurement applications, SoundMeter is the most appropriate for general purpose noise measurements using A-weighted data (Kardous and Shaw 2014). A thermal imaging infrared camera (FLIR b50, FLIR Systems Inc., Boston, USA) documented temperatures of the materials in combination with visual images.
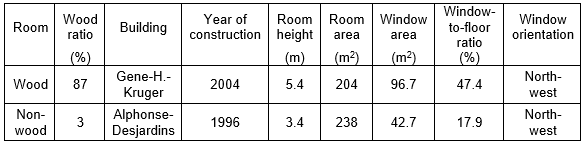
Fig. 2. Exposure parameters for Photolux photoluminance meter using HDR images
Photographic surveys were performed using two different instruments to collect data; the visual appearance of surface finishes used a Canon EOS Rebel T3i (Canon Inc., Japan), whereas daylighting data were obtained from a Photlux photoluminance meter system (Soft Energy SARL, Villeurbanne, France) paired with a Canon EOS 5D camera mounted with a fisheye lens to produce luminance maps covering the entire field of view. Photoluminance data analysis of both rooms using the Photlux system requires combining seven images with different exposure settings into a High Dynamic Range (HDR) image (Fig. 2). The transformation of this image into a grey-scale image in Adobe Photoshop CS6 (Adobe Systems Inc., San Jose, USA) enabled the study of the distribution of light on the surfaces of the rooms. When chromatic differences are absent, the contrast intensity of an image is more readily apparent because it does not generate a subjective response in the eye (Demers 2007). Photolux software produces false colour images that facilitate daylight and luminance distribution analysis. This software also calculates visual comfort probabilities (VCP) for each room. This light evaluation system determines on a scale of 0 to 100 the percentage of viewers that will accept the environment as being comfortable (IESNA 2000). A visual comfort probability rating of 70% is generally considered adequate for office environments (Light Guide 2012). Adobe Color CC is an application from Adobe Systems allowing colour themes to be generated and analysed based on existing images. The CIE L*a*b* colour model (Lab) evaluates Colour Temperature (CT) by numerically describing the colours that a non-visually impaired person sees. Used by the International Commission on Illumination (CIE), this model measures illumination, colour, and colorimetry of a space. In the study of surface finishes, the b* value determines the relative position of colour between warm yellow values (+100) and cold blue values (-100).
Experimental Procedure
The data capture took place on May 25th, 2016 under an overcast sky (with more than 75% cloud cover). This sky condition represents annual conditions because overcast to partly overcast skies occur 63% of the year in Quebec City (Demers 2001). The preparation of a standard setting (closed doors and windows, artificial lighting turned off, sunshades opened to their maximum) preceded photographs and instrument readings. Measurements were taken in the wood room between 9:30 am and 10:30 am and then in the non-wood room between 11:30 am and 12:30 pm.
The comparison of comfort level parameters in the two rooms used the same methods and the same instruments within a short duration to minimise measurement bias. By measuring each of the study rooms on the same day and within three hours, any instrument drift is considered minimal.
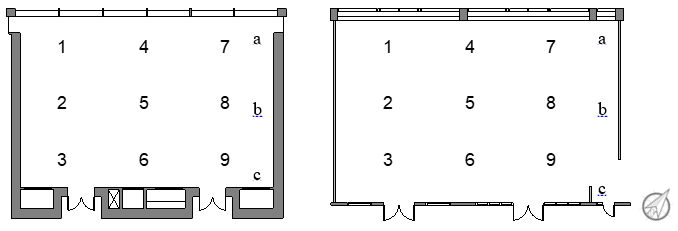
Fig. 3. Wood room (left) and non-wood room (right) measurement locations of environmental conditions; scale 1:150
Nine zones divide the rooms equally, define the location (centre point) of each measurement (Fig. 3), and enable the calculation of median environmental values for each room. Given the instruments’ short response-time, temperature, relative humidity, air speed, luminance, and carbon dioxide concentration measurements were taken at the nine locations over a 20-min interval in each room. The previously mentioned comfort parameters were measured at a height of 1.1 m from the floor. Surface temperature of the floors were obtained at site 8, and window and interior wall surface temperatures at locations a, b, and c. The meteorological station at Quebec Lesage International Airport provided outdoor temperatures and humidity levels for the survey day. Photographs taken at locations 2, 4, and 6 at a height of 1.5 m enable the analysis of the lateral distribution of natural light as well as the different features of the room in a standing occupants’ field of view. Photographs of the materials used in each room were taken perpendicular to the surfaces at a distance of 1 m. These photographs enable an analysis of the colour, texture, and pattern of the materials. Infrared images taken perpendicular to the surfaces at a distance of 1 m documented thermal conductivity and inertia. The sense of touch generates an immediate thermal response to the environment through conduction (Heschong 1979). Visualisation of this complex phenomenon was achieved by placing the researcher’s hand on a surface for 10 s, then removing it for two seconds before photographing the material. The disappearance of the handprint after a short period of time will suggest a high thermal conductivity because heat transfer occurs at a lower rate in materials with a low thermal conductivity. A material’s specific heat capacity (the amount of heat per unit mass needed to raise the temperature by 1 °C) was considered in the analysis, as it influences the effect of the heat transferred from the researcher’s hand. Surfaces requiring a large amount of heat to raise their temperature will be less affected by the handprint.
RESULTS AND DISCUSSION
Comparing environmental parameters in both rooms on the same day under similar weather conditions shows the relative differences between each room based on instrumental measurements. The quantitative analysis focuses on temperature, humidity, carbon dioxide, background noise levels, and luminance values, while the qualitative analysis addresses the colours and textures of the material surfaces.
Quantitative Analysis – Indoor Environmental Conditions
The median interior temperature, humidity, carbon dioxide concentration, and background noise levels in the two rooms presented only slight differences over the same day and period of time (Fig. 4). The median ambient temperature in the wood room was 22.7 °C with a humidity level of 44%, while the non-wood room had a higher median temperature (26.2 °C) and a lower humidity level (36.1%). The average outside temperature for the same period of time was 20.6 °C, and the average humidity level was 58.8%. The surface temperatures in both rooms reflected the ambient temperature differences. The median surface temperature in the wood room (22.5 °C) was lower than the median surface temperature in the non-wood room (25.7 °C). Both rooms could be considered comfortable in relation to the thermal comfort standards defined by ASHRAE and CIBSE (Table 2). With an operative temperature of 22.6 °C in the wood room and an operative temperature of 26.0 °C in the non-wood room, both spaces fall within the tolerable zone for both standards. However, the humidity level in the non-wood room (36.1%) was below the acceptable CIBSE range (40% to 70%) while respecting the thresholds defined by ASHRAE (< 80%). This suggests the influence of personal, social, and cultural factors on occupant comfort perception and standards, which need to be discussed from both quantitative and qualitative perspectives. Brager and de Dear (2003) consider that basic mechanical heating and cooling needs are influenced by personal and cultural comfort attitudes and expectations.
Concentrations of carbon dioxide above the outdoor value during the gathering of people for sustained periods of time indicates insufficient air renewal, as occupants emit CO2 during metabolic processes. Measuring carbon dioxide concentrations provides an estimate of ‘stuffiness’ and adequacy of ventilation. This comparative case study found minor variations of the carbon dioxide concentrations between the rooms. The median level observed in the wood room (385 ppm) was 5% lower than the concentration (405 ppm) in the non-wood room. The 36% larger volume of the wood room can account for the difference. The low occupant density during measurements (only the researcher was present in the rooms) can explain low concentrations in comparison with the ASHRAE (< 5000 ppm) and CIBSE (< 1600 ppm) recommendations.
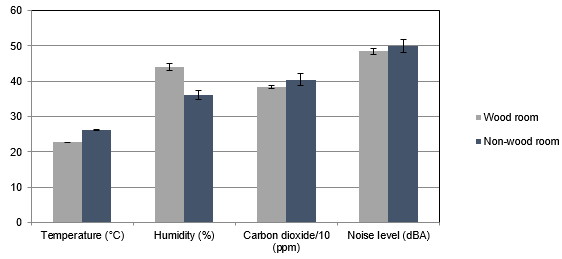
Fig. 4. Median indoor ambient temperature, humidity, carbon dioxide concentration (divided by ten), and background noise levels in the wood and non-wood rooms
Table 2. Acceptable Thresholds for Occupant Comfort in All Room Types (ASHRAE 2015; ASHRAE 2013; CIBSE 2015)
Discomfort is more readily acknowledged by an occupant than comfort, as is the case with considerable background noise levels generated by mechanical and ventilation systems. The non-wood room showed slightly higher background noise levels (50.0 dBA) than the wood room (48.5 dBA). Both of these levels exceed the overall sound level recommended by CIBSE (24 to 44 dBA), but remain within the acceptable threshold defined by ASHRAE (35 to 50 dBA).
Even if a satisfying visual environment can be achieved solely with artificial lighting, most occupants prefer natural light (CIBSE 2015). The most common aspects that generate visual discomfort consist of a lack of light, too much light on work surfaces, glare, reflections, shadows, and light fluctuations. The luminance levels recorded in the wood room surpass the levels in the non-wood room (Fig. 5). In the middle of the wood room, a luminance level of 1772 lux exceeds that nearest the windows in the non-wood room (1603 lux). The differences in window height and areas between the multi-purpose rooms impact the measured light values.

Fig. 5. Luminance levels (lux) and daylight factors (%) per by room depth superimposed on room sections for (left) the wood room and (right) non-wood room; scale 1:100
The calculation of daylight factors for each room considered the average hourly global horizontal illumination (41372 lux) in Quebec City for the month of May (Energy Design Tools 2016). The average daylight factor was 4.4% in the wood room and 1.6% in the non-wood room. For a substantially naturally lit space without the use of electric lighting, the average daylight factor in a room should not be less than 5%, whereas the minimum acceptable is 2% (CIBSE 2015). Only the wood room had an average daylight factor above the minimum guideline under overcast sky conditions. The large window area and room height in the wood room, rather than the interior surfaces, explains this difference. This finding relates to the work of Simm and Coley (2011), who found that differences in wall surface finishes had less impact on the daylight factor than predicted.
Comparison of the distribution of light within the rooms was allowed by the use of calibrated high dynamic range (HDR), grey scale, and false colour images (Fig. 6). Illuminance values in the wood room exceeded the values in the non-wood room. As well as representing more natural light, the false colour images of the wood room revealed a narrower range of colours. This indicates a uniform light ambiance in the wood room, a feature attributed to the widespread use of yellow birch for the walls and ceiling. Viewpoint 4 accentuates this point because wood surfaces dominate the field of view and indirect light illuminates the space. In contrast, a large range of colours occurred in the false colour images of the non-wood room. The black curtain on the lateral wall showed low luminance values and thereby contributed to a wide colour range. Luminance values on the floor reflected the alternating pattern of the linoleum tiles. The false colour image at viewpoint 4 in the non-wood room illustrates alternating orange and yellow zones on one side of the room and yellow and green alternating zones on the other side. This unexpected observation may indicate the importance of material colours and reflectance in addition to material textures and physical properties in visual comfort studies.
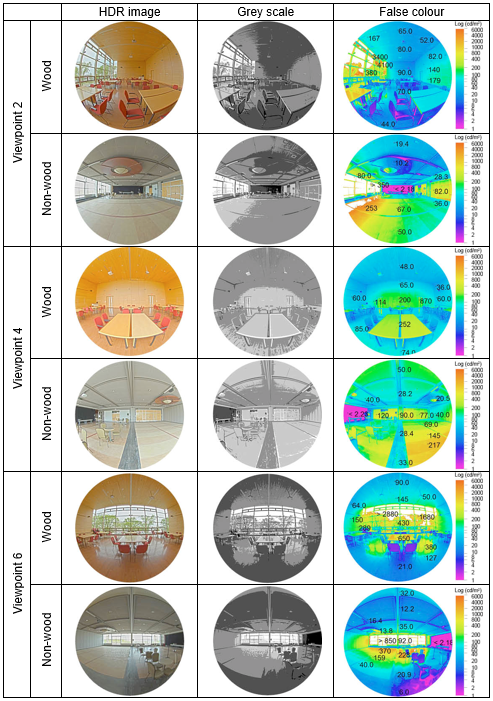
Fig. 6. Visual results from Photolux photoluminance meter analysis at viewpoints 2, 4, and 6: high dynamic range (HDR) (left), grey scale mode (middle), and false colour (right) images
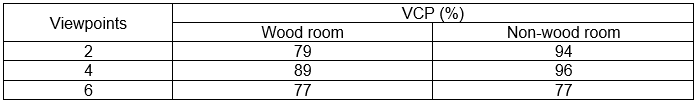
Visual comfort probabilities (VCP) extracted from the Photolux software predicted the percentage of occupants likely to accept the rooms as comfortable. A VCP value of 100% means all occupants should be comfortable. This mathematical procedure considers the significant factors that influence discomfort glare such as room size and surface reflectance, illumination level, number, location, and orientation of the light sources and luminance of the entire field of view. The probability of visual comfort in the non-wood room was higher than in the wood room according to the statistical data (Table 3). The highest visual comfort probability in each conference room was observed for the viewpoint of an occupant with their back to the window (viewpoint 4). Viewpoint 6, representing occupants facing the window, showed the lowest visual comfort probability in each room. All values exceed the recommended level (70%) for this type of environment. It was thought that the uniformity of the materials in the wood room would generate a high visual comfort probability, but it appears that the location and size of the windows presented a greater influence on the mathematical calculation than the surfaces’ reflectance and illumination levels. The large window area in the wood room explains the higher probability of glare predicted by the software in this room, despite a more uniform distribution of light, as shown by the false colour images in Fig. 6.
Table 3. Visual Comfort Probabilities (VCP) Extracted from Photolux Software
Physical parameters used to measure comfort were essentially identical for both rooms, except for the distribution of light. It is not surprising to observe similar interior environmental conditions for both rooms because mechanical systems maintain these values within an acceptable range for occupants in both buildings. An unexpected result from the statistical data regarding visual comfort probabilities was the comfort prediction for the non-wood room. However, the statistical information extracted from the Photolux software is not absolute and has been shown to present inconsistencies between glare indices and comfort probabilities (Jafarian et al. 2016). To understand the unique role of the properties of building materials in terms of visual ambiances, the qualitative effect of wood finishes also needs to be studied.
Qualitative Analysis – Surface Colours and Textures
Colour temperatures of surfaces provide a qualitative assessment of the impact of materials on visual ambiances. Adobe Color CC was used to examine HDR images at viewpoint 4 in both of the rooms and extract the b* value indicating the colour of the surfaces between yellow (+100) and blue (-100). The five selected points in the wood room showed higher b* values than the equivalent points in the non-wood room (Fig. 7). These values indicate a yellowish, warm wood room in contrast to a bluish, cold non-wood room. Even though the same wood was used for all the walls in the wood room, b* values for the surfaces varied with their location. The lateral walls (points 1 and 5) registered similar colour temperatures whereas the back wall (point 3) had a lower b* value, thus less yellow colour temperature. This phenomenon was less apparent in the non-wood room because of the diverse range of surface materials. The colour contrasts in the wood room are attributed to the variation of natural light reaching the surfaces. Naturally occurring features in the wood, such as grains and knots, also explain the colour contrasts (Burnard and Kutnar 2015).
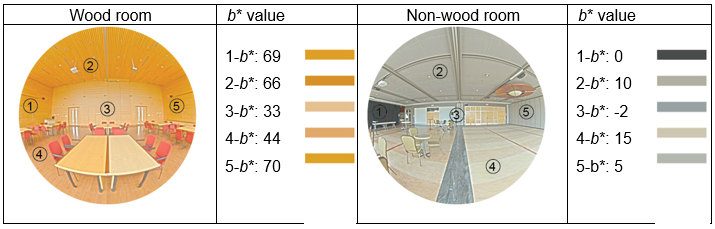
Fig. 7. The b* values in (left) the wood room and (right) non-wood room at viewpoint 4
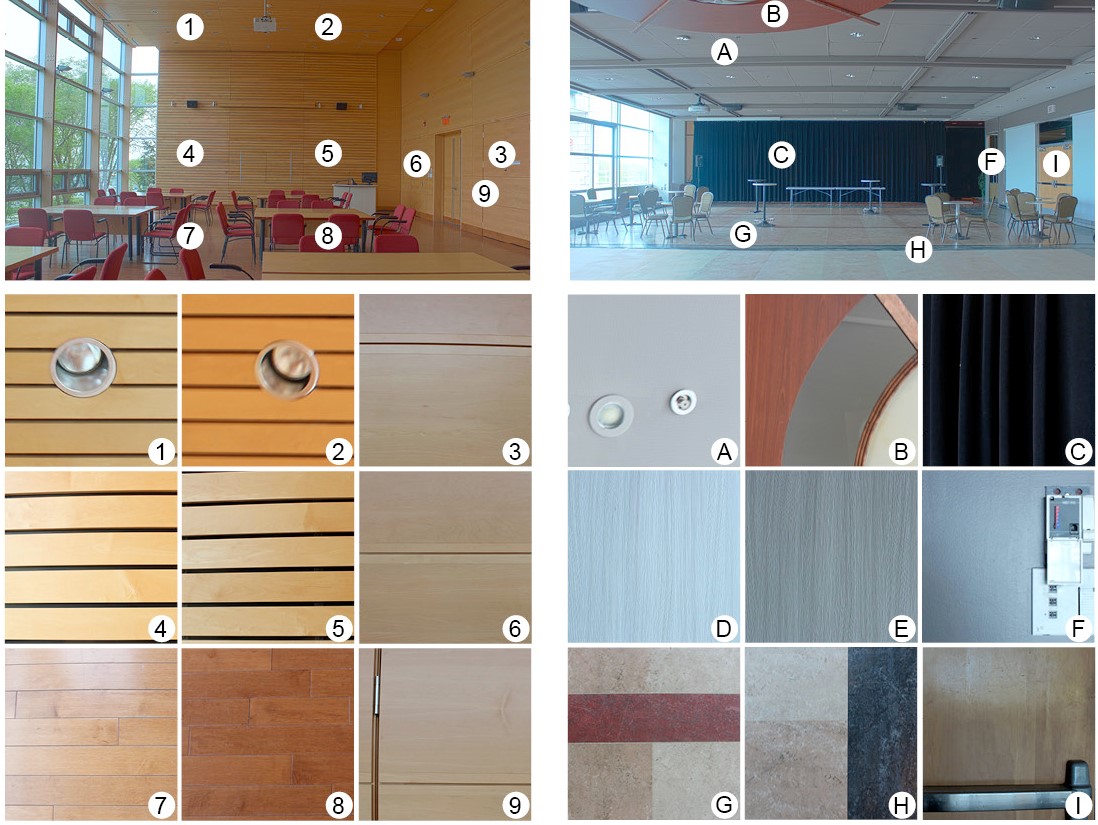
Fig. 8. Photographs of material textures in (left) the wood room and (right) non-wood room
The use of decorative wood panels generated a diversity of visual experiences in the wood room depending on the distance of the observer, whereas the painted surfaces in the non-wood room looked the same from any location (Fig. 8). The colour and texture of the walls in the wood room appeared uniform from a distance (top images showing the entire space in Fig. 8), but on close examination, the knots and grains of the wood expressed the character, age, and history of the material. The amount of light on the surfaces accentuated these textural patterns, an effect also observed for the wood coloured PVC movable partitions in the non-wood room. However, contrary to man-made materials, the human eye perceives the textures of natural materials and convinces the observer that the wood is authentic (Pallasmaa 2005). Such detailed scrutiny of the imitation wood partitions failed to capture the realism of the material.
The thermal analysis of wall and floor finishes in the wood room showed similar properties, whereas the non-wood room showed a greater range of thermal characteristics (Fig. 9). The selection of the researcher’s hand as a heat source allows a simple representation of a multifaceted hygrothermal phenomenon. In the non-wood room, the researcher’s handprint started disappearing from the walls within a few seconds. This suggests a high thermal conductivity for these surfaces in contrast to lower conductivity levels in the wood room where the handprint stayed defined. The material’s properties determined by previous research support these results. Birch wood shares similar conductivity values (0.17 to 0.18 W/m·K) as maple wood (0.16 to 0.17 W/m·K), explaining the similar images obtained in the wood room (ASHRAE 2013). Higher heat transfer rates in the non-wood room could result in lower comfort levels under cold ambient conditions, as the surfaces would rapidly absorb the body’s heat.
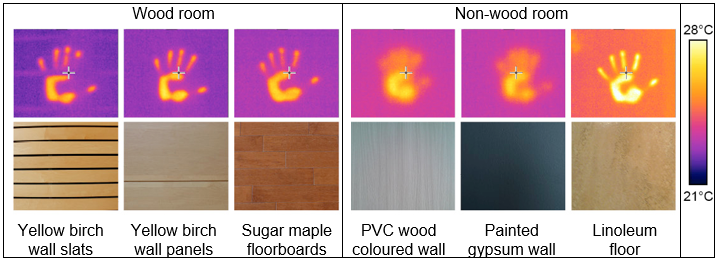
Fig. 9. (Top) thermal and (bottom) HDR photographs of surfaces in the wood and non-wood rooms
The infrared thermography of the linoleum floor is yellower, thus warmer, than the other surfaces (Fig. 9). This thermal difference resulted in part from the material’s specific heat capacity. A smaller amount of heat raises the temperature of linoleum floor (1.26 kJ/kg·K) (Clarke et al. 1990) in contrast to the hardwood floor in the wood room, which has a specific heat of 1.63 kJ/kg·K (ASHRAE 2013). It therefore takes a stronger heat source or a longer period of time to increase the temperature of wooden surfaces. The thermal survey method is effective; however, the use of a predetermined and constant heat source would allow a more accurate comparison of the surfaces and the rooms (Maldague 2016). Other material properties, such as surface emissivity, may also impact the image analysed (Gosselin 2016). Emissivity consists of the ability of a material’s surface to emit infrared energy on a scale from 0 (shiny mirror) to 1.0 (blackbody). The infrared camera that photographed the surfaces employed the same emissivity (0.90) as a global value for all the surfaces, neglecting material particularities. Despite the methodological limitations of this analysis, the infrared images suggest that the selection of a wide range of materials, as in the case of the non-wood room, may lead to noticeable differences within that space because every building material has its own unique properties that can influence thermal comfort. The relative impact of materials’ thermal properties should be further studied via occupants’ subjective perception of the indoor environment.
CONCLUSIONS
This descriptive study compared the quantitative and qualitative attributes of two multifunctional rooms located in Quebec City. The wood room featured extensive use of wood surfaces, whereas the non-wood room presented a wide variety of synthetic materials. The research objectively studied thermal, acoustic, and visual characteristics of comfort.
- Thermal and acoustic comfort parameters presented similar values for both rooms. The comparative study indicated small differences between the temperature, relative humidity, carbon dioxide concentrations, and background noise levels. The use of mechanical systems to regulate the indoor environmental quality in both case study rooms may explain the similar comfort parameters measured. Further studies in different settings would be necessary to confirm this trend.
- The most noticeable differences between the wood and non-wood rooms were associated with visual comfort parameters. Although different window areas and window heights partly explain this disparity, the interior finishes also contributed to the unique visual characteristics in each room.
- Analysing the quality of visual ambiances should not be based solely on photographic and software analysis, but also include a subjective evaluation. The non-wood room showed a higher visual comfort probability according to statistical data extracted from the Photolux software. However, these values depended on the location of windows in the viewpoint and presented inconsistencies with the qualitative analysis of material colours and textures.
- The use of wood in one of the multifunctional rooms translated into warm yellowish colour temperatures. The room with a diversity of interior finishes presented colder bluish colour temperatures. Variations found within each room depended on lighting conditions and material properties.
- Wood surfaces presented a diversity of visual experiences depending on the distance of the observer from the surface. Knots and grains made each wood panel unique, unlike painted surfaces, which provided a uniform texture independently of the location of the viewer.
- Surfaces in the wood room presented similar thermal reactions to the researcher’s handprint, despite the use of different wood essences. The wall and floor surfaces of the non-wood room showed larger variations in heat absorption and conduction. The lower thermal conductivity of the wood surfaces suggests that it consists of a more comfortable material for occupants to come in contact with.
FUTURE RESEARCH
To fully understand environmental comfort and occupant well-being in these settings, a questionnaire study would complete the descriptive analysis presented. An exploration of the perceptual advantages of wood use in the built environment from the users’ point of view could provide further explanations for the inconsistencies in the photographic and software analysis of the descriptive data.
ACKNOWLEDGMENTS
The authors are grateful to the Natural Sciences and Engineering Research Council of Canada for the financial support through its IRC No. 461745 and CRD No. 445200 programs (MSc RDC 17), as well as the industrial partners of the NSERC industrial chair on eco-responsible wood construction (CIRCERB).
REFERENCES CITED
Adekunle, T., and Nikolopoulou, M. (2016). “Thermal comfort, summertime temperatures and overheating in prefabricated timber housing,” Building and Environment 103, 21-35. DOI: 10.1016/j.buildenv.2016.04.001
ASHRAE (2015). ASHRAE Handbook – Heating, Ventilating, and Air-Conditioning Applications, ASHRAE, Atlanta, GA.
ASHRAE (2013). ASHRAE Handbook – Fundamentals, ASHRAE, Atlanta, GA.
Brager, G. S., and de Dear, R. J. (2003). “Historical and cultural influences on comfort expectations,” in: Buildings, Culture & Environment: Informing Local & Global Practices, R. J. Cole and R. Lorch (eds.), Blackwell Publishing, Oxford, UK, pp. 177-201.
Burnard, M., and Kutnar, A. (2015). “Wood and human stress in the built indoor environment: A review,” Wood Science and Technology 49(5), 969-986. DOI: 10.1007/s00226-015-0747-3
CIBSE (2015). CIBSE Guide A: Environmental Design, Chartered Institution of Building Service Engineers, London, UK.
Clarke, J. A., Yaneske, P. P., and Pinney, A. A. (1990). The Harmonisation of Thermal Properties of Building Materials, Final Report for Project CDS/001/2, Building Research Establishment, Watford, UK.
Demers, C. M. H. (2007). “A classification of daylighting qualities based on contrast and brightness analysis,” Conference Proceedings of the American Solar Energy Society (ASES), SOLAR 2007, Cleveland, Ohio.
Demers, C. M. H. (2001). “Études environnementales pour l’édifice de la Caisse et de Dépôt et de Placement du Québec à Montréal,” Research report, Groupe de recherche en ambiances physiques, École d’architecture, Université Laval, Québec, Canada.
Energy Design Tools. (2016). http://www.energy-design-tools.aud.ucla.edu [accessed June 2016].
Gosselin, Louis. (2016). Personal communication, June 23.
Heschong, L. (1979). Thermal Delight in Architecture, MIT Press, Cambridge, MA.
Holl, S., Pallasmaa, J., and Pérez Gomez, A. (2006). Questions of Perception: Phenomenology of Architecture, William Stout, San Francisco, CA.
IESNA (2000). The IESNA Lighting Handbook: Reference and Application, Illuminating Engineering Society of North America, New York, NY.
Jafarian, H., Demers, C. M. H., Blanchet, P., and Laundry, V. (2016). “Impact of indoor use of wood on the quality of interior ambiances under overcast and clear skies: Case study of the Eugene H. Kruger Building, Québec City,” BioResources 11(1), 1647-1663. DOI: 10.15376/biores.11.1.1647-1663
Kardous, C. A., and Shaw, P. B. (2014). “Evaluation of smartphone sound measurement applications,” Journal of the Acoustical Society of America 135(4), 186-192. DOI: 10.1121/1.4865269
Kelz, C., Grote, V., and Moser, M. (2011). “Interior wood use in classrooms reduces pupils’ stress levels,” Proceedings of the 9th Biennial Conference on Environmental Psychology, Eindhoven Technical University.
Light Guide: Controlling Glare. (2012). http://www.lightsearch.com [accessed June 2016].
Maldague, X. (2016). Written communication, June 22.
Masuda, M. (1992). “Visual characteristics of wood and the psychological images,” Bulletin of the Kyoto University Forests 38(12), 1075-1081.
Pallasmaa, J. (2005). The Eyes of the Skin: Architecture and the Senses, Wiley-Academy, Chichester, UK.
Rice, J., Kozak, R. A., Meitner, M. J., and Cohen, D. H. (2006). “Appearance wood products and psychological well-being,” Wood and Fiber Science 38(4), 644-659.
Sakuragawa, S., Miyazaki, Y., Kaneko, T., and Makita, T. (2005). “Influence of wood wall panels on physiological and psychological responses,” Journal of Wood Science 51(2), 136-140. DOI: 10.1007/s10086-004-0643-1
Schiavon, S., and Altomonte, S. (2014). “Influence of factors unrelated to environmental quality on occupant satisfaction in LEED and non-LEED certified buildings,” Building and Environment 77, 148-159. DOI: 10.1016/j.buildenv.2014.03.028
Simm, S., and Coley, D. (2011). “The relationship between wall reflectance and daylight factor in real rooms,” Architectural Science Review 54(4), 329-334. DOI: 10.1080/00038628.2011.613642
Wilson, E. O. (1984). Biophilia, Harvard University Press, Cambridge, MA.
Article submitted: September 12, 2016; Peer review completed: October 22, 2016; Revised version received and accepted: November 1, 2016; Published: November 9, 2016.
DOI: 10.15376/biores.12.1.168-182