
Abstract
There are several non-utilized or under-utilized hardwood trees common to the Midwestern states. Wood flour (WF) derived from fast-growing Midwest trees (Osage orange, black locust, and red mulberry) were evaluated as a source of bio-based fiber reinforcement. Wood-plastic composites (WPCs) of high-density polyethylene (HDPE), 25 wt.% of WF, and either 0% or 5% by weight of maleated polyethylene (MAPE) were produced via twin screw compounding and injection molding. Specimen bars were evaluated for their mechanical and flexural properties. Composite blends that employed the coupling agent MAPE were superior to composites without MAPE or neat HDPE in terms of their mechanical and flexural properties. The Osage orange WPC composed of juvenile WF had mechanical and flexural properties that were the same as the WPC composed of mature WF. The WPC composed of WF from Midwestern trees were comparable with the WPC composed of pine WF in terms of their mechanical and flexural properties. Soaking the bars of the various WPC blends in distilled water for 28 days altered their weights, mechanical properties, and color. Thermal properties of neat HDPE and WPCs were evaluated using differential scanning colorimetry and thermogravimetric analysis.
Download PDF
Full Article
Wood-plastic Composites Utilizing Wood Flours Derived from Fast-growing Trees Common to the Midwest
Brent Tisserat,a,* Louis Reifschneider,b Alan Gravett,c and Steven C. Peterson d
There are several non-utilized or under-utilized hardwood trees common to the Midwestern states. Wood flour (WF) derived from fast-growing Midwest trees (Osage orange, black locust, and red mulberry) were evaluated as a source of bio-based fiber reinforcement. Wood-plastic composites (WPCs) of high-density polyethylene (HDPE), 25 wt.% of WF, and either 0% or 5% by weight of maleated polyethylene (MAPE) were produced via twin screw compounding and injection molding. Specimen bars were evaluated for their mechanical and flexural properties. Composite blends that employed the coupling agent MAPE were superior to composites without MAPE or neat HDPE in terms of their mechanical and flexural properties. The Osage orange WPC composed of juvenile WF had mechanical and flexural properties that were the same as the WPC composed of mature WF. The WPC composed of WF from Midwestern trees were comparable with the WPC composed of pine WF in terms of their mechanical and flexural properties. Soaking the bars of the various WPC blends in distilled water for 28 days altered their weights, mechanical properties, and color. Thermal properties of neat HDPE and WPCs were evaluated using differential scanning colorimetry and thermogravimetric analysis.
Keywords: Adsorption tests; Mechanical properties; Flexural properties; Colorimetry; Thermal properties; Hardwood trees
Contact information: a: Functional Foods Research Unit, National Center for Agricultural Utilization Research, Agricultural Research Service, United States Department of Agriculture, 1815 N. University St., Peoria IL 61604 USA; b: Department of Technology, College of Applied Science and Technology, Illinois State University, Normal IL 61790-5000 USA; c: Hedge Apple Biotech, 211 Woodrig Road, Bloomington, IL 61704 USA; d: Plant Polymer Research Unit, National Center for Agricultural Utilization Research, Agricultural Research Service, United States Department of Agriculture, Peoria, IL 61604 USA;
* Corresponding author: Brent.Tisserat@ars.usda.gov
Introduction
Wood plastic composites (WPCs) are fabricated by blending 25 wt.% to 50 wt.% of wood fibers (WF) with thermoplastic resins (e.g. polyethylene, polypropylene). Such WPCs are used in building and construction, automotive, electrical, and other applications (Kalyankar and Uddin 2012; Zion Market Research 2017). Wood-plastic composite products were valued at $4.37 billion in 2016 and are projected to reach $8.76 billion in value by 2022, growing at a compound annual growth rate of 12.3% (Zion Market Research 2017). Wood fibers are generally derived from wood waste materials. Wood waste prices fluctuate based on its availability and the demand for its utilization (Millman 2008). For example, sawdust prices quadrupled from 2006 to 2008 due to a drop in housing construction that substantially reduced lumber manufacturing (Millman 2008). Approximately 85% of wood waste is converted into biomass fuel and is consumed as energy (e.g. fuel pellets or direct combustion). Biomass fuel usage is projected to increase dramatically in the near future (Burden 2012). The Energy Independence and Security Act of 2007 mandated that 36 billion gallons of biofuels be produced by 2022 (Energy Independence and Security Act 2007). Currently, 5.5 billion gallons of biofuels are produced annually (White 2010). A number of government subsidy programs are diverting woody biomass into utilization through bio-energy facilities. This diversion will result in higher costs of wood fibers (Eilperin 2010). As the demand for WF needed by the WPC industry increases, the cost of WF will undoubtedly also increase because of its competition with the bio-energy mandate. This situation suggests that there is need for alternative WF sources to provide woody biomass and WF therefore satisfying both the bio-energy and WPC needs.
Several different alternative woody biomass sources of WF have been suggested (LeVan-Green and Livingston 2001; Myers et al. 2003). For instance, harvesting small-diameter trees derived from forest under-stories or brush conditions offers a source of wood for both bio-energy and WPC industries (LeVan-Green and Livingston 2001; Myers et al. 2003; White 2010). Another source of wood could be short-rotational woody crops (SRWC) from fast-growing trees (English and Ewing 2002; White 2010; Zahedi et al. 2012; Slater et al. 2015). Marginal land utilization to grow woody trees has the potential for providing large acreages for bio-energy woody tree crops without interfering with agricultural production (English and Ewing 2002).
In the Midwest there are a number of under-utilized native and semi-invasive fast-growing hardwood trees including Osage orange (OO; Maclura pomifera (Rafin.) C. K. Schneider, family Moraceae), black locust (BL; Robinia pseudoacacia L., family Leguminosae), and red mulberry (RM; Morus rubra L., family Moraceae) (Dickerson 2002; Barbour et al. 2008; Wynia 2011). These trees are noted for their rapid growth, high biomass production, drought-resistance, ability to coppice, and ability to readily adapt or pioneer on marginal or damaged soils (Dickerson 2002; Barbour et al. 2008; Dickerson 2002; Wynia 2011). Therefore, these trees may be ideal candidates to provide high amounts of biomass, while being grown in a temperate climate such as that associated with the Midwest non-agricultural soils. Osage orange heartwood has been reported to consist of 33% cellulose, 40% lignin, and 17% hemicellulose (Salem and Mohamed 2013). Black locust heartwood consists of 40 to 50% cellulose, 19 to 24% hemicellulose, and 20 to 30% lignin depending on its age (Adamopoulos et al. 2005). The chemical composition of red mulberry has not been reported. Over the last few years, the authors have experimented with establishing plantations of SRWC utilizing high-density plantings of these trees in central Illinois. The OO and BL are particularly noted to be “weedy” undesirable trees (Dickerson 2002; Wynia 2011). These trees have high wood densities and are ranked highly as potential fuel trees based on their energy (British thermal units) output per cord (Meister 2006). In addition, these trees have been suggested to provide products for the medicinal, food, and construction industries, although none of the trees are commercially utilized in large numbers.
The objective of this study was to evaluate the mechanical and physical properties of WPCs obtained by blending WF obtained from these Midwestern trees with high-density polyethylene (HDPE). In addition, the authors were also interested in the utilization of Midwestern tree WF (MTWF) derived from juvenile trees, because small-diameter SRWC are likely to be an important source of woody biomass required in the future. Hence, a study was conducted comparing MTWF derived from juvenile tree biomass (i.e. 36-month-old) with WF derived from older trees (i.e. 20-year-old) of the same species. Because coupling agents are commonly used in WPCs (Habibi et al. 2008; Rosa et al. 2009; Abdelaal et al. 2012; Harnnecker et al. 2012; Zahedi et al. 2012; Yemele et al. 2013) to improve interfacial binding, the authors employed maleated polyethylene (MAPE) as part of the scope of the project. For comparative purposes the authors also tested the mechanical and flexural properties of WPCs containing MTWF with that of WPCs containing pine wood (PiW) flour. These tests were performed to determine the merits of a new WF, with an established, commonly commercially employed wood filler, i.e. PiW. Because WF is subject to degradation by water, water immersion tests were administered on these WPCs to evaluate their environmental durability.
EXPERIMENTAL
Materials
The HDPE used in this study was Petrothene LS 5300-00 (Equistar Chemicals LP, Houston, TX, USA) with a melt-flow index of 40 g/10 min, a density of 0.950 g/cm3, and a melting point of 129 °C. The binding agent employed was a MAPE, supplied by Equistar Chemicals LP (Houston, TX, USA) (product code NE542013), with a melting point of 104 °C to 138 °C, and containing approximately 1 wt.% maleic anhydride grafted on the polyethylene.
WF preparations
The OO and RM woody branches were obtained from 50-year-old mature trees grown in the Peoria-Bloomington area of central Illinois. The mature wood used was harvested by chain saw via removal of branches (approximately 76 mm to 130 mm diameter). Branches were estimated by ring counts to be approximately 20 years old. Tree wood of immature BL (IBL) and immature OO (IOO) branches were harvested from 3-year-old seedling trees grown in Peoria, IL. Branches were chipped with the chipper/shredder (Model CS410, Troy-Bilt, MTD, Cleveland, OH, USA). Chipped materials were then milled with a Thomas-Wiley mill grinder, Model 4 (Thomas Scientific, Swedesboro, NJ, USA) successively through 4-mm, 2-mm, and 1-mm screens. Wood particles were then sized through a Ro-TapTm Shaker (Model RX-29, Tyler, Mentor, OH, USA), employing #10, #30, and #40 US Standard sieves (Newark Wire Cloth Company, Clifton, NJ, USA). The wood mixtures employed in plastic composites consisted of ≤ 420 µm particles obtained from the particles that passed through the #40 mesh sieves. Pine (Pinus ponderosa Douglas ex. C. Lawson) (PiW) shavings (Petsmart, Phoenix, AZ, USA) were ground directly in the Wiley mill and sieved as previously described. Ball ground OO (BGOO) was obtained from 1-mm milled OOWF and ground in a laboratory bench top ball mill (Model 801CVM, U.S. Stoneware, East Palestine, OH, USA). The OOWF was ground in Alumina mill jars containing Burundum cylindrical grinding media pellets (13-mm diameter, approximately 7.3 g) (U.S. Stoneware, East Palestine, OH, USA) at a speed of 50 rpm for 60 h. Ball ground flour was then sieved through a #80 mesh to obtain fine powder of ≤ 177-µm particle sizes. Particle mixtures were oven-dried for 48 h at 80 °C to obtain a moisture content of approximately 5% to 8%.
WPC preparations
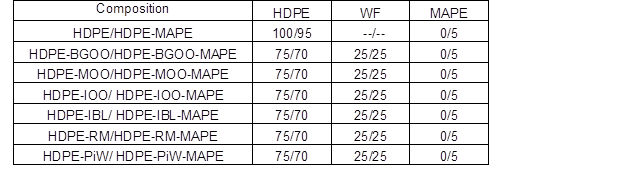
Preparations of the various WPCs are summarized in Table 1.
Table 1. Weight Percentages of WPC Formulations
Composite blends were extruded with a Micro-18 30/l L/D co-rotating twin-screw extruder (American Leistritz Extruder, Branchburg, NJ, USA). The screw configuration was,
15/90 15/30 15/30 15/30 7.5/30 7.5/30 KB30/20 10/30 KB60/20 KB60/20/ 10/30
KB30/20 KB60/20 KB60/20 10/30 KB60/20 KB60/20 KB30/20 7.5/30
where the first number is the elements’ pitch (mm) and the second number is its length (mm) except for the kneading blocks (KB), where the first number indicates the angle between blocks (o) and the second number is its length (mm). The barrel had six different zones, each 90 mm long, which were set using the following temperatures (°C): 30, 60, 90, 125, 135, and 140. The cord die temperature was set at 138 °C. The wood particles and MAPE were premixed and then fed into zone 1 at approximately 4.4 g/min using a volumetric twin-screw gravimetric feeder (Model KCL24KT20, Ktron, Pitman, NJ, USA). Simultaneously, the HDPE was fed with a single drive feeder (Flex-Tuff Model 106, Schenck/AccuRate, Whitewater, WI, USA) in the same zone at the rate of approximately 12 g/min. The extruder screw speed was conducted at 100 rpm. Extruded strands were cooled on a conveyor belt equipped with an air stream (Model 2100, Dorner Mfg. Corp., Hartland, WI, USA) and then processed into pellets with a strand pelletizer (Model 4, Killion, Cedar Grove, NJ, USA).
Injection molding was conducted using a 30-ton molding machine (Engel ES 30, Engel Machinery Inc., York, PA, USA) with set point temperatures (°C) for the four zone injection molding barrel set at: feed, 160 °C; compression, 166 °C; metering, 177 °C, and nozzle, 191 °C. The mold temperature was 37 °C. Maximum nozzle injection pressure was 4.1 MPa. Test formulations were injected into a American Society for Testing and Materials (ASTM) test specimen mold that included cavities for a ASTM D-790 (2010) flexural testing bar (12.7 mm (W) × 127 mm (L) × 3.2 mm thickness), a Type I tensile bar (12.7 mm (W) × 165 mm (L) × 50 mm gauge (L) × 3.2 mm thickness), and an ASTM D-638 (1999) Type V tensile testing bar (9.5 mm (W) × 63.5 mm (L) × 7.6 mm gauge (L) × 1.5 mm thickness).
Methods
Scanning Electron Microscopy (SEM)
Liquid nitrogen freeze fractured surfaces of specimens were placed on double-side tape pieces attached to specimen mounts with the edges of the tape painted with a colloidal silver adhesive. Specimens were then coated with a thin gold layer using a sputter coater (Model RX-508, SPI Supplies, West Chester, PA, USA). A JOEL 6400 V scanning electron microscope (Peabody, MA, USA) was employed to examine the fractured surfaces.
Mechanical property measurements
Samples were conditioned at standard room temperature and humidity (23 °C and 50% relative humidity, RH) for approximately 240 h prior to testing. Mechanical measurements were conducted with a universal testing machine (Model 1122, Instron Corporation, Norwood, MA, USA). Tensile bars (ASTM D-638 (1998) Type I) were employed to measure the mechanical properties (i.e. tensile strength (su), Young’s modulus (E), and elongation at break (% El) using a 50 mm/min testing speed. Type V bars were employed to evaluate physical (weight and color) and mechanical property changes after prolonged exposure to water soaking.
Three-point flexural tests were conducted according to the ASTM D-790 (2010) standard specification on the Instron UTM. The flexural strength (sfm) and flexural modulus of elasticity (Eb) were calculated, and the flexural tests were performed using Procedure B with a crosshead rate of 13.5 mm/min. Five specimens of each formulation were tested. The average values and their standard errors were reported.
Water absorption
Water absorption was obtained using Type V tensile bars for each composite. Bars were oven-dried for 24 h at 60 °C ± 2 °C and weighed prior to testing. Tests were conducted in an incubator set at 25 °C ± 2 °C under a photosynthetic photon flux density of 180 μmol.m2.s-1 using a photoperiod of 12 h light/12 h dark. Tensile bars were placed in distilled water at room temperature for 672 h (28 days). At predetermined time intervals the specimens were removed from the distilled water, the surface water was blotted off with paper towels, and their wet mass and thickness were determined. Water absorption was measured as weight gain percentage.
Spectrophotometric evaluations
Color measurements of tensile bars were obtained using the Commission Internationale de l’Eclairage (CIE) Lab parameters (L*, a*, b*) with a Chroma Meter CR-400 spectrophotocolorimeter (Konica Minolta, Ramsey, NJ, USA). The scanner was calibrated with a white tile. With this coordinate system, the L* value is a measure of lightness [brightness, ranging from 0 (black) to 100 (white)]; the a* value is a measure of redness [ranging from -100 (green) to +100 (red)]; the b* value is a measure of yellowness [ranging from -100 (blue) to +100 (yellow)]; the C*ab value is a measure of Chromaticity (quality of color); and the H* ab value is a measure of the Hue angle (the real color). The C*ab and H*ab values are derived as follows: √(a*2 + b*2) and arctan (b*/a*), respectively.
Thermal properties
Differential scanning colorimetry (DSC) of specimens was performed with an Auto DSC-7 calorimeter with a TAC/DX controller (TA Instruments, New Castle, DE, USA). The calorimeter was first programmed to increase the temperature from 0 to 180 °C at a rate of 10 °C/min and kept isothermal for 3 min. Second, the samples were cooled to -50 °C at a rate of 10 °C/min. Third, the samples were then heated to 180 °C from -50 to 180 °C at the same rate. Data were determined from the second heating cycle to obtain the melting temperature (Tm) and enthalpy of melting (DHm) for the samples. The heat flow rate corresponding to the crystallization of HDPE in composites was corrected for the content of the WF and MAPE. The crystallinity level (cc) of the HDPE matrix was evaluated from the following relationship (Lei et al. 2007),
cc = DHm/DH × 100%/Wf (1)
where DHm is the experimental heat of fusion obtained from the DSC, DH is the assumed heat of fusion of crystalline HDPE (293 J/g), and Wf is the weight fraction of HDPE in the composites.
Thermogravimetric analysis (TGA) was performed with a Model 2050 TGA (TA Instruments) under nitrogen at a scan rate of 10 °C/min from room temperature to 600 °C. TA Advantage Specialty Library software (TA Instruments) was used to analyze data to derive the derivative TGA (wt %/min) of each sample.
Statistical analysis
The experimental data obtained was analyzed statistically by an analysis of variance for statistical significance, and multiple comparisons of means were accomplished with Duncan’s Multiple Range Test (p ≤ 0.05) (Statistix 9, Analytical Software, Tallahassee, FL, USA).
Results and Discussion
SEM Surface Examination
The SEM magnification examinations of the WPCs showed the occurrence of a fractured surface that was extremely rough in appearance. Regardless of the species examined, the WF particles were not uniformly distributed in the plastic matrix but occurred in a random manner or even in clumps, as shown in Fig. 1. In contrast, the neat HDPE or HDPE-MAPE formulation exhibited a considerably smoother appearance (Fig. 1).
The fracturing of the composite surfaces resulted in no obvious pattern to suggest how the WF particles influenced the cause of the fracture. Considerably more WF clumps were observed on the fractured surfaces of the WPCs without MAPE than in the blends of WPCs that contained MAPE. This observation suggested that MAPE was responsible for causing greater adherence (i.e. higher interfacial binding) to occur between the WF and the HDPE than in the composites without MAPE. Nevertheless, all of the examined composite formulations had fractured surfaces that had relatively smooth areas, which typified the presence of less WF. Areas that were markedly much rougher in appearance suggested a higher distribution of WF particles. Furthermore, when large clumps of WF occurred, prominent fissures were generated between the WF and HDPE, which gave the surface a “rough jagged appearance” (Fig. 1).
Little difference in the SEMs was observed in comparing the various WPCs. The SEMs of BGOO composites (containing ≤ 177 µm particles) were somewhat dissimilar from the SEMs of other WPCs, which contained the mixture of larger particles (≤ 400 µm). The HDPE-BGOO composite showed surfaces that were considerably rougher in appearance than the HDPE-BGOO-MAPE composite surface (Fig. 1g, 1h). This suggested that much more fracturing occurred in the HDPE-BGOO composite.
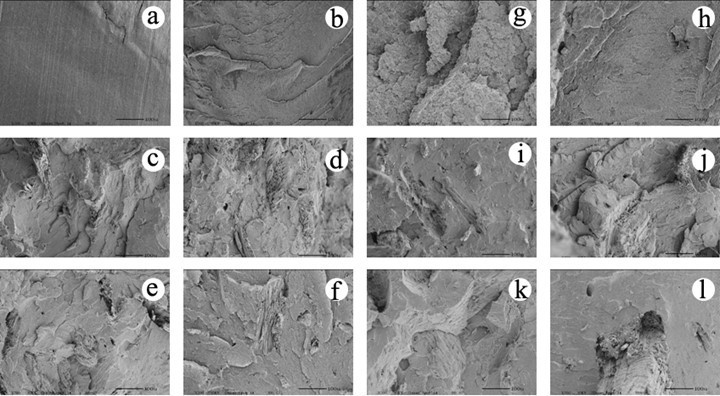
Fig. 1. Scanning electron microscope micrographs of fractured surfaces of HDPE resins and wood composites: (a) HDPE, (b) HDPE-MAPE, (c) HDPE-IOO, (d) HDPE-IOO-MAPE, (e) HDPE-MOO, (f) HDPE-MOO-MAPE, (g) HDPE-BGOO, (h) HDPE-BGOO-MAPE, (i) HDPE-IBL, (j) HDPE-IBL-MAPE, (k) HDPE-RM, and (l) HDPE-RM-MAPE; scale bar = 100 µm
Mechanical Properties
The mechanical properties (sU, E, and % El) of the various WPC formulations are shown in Table 2. Figure 2 summarizes the data graphically by normalizing the outcomes to the HDPE control. This rendering illustrates the influence of various WFs and additives at a glance.
Table 2. Mechanical and Flexural Properties of Composites
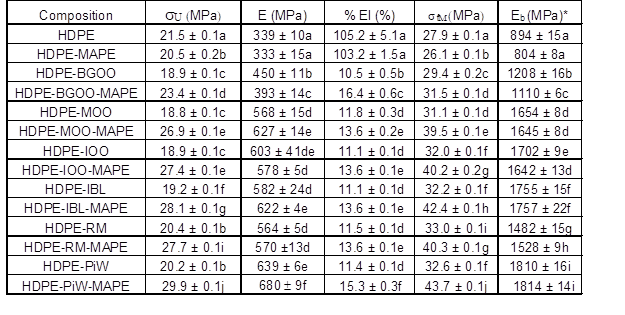
Treatment values with different letters in the same column were significant (P £ 0.05); means and standard errors derived from five different replicates are presented.
Slight variations in the mechanical properties occurred among the various formulations, which suggested the influence of wood was species related. This observation has been previously noted in other WPC studies using wood from other tree species (Kim et al. 2008; Bouafif et al. 2009; Zahedi et al. 2012; Yemele et al. 2015). The sU values for WPC devoid of MAPE were less than the sU values of neat HDPE (Table 2, Fig. 2). The sU values for the HDPE-RM and HDPE-PiW were 5% and 6% less, respectively, than the sU values of neat HDPE; whereas the sU values of HDPE-BGOO, HDPE-MOO, and HDPE-IOO, were approximately 12% less than the sU values of neat HDPE. Inclusion of the coupling agent (MAPE) with HDPE significantly enhanced sU values in all of the WPCs compared to those of WF composites devoid of MAPE (Table 2, Fig. 2). The E values were higher in the WF composites, regardless of whether MAPE was included, in comparison to the E values of the HDPE. However, the % El values for WF composites, regardless of whether MAPE was included, were considerably lower than E values of the neat HDPE. Coupling agents are employed to improve the adhesion between the bio-based filler and plastic (Habibi et al. 2008; Rosa et al. 2009; Abdelaal et al. 2012; Harnnecker et al. 2012; Zahedi et al. 2012). The authors’ results confirm these earlier studies.
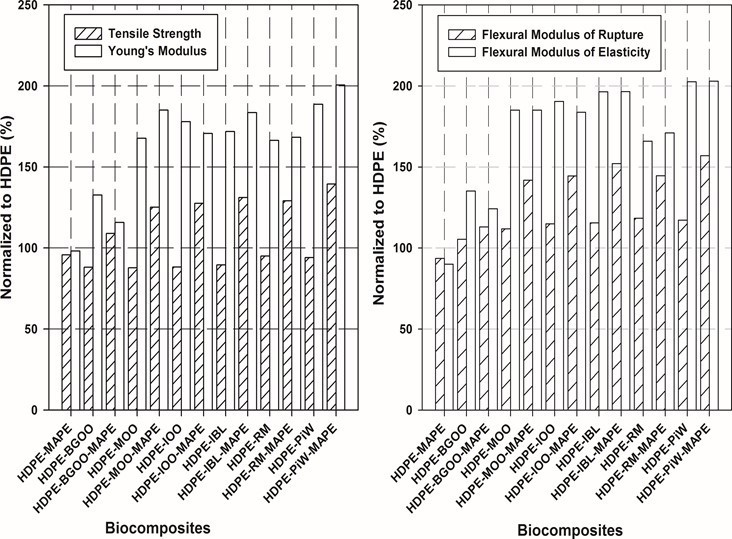
Fig. 2. Effect of additives on the mechanical and flexural properties when compared to the control material HDPE
The HDPE-PiW and HDPE-MTWF composites mimicked each other in terms of their mechanical properties. The HDPE-PiW-MAPE exhibited the highest sU and E values of all the WF composites tested. The other WF composites containing MAPE exhibited slightly less sU (-8% to -10%) and E values (-8% to -16%) than the PiW composites with MAPE. Because PiW flour is commonly employed in commercial WPC, these observations suggest that MTWF-composites were comparable.
The BGOO composites exhibited the lowest sU and E values of all the WF composites tested (Table 2; Fig. 2). Undoubtedly this may be attributed to the particle size (≤ 177 µm) employed and not the species, because MOO and IOO composites exhibited higher sU and E values and were comparable to the other species tested (Fig. 2). The HDPE-BGOO composites were highly labor- and time- intensive to prepare because of the additional grinding and sieving procedures. The resulting HDPE-BGOO composite was distinctly inferior to other WF composites that contained a mixture of particle sizes (≤ 400 µm) tested.
Flexural Behavior
The flexural properties (sfM and Eb values) of the WPCs and thermoplastic resins are shown in Table 2. Figure 2 summarizes the data graphically by normalizing the flexural properties compared to the HDPE control. All of the MTWF-composites had higher sfM and Eb values compared to the neat HDPE (Table 2; Fig. 2). The sfM values were higher in the composites when MAPE was included in the formulations compared to those with formulations devoid of MAPE (Table 2). In contrast, the Eb values of MTWF-composites did not increase with the inclusion of MAPE in the WPC formulations compared to those with formulations devoid of MAPE. Generally, those composites that exhibited high sfM also exhibited high Eb (Yemele et al. 2013). However, this was not the case with the MTWF-composites examined in this study (Table 2; Fig. 2). For example, the HDPE-IOO composite had a higher Eb value than the HDPE-IOO-MAPE; conversely, the HDPE-IOO showed a significantly lower sfM value than the HDPE-IOO-MAPE (Table 2).
The BGOO composites’ flexural properties were clearly inferior to those of the MOO or IOO composites; this difference mimics the comparison of the mechanical properties with these same formulations, as previously discussed. Apparently, the WPC composed of small MTWF particles is of no advantage versus the WPC composed of a mixture of particles, in terms of their mechanical or flexural properties (Table 2; Fig. 2). There was very little or no discernible difference in terms of tensile or flexural values between WPCs fabricated with either immature (IOO) or mature (MOO) wood (Table 2). This observation suggests that immature wood is suitable in the fabrication of WPCs.
The HDPE-PiW-MAPE exhibited the highest sfM and Eb values for all of the WPCs tested (Table 2; Fig. 2). However, several of the other MTWF-composites exhibited sfM and Eb values that were comparable to those of pine WPC, such as the HDPE-IOO-MAPE, HDPE-MOO-MAPE, HDPE-IBL-MAPE, and HDPE-RM-MAPE.
Water Absorption Responses
Figure 3 shows the long-term water absorption plots of WPCs at room temperature, where weight gain (%) (i.e. water absorption) was plotted against immersion time (h). All of the composites absorbed water during the incubation period, and none obtained a saturation level. The HDPE and HDPE-MAPE exhibited considerably less than a 1% increase in weight after the immersion incubation time (672 h). Inclusion of the MAPE coupling agent to the formulation usually produced a composite that was more resistant to water absorption. For example, HDPE-IOO and HDPE-IOO-MAPE exhibited weight gains of 2.4% and 1.4%, respectively. This represents a reduction in water absorption by 71% when a coupling agent was employed. The PiW and IBL WPCs exhibited a similar trend (Fig. 3). However, the BGOO-, RM-, and MOO-composites exhibited a modest difference between the maleated and non-maleated composites. Previous researchers have reported that inclusion of the MAPE in the composite considerably reduces water absorption when using bio-materials of Curauá, aspen, white birch, black walnut, red and white cedar, Jack pine, black spruce, Osage orange, and rice husks (Bouafif et al. 2009; Rosa et al. 2009; Harnnecker et al. 2012; Kallakas et al. 2015; Kim et al. 2015). The presence of a coupling agent causes a reaction between the hydrophilic WF with the hydrophobic resin, resulting in the reduction of available hydrophilic groups to absorb water and the formation of an interfacial layer on the WF surface (Rosa et al. 2009). The BGOO-composites composed of smaller particles exhibited considerably less weight gain (1%) than the IOO WPC (2.4%) or MOO WPC (1.3%), which contained larger particles. When the MAPE was included in the formulation, no difference occurred in the weight change values for the HDPE-BGOO-MAPE and HDPE-MOO-MAPE formulations (Fig. 3). The ability of WF-composites to absorb water is related to their chemical and physical properties, which in turn affects the interfacial binding between the plastic matrix and the WFs (Bouafif et al. 2009; Rosa et al. 2009; Harnnecker et al. 2012; Zahedi et al., 2012). The WPC containing smaller particles, such as the HDPE-BGOO and HDPE-BGOO-MAPE, absorbed less water than the WPC containing larger particles. Other investigators also noted this effect (Bouafif et al. 2009). The plastic matrix component is highly hydrophobic and hardly absorbs any water; the WF portion of the composite in contrast is highly hydrophilic and absorbs water based on its interfacial binding with the plastic matrix (Fig. 3). In this study, the species the WF was derived from was a determining factor in the response of the WPC to absorb water. RM, IBL and PiW WPCs all exhibited higher water absorption capabilities than the OOWF WPC. For example, water absorption percentages of HDPE-BGOO-MAPE, HDPE-MOO-MAPE, and HDPE-IOO-MAPE, compared to those of HDPE-PiW-MAPE were 46%, 28%, and 21% less, respectively. Similarly, Kim et al. (2015) found that the OO composites absorbed less water than the other tested tree species (e.g. red cedar, cherry, gum, hickory, pine, and maple). The OO wood is noted to be extremely strong and dense, which contributes to its durability and aversion to uptake water (Salem and Mohamed 2013).
Environmental stresses, such as water soaking, may cause changes in the mechanical properties, which need to be assessed because they affect the potential commercial value of a composite (Kim et al. 2008; Darie et al. 2011; Kallakas et al. 2015). For example, flexural properties have been reported to decrease when the WPCs are weathered (Darie et al. 2011; Kallakas et al. 2015). The tensile properties of soaked and non-soaked Type V tensile bars for the various formulations are shown in Fig. 4. The mechanical properties of composites as well as those of neat HDPE and HDPE-MAPE were affected by the water soaking treatment. The HDPE and HDPE-MAPE blends exhibited reductions in the % El values, whereas their sU and E values increased. Tensile strength values increased approximately 5% and 4% for HDPE and HDPE-MAPE, respectively. Generally, the sU values for soaked WF-composites increased slightly when compared to the untreated controls, whereas the E values either were retained or decreased when compared to the untreated controls (Fig. 4). The largest change in sU values occurred in the HDPE-BGOO composite, which increased 15%. The HDPE-WF-MAPE composites retained their higher sU and E values when compared to the HDPE-WF composites devoid of MAPE (Fig. 4). Elongation values were often found to decrease significantly when comparing the soaked WF-composites to the untreated WF-composites (Fig. 4).
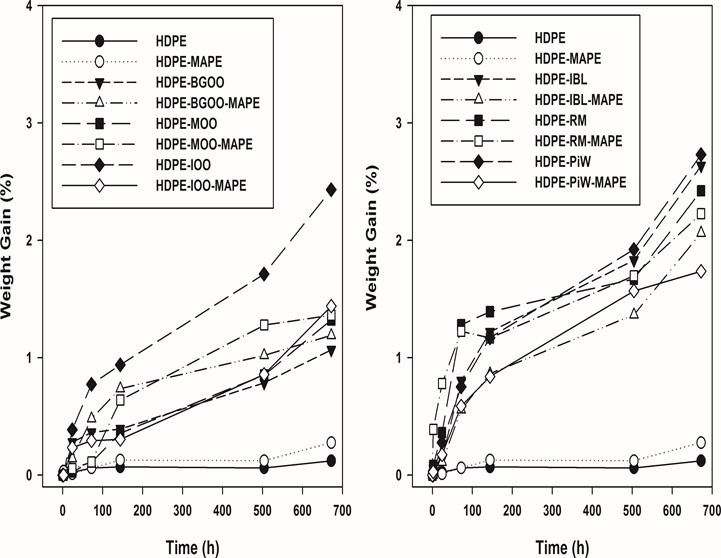
Fig. 3. Comparative water absorption plots for various WF composites over 672 h of soaking
Color is an important commercial property of the WPC (Fabiyi et al. 2008; Kim et al. 2008; Kallakas et al. 2015). Weathering of the WPC invariably causes undesirable color changes (Kim et al. 2008; Kallakas et al. 2015). Water absorbance is an important weathering test useful in understanding the durability of a thermoplastic composite (Kim et al. 2008; Kallakas et al. 2015). Weathering (e.g. water absorbance) causes the WF within the HDPE-composites to initiate chemical reactions, such as lignin degradation, into water soluble products that form chromophoric functional groups such as carboxylic acids, quinones, and hydroperoxy radicals (Fabiyi et al. 2008).
A comparison between the color values of the original composites with those of the soaked composites is shown in Fig. 5. Almost all of the composites exhibited an increased lightness (L*) following soaking. This trend was observed in other immersion tests employing WPCs (Kim et al. 2008; Kallakas et al. 2015). In contrast to this trend, HDPE-BGOO exhibited a 13% darkening response; whereas the HDPE-BGOO-MAPE exhibited a 1% lightening response. The L* values increased for both the composites containing MAPE and the composites without MAPE. Changes in the color values a* (redness) and b* (yellowness), C*ab (chromaticity, color quality), and H*ab (hue) values also occurred when comparing the original and soaked composites (Fig. 5).
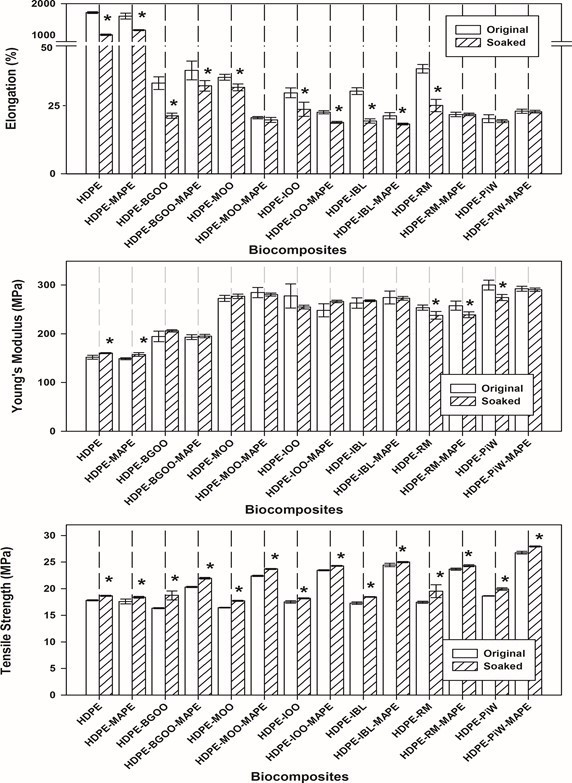
Fig. 4. Mechanical properties of original (unsoaked) and soaked composites; tensile bars were soaked for 672 h; the asterisk indicates a significant difference between the polymer treatments (P < 0.05)
Generally, a* and b* values decreased in the soaked composites compared to the a* and b* values for unsoaked composites. These color changes are associated with chemical and physical alterations from the composites in response to the presence of water. Nevertheless, the soaking treatment did not result in large changes in color for the WF-composites (Fig. 5). More notable changes in the color values occurred in the neat HDPE and HDPE-MAPE polymers than in the WF-composites (Fig. 5).
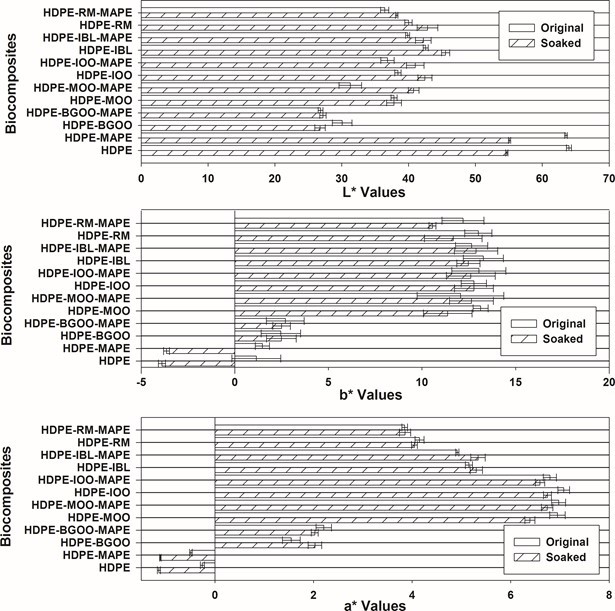
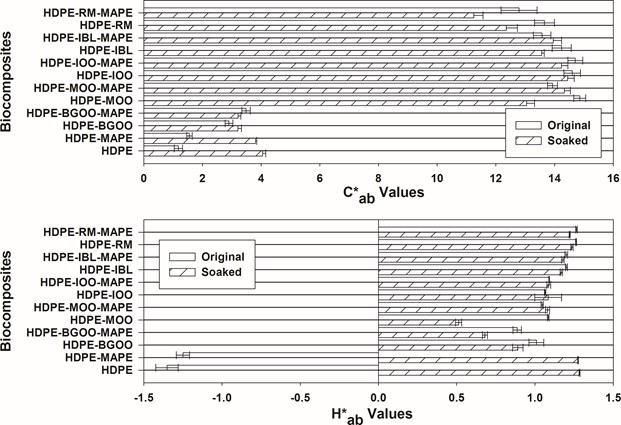
Fig. 5. Influence of soaking on color analysis of WF composites
Thermal Analysis
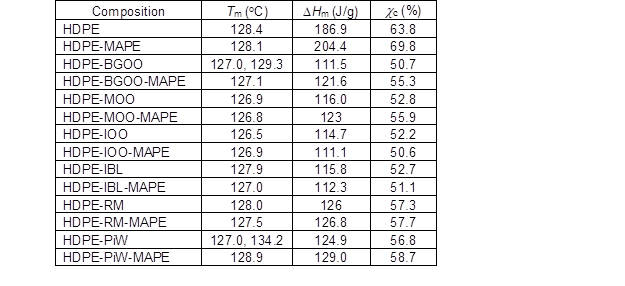
The thermal properties of WPCs are affected by the chemical and physical properties of the wood employed (Avérous and Le Digabel 2006; Lei et al. 2007; Kalia et al. 2009; Khalaf 2010). DSC thermal properties of the various WF composites are shown in Table 3. Usually, only a single endothermic (melting) and exothermic (crystallization) peak occurred in the DSC curves for the composites (Table 4). However, an occasional doublet Tm could occur (e.g., HDPE-BGOO and HDPE-PiW).
Composites regardless whether MAPE was added or not usually manifested slightly lower Tm values compared to that of neat HDPE. In contrast, other investigators have observed the Tm of WPC to be higher than neat HDPE (Avérous and Le Digabel 2006; Kalia et al. 2009). We speculate that the difference in the present observations may be due the disruption of the HDPE crystal lattice network by the interaction with the WF particles. Similarly, WPCs had lower crystallization and enthalpy melting values than neat HDPE (Table 3). The wood particles from the different species appeared to also have an effect on the crystallization values. For example, a blend containing HDPE-RM-MAPE exhibited a crystallinity level 9% less than neat HDPE; and blend containing HDPE-IOO-MAPE exhibited a crystallinity level 21% less than neat HDPE. Likewise other investigators have also observed that a decrease in the crystallinity values associated with various WPC compared to neat HDPE (Kalia et al. 2009; Khalaf 2010). Decrease in crystallinity (cc) and enthalpy (DHm) values have been attributed to the interaction of the wood filler and polymer chains (Khalaf 2010). MAPE incorporation with the composite only slightly affected the crystallinity levels when compared to composites without MAPE (Table 3). Particle size did not seem to greatly influence crystallinity values, since HDPE-BGOO, HDPE-MOO, and HDPE-IOO all exhibited similar values although they contained distinctly different particles sizes.
Table 3. DSC Thermal Data for Composites
Thermal stability of WPC is important to determine in order to ascertain the limits of temperature processing for the manufacture of WPCs. TGA analysis of WPCs and HDPE is presented in Table 4. The degradation of neat HDPE began at ~440 °C and ended with a maximum decomposition peak at ~460 °C (Table 4). HDPE degradation was 99 % complete at end of this stage. The TGA of the HDPE-MAPE blend parallels that of HDPE. In contrast, several degradation peaks are associated with the WPCs (Table 4). Depending on the species, the initial degradation temperature (lst Td) and decomposition peaks (peak 1) of the WF flour varied from 250 to 300 °C and 320 to 350 °C, respectively. This lower degradation peak is associated with the decomposition of hemicellulose and cellulose (Lee and Wang, 2006; Lei et al. 2007). Lignin degradation occurs at ~420 °C (Lee and Wang, 2006). This peak is masked by HDPE resin degradation. Residual weights of WPC varied between 6 to 10% due to the particular WF ingredients. Differences among the WF composite Td’s are due to the association of the filler material and the plastic resin. Presence of extractables may affect Td values (Lei et al. 2007). WPC with the coupling agent MAPE did not cause any discernible alteration of the degradation peaks. Based on these TGA results, all WPCs in this study should be considered free of thermal degradation incurred in their preparation since the processing temperatures did not exceed 200 °C.
Table 4. TGA Data for Composites
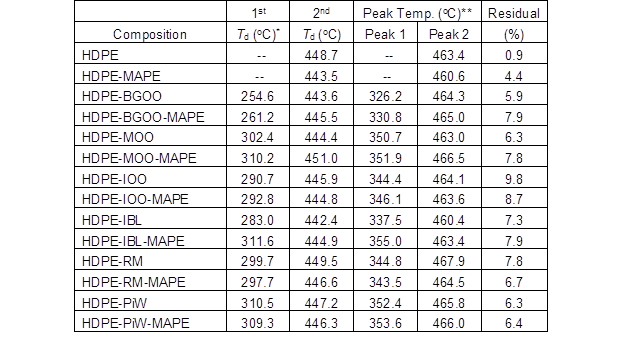
*Initial thermal degradation temperature (Td).
**Maximum degradation temperature.
Conclusions
- The WF incorporated into HDPE from three different woody tree species (Osage orange, red mulberry, and black locust) produced WPCs that exhibited mechanical and flexural properties that were similar to WPCs containing pine wood.
- Regardless of the species employed, the inclusion of a MAPE coupling agent created a WPC with mechanical and flexural properties that exceeded those of neat HDPE or composites without MAPE.
- The particle size influenced the mechanical and flexural properties of the OO composites. The HDPE-BGOO composites composed of particles of ≤ 177 µm invariably had inferior mechanical and flexural properties compared to HDPE-MOO or HDPE-IOO composites composed of particles of ≤ 400 µm.
- The WF derived from immature (36-month-old) trees produced a WPC that exhibited mechanical and flexural properties similar to the WPC derived by using mature (20-year-old) trees. This observation suggests that juvenile trees can provide an adequate WF for WPCs.
- All WPC soaked in water for 28 days exhibited increases in weight gain, alterations of mechanical properties, and color changes. The extent of weight gain was related to the WF species and the inclusion of a coupling agent. Generally, % El values decreased, E values were retained, and sU values increased in the soaked bars when compared to untreated bars. Generally, L* values increased whereas a* and b* values declined in the soaked bars when compared to the untreated bars.
Acknowledgements
The authors acknowledge Xavier Holford, Lauren Duvall, Dr. Arthur Thompson, and Kathy Hornbeck for their technical assistance. Mention of trade names or commercial products in this publication is solely for the purpose of providing specific information and does not imply recommendation or endorsement by the US Department of Agriculture. The USDA is an equal opportunity provider and employer.
References CITED
Abdelaal, M. Y., Elmossalamy, E. H., and Bahaffo, S. O. S. (2012). “Enhancement of polyolefins compatibility with natural fibers through chemical modification,” Am. J. Polym. Sci. 2(5), 102-108. DOI: 10.5923/j.ajps.20120205.04
Adamopoulos, S., Voulgaridis, E., and Passialis, C. (2005). “Variation of certain chemical properties within the stemwood of black locust (Robinia pseudoacacia L.),” Holz als Roh- und Werstoff 63, 327-333. DOI: 10.1007/s00107-005-0018-3
ASTM D-790. (2010). “Standard test methods for flexural properties of unreinforced and reinforce plastics and electrical insulated materials,” The American Society of testing and Materials, USA.
ASTM D-638. (1990). “Standard test methods for tensile properties of plastics,” The American Society of testing and Materials, USA.
Avérous, F., and Le Digabel, F. (2006). “Properties of biocomposites based on lignocelluosic fillers,” Carb. Polym. 66(4), 480-493. DOI: 10.1016/j.carbpol.2006.04.004
Barbour, J. R., Read, R. A., and Barnes, R. L. (2008). “Morus L.: Mulberry,” in: The Woody Plant Seed Manual Agricultural Handbook No. 727, F. T. Bonner and R. P. Karrfalt (eds.), U.S. Department of Agriculture, Forest Service, Washington, D.C., pp. 728-732.
Bouafif, H., Koubaa, A., Perre, P., and Cloutier, A. (2009). “Effects of fiber characteristics on the physical and mechanical properties of wood plastic composites,” Compos. Part A- Appl. Sci., 40, 1975-1981. DOI: 10.1016/j.compositesa.2009.06.003
Burden, D. (2012). “Forestry profile,” Ag MRC, (http://www.agmrc.org/commodities__products/forestry/forestry-profile/), Accessed 23 February 2017.
Darie, R. N., Bercea, M., Kozlowski, M., and Spiridon, I. (2011). “Evaluation of properties of LDPE/oak wood composites exposed to artificial ageing,” Cell. Chem. Technol. 45(1-2), 127-135.
Dickerson, J. (2002). “Plant guide for black locust (Robinia pseudoacacia L.),” (http://plants.usda.gov/factsheet/pdf/fs_rops.pdf), Accessed 2 February 2017.
Eilperin, J. (2010). “The unintended ripples from biomass subsidy program,” The Washington Post, (http://www.washingtonpost.com/wp-dyn/content/article/2010/01/09/AR2010010902023.html), Accessed 23 February 2017.
Energy Independence and Security Act of 2007. (2007). Public Law 110-130-Dec. 19, 2007. US Govt. Pub. Office, Washington DC, (https://www.gpo.gov/fdsys/pkg/PLAW-110publ140/pdf/PLAW-110publ140.pdf).
English, G. J, and Ewing, T. W. (2002). “Vision for bioenergy & biobased products in the United States,” Biomass Research and Development Technical Advisory Committee, USDOE, USDOT, USEPA, USDA, Washington DC. (http://www.usbiomassboard. gov/pdfs/biovision_03_webkw.pdf), Accessed 31 July 2017.
Fabiyi, J. S., McDonald, A. G., Wolcott, M. P., and Griffiths, P. R. (2008). “Wood plastic composites weathering: Visual appearance and chemical changes,” Polym. Degrad. Stabil. 93(8), 1405-1414. DOI: 10.1016/j.polymdegradstab.2008.05.024
Habibi, Y., El-Zawawy, W. K., Ibrahim, M. M., and Dufresne, A. (2008). “Processing and characterization of reinforced polyethylene composites made with lignocellulosic fibers from Egyptian agro-industrial residues,” Compos. Sci. Technol. 68, 1877-1885. DOI: 10.1007/s10924-011-0382-5
Harnnecker, F., Rosa, D. D. S., and Lenz, D. M. (2012). “Biodegradable polyester-based blend reinforced with Curauá fiber: Thermal, mechanical and biodegradation behavior,” J. Polym. Environ. 20, 237-244. DOI: 10.1007/s10924-011-0382-5
Kalia, S., Kaith, B. S. and Kaur, I. (2009). “Pretreatment of natural fibers and their application as reinforcing material in polymer composites-a review,” Polym. Eng. Sci. 49(7), 1253-1272. DOI: 10.1002/pen.21328
Kallakas, H., Potimäe, T., Süld, T. M., and Krumme, A. (2015). “The influence of accelerated weathering on the mechanical and physical properties of wood-plastic composites,” Proc. Est. Acad. Sci. 64(1S), 94-104. DOI: 10.3176/proc.2015.1S.05
Kalyankar, R. R., and Uddin, N. (2012). “Structural characterization of natural fiber reinforced polymeric (NFRP) laminates for building construction,” J. Polym. Environ. 20, 224-229. DOI: 10.1007/s10924-011-0377-2
Khalaf, M. (2010). “Effect of alkali lignin on heat of fusion, crystallinity and melting points of low density polyethylene (LDPE), medium density polyethylene (MDPE) and high density polyethylene (HDPE),” J. Thi-Qar Sci. 2(2), 89-95.
Kim, J., Harper, D. P., and Taylor, A. M. (2008). “Effect of wood species on water sorption and durability of wood-plastic composites,” Wood Fiber Science 40(4), 519-531.
Lee, S. -H., and Wang, S. (2006). “Biodegradable polymers/bamboo fiber biocomposite with bio-based coupling agent,” Comp. Part A. 37(1), 80-91. DOI: 10.1016/j.compositesa.2005.04.015
Lei, Y., Wu, Q., Clemons, C. M., Yao, F., Xu, Y. (2007). “Influence of nanoclay on properties of HDPE/wood composites,” J. Appl. Polym. Sci. 106(6), 3958-3966. DOI: 10.1002/app.27048
LeVan-Green, S. L., and Livingston, J. (2001). “Exploring the uses for small-diameter trees,” Forest Prod. J. 51(9), 10-21.
Meister, S.A. (2006). “Top 10 fuel trees for zone 5 and above,” (http://permaculturetokyo.blogspot.com/2006/05/top-10-fuel-trees-for-zone-5-and-above.html), Accessed 23 February 2017.
Millman, J. (2008). “Sawdust shock: A shortage looms as economy slows,” The Wall Street Journal, (http://online.wsj.com/article/SB120451039119406735.html), Accessed 23 February 2017.
Myers, G. C., Barbour, R. J., and AbuBakr, S. M. (2003). Small-Diameter Trees Used for Chemithermomechanical Pulps (Report No.: FPL-GTR-141), U.S. Department of Agriculture, Forest Products Laboratory, Madison, WI.
Rosa, S. M. L., Santos, E. F., Ferreira, C. A., and Nachtigall, S. M. B. (2009). “Studies on the properties of rice-husk-filled-PP composites—Effect of maleated PP,” Mater. Res. 12(3), 333-338. DOI: 10.1590/S1516-14392009000300014
Salem, M. Z. M., and Mohamed, N. H. (2013). “Physico-chemical characterization of wood from Maclura pomifera (Raf.) C. K. Schneid. Adapted to the Egyptian environmental conditions,” J. For. Prod. Ind. 2(2), 53-57. DOI:. 10.1007/BF02859211.
Slater, C. S., Simmons, B. A., Rogers, T. S., Philllips, M. F., Nordahl, K., and Davison, B. H. (2015). “The DOE BioEnergy Research Centers: History, operations, and scientific output,” BioEnergy Res. 8(3), 881-896. DOI: 10.1007/S12155-015-9660-8.
White, E. (2010). “Woody biomass for bioenergy and biofuels in the United States—a briefing paper,” (http://www.fsl.orst.edu/lulcd/Publicationsalpha_files/White_pnw_gtr825.pdf), Accessed 23 February 2017.
Wynia, R. (2011). “Plant guide for Osage orange (Maclura pomifera),” (http://plants.usda.gov/plantguide/pdf/pg_mapo.pdf), Accessed 23 February 2017.
Yemele, M. C. N., Koubaa, A., Cloutier, A., Souloungaga, P., Stevanovic, T., and Wolcott, M. P. (2013). “Effects of hot water treatment of raw bark, coupling agent, and lubricants on properties of bark/HDPE composites,” Ind. Crop. Prod. 42, 50-56. DOI: 10.1016/j.indcrop.2012.05.012
Zahedi, M., Tabarsa, T., Ashori, A., Madhoushi, M., and Shakeri, A. (2012). “A comparative study on some properties of wood plastic composites using canola stalk, Paulownia, and nanoclay,” J. Appl. Polym. Sci. 129(3), 1491-1498. DOI: 10.1002/app.38849
Zion Market Research. (2017). “Global wood plastic composites market will reach USD 8.76 billion by 2022: Zion market research,” (http://www.marketwatch.com/story/global-wood-plastic-composites-market-will-reach-usd-876-billion-by-2022-zion-market-research-2017-02-13), Accessed 23 February 2017.
Article submitted: July 5, 2017; Peer review completed: August 26, 2017; Revised version received: August 31, 2017; Accepted: September 1, 2017; Published: September 12, 2017.
DOI: 10.15376/biores.12.4.7898-7916