
Abstract
A new method for wood identification using terahertz (THz) time-domain spectroscopy (TDS) is presented. THz-TDS technology is an emerging method of spectral analysis method that shows great advantages in wood non-destructive testing. Wood is opaque in the optical and near infrared spectrum, and relatively transparent in the THz band. In this experiment, four wood species (Pinus densiflora, Pinus sylvestris, Pseudotsuga menziesii, and Cunninghamia lanceolata) were selected as samples. Optical parameters such as absorption coefficient and refractive index of the measured samples can be extracted from THz time-domain spectra. Principal component analysis was introduced to reduce the dimensionality of the THz spectral data of the wood. The principal component score matrix of the wood was obtained and used as a characteristic matrix. A wood classification model was established using a support vector machine. The experimental results showed that THz-TDS had excellent performance in wood recognition. This research lays a theoretical and application foundation for the application of THz technology in the field of wood detection and recognition. It also provides a new direction and technical scheme in the wood identification field.
Download PDF
Full Article
Wood Species Identification Using Terahertz Time-domain Spectroscopy
Yuan Wang,a,b,c Shuai She,a,b Nan Zhou,d Junguo Zhang,a,b Hao Yan,a,b and Wenbin Li a,b,*
A new method for wood identification using terahertz (THz) time-domain spectroscopy (TDS) is presented. THz-TDS technology is an emerging method of spectral analysis method that shows great advantages in wood non-destructive testing. Wood is opaque in the optical and near infrared spectrum, and relatively transparent in the THz band. In this experiment, four wood species (Pinus densiflora, Pinus sylvestris, Pseudotsuga menziesii, and Cunninghamia lanceolata) were selected as samples. Optical parameters such as absorption coefficient and refractive index of the measured samples can be extracted from THz time-domain spectra. Principal component analysis was introduced to reduce the dimensionality of the THz spectral data of the wood. The principal component score matrix of the wood was obtained and used as a characteristic matrix. A wood classification model was established using a support vector machine. The experimental results showed that THz-TDS had excellent performance in wood recognition. This research lays a theoretical and application foundation for the application of THz technology in the field of wood detection and recognition. It also provides a new direction and technical scheme in the wood identification field.
Keywords: Wood identification; THz-TDS; Principal component analysis; SVM
Contact information: a: School of Technology, Beijing Forestry University, Beijing 100083, P.R. China; b: Key Lab of State Forestry and Grassland Administration for Forestry Equipment and Automation, Beijing 100083, P.R. China; c: Joint International Research Institute of Wood Nondestructive Testing and Evaluation, Beijing Forestry University, Beijing 100083, P.R. China; d: State Key Laboratory of Precision Measurement Technology and Instrument, Tianjin University, Tianjin 300072, P.R. China; *Corresponding author: leewb@bjfu.edu.cn
INTRODUCTION
Wood as a resource has played an important role in the history of human beings. It is widely used in various fields of daily life. More than 60,000 types of trees grow on the earth (Beech et al. 2017). There are distinctive variations in properties, prices, and applications of different wood species. Therefore, wood species identification is of great significance for wood-related industries and the wood market.
Traditional methods for wood species identification rely on macroscopic characteristics, anatomical features, DNA recognition, etc. (Degen and Fladung 2008; Dev et al. 2014). However, these methods have their drawbacks. Macroscopic identification is usually applicable only at the genus level, while anatomical feature recognition method is limited by knowledge of wood anatomy. Current methods for DNA identification of wood can accurately identify some wood types. However, they are not applicable to all species, in terms of separating species within a genus. Degradation of wood DNA occurs during the formation, storage, and processing of wood, which makes it difficult to extract high-quality wood DNA, and some wood DNA sequence information is difficult to measure, which makes online detection impractical. Consequently, to realize rapid and non-destructive wood identification’s purpose, many researchers resort to spectral analysis methods such as hyperspectral imaging, Fourier transform near-infrared (FT-NIR), etc. Among these, NIR is the most commonly adopted method. Borga et al. (1992) first discovered the ability of NIR to identify wood. They applied NIR to distinguish between heartwood and sapwood (Borga 1992). Horikawa et al. (2015) applied NIR to classify Pinus densiflora and P. thunbergii, which are anatomically similar (Horikawa 2015). Yang et al. successfully identified wood species from different locations by applying NIR (Yang et al. 2015). However, there are still shortcomings with this method, including serious overlapped bands, low absorption intensity, vulnerability to external environment, and limitations in accuracy.
Terahertz (THz) spectroscopy is a state-of-the-art spectral analysis technique. The THz spectrum contains abundant physical and chemical information of the measured object. The THz spectroscopy output can reveal a wealth of structural information of molecules by measuring the frequencies of the inter- or intramolecular vibrational modes (Yang et al. 2012). THz-TDS spectrum can be used to calculate the physical and chemical parameters such as the absorption coefficient, refractive index and dielectric constant of the sample. These parameters can be used to analyze the composition, structure, physical and chemical properties of the materials. A number of studies on the identification of explosives, drugs, and Chinese medicine by THz spectroscopy have been published (Zhang et al. 2007a; Puc et al. 2015; Sterczewski et al. 2017).
In summary, THz spectroscopy can serve as a promising tool in wood species identification. Wood is opaque in the optical and near infrared spectrum, but it is almost transparent to the THz wave. There have been several reports on the interaction of THz radiation with wood (Reid and Fedosejeves 2006; Jackson et al. 2009; Jördens et al. 2010; Inagaki et al. 2014; Tanaka et al. 2014). However, few studies have been applied to wood identification using THz spectroscopy.
In this paper, a new method using THz time-domain spectroscopy (THz-TDS) to achieve wood identification is presented. In the proposed scheme, principal component analysis (PCA) is used to reduce the dimensions of the THz absorption spectrum, and a wood classification model is established by using a support vector machine (SVM). Experimental results indicated that THz-TDS has a good identification effect in the four kinds of wood selected for this work. As a developing spectral analysis technology, THz-TDS provides a new method or a supplement to the NIR in wood identification.
THEORY
THz-TDS
The terahertz wave refers to an electromagnetic wave having a frequency in the range of 0.1 THz to 10 THz. The wavelength is in the range of 0.03 to 3 mm, which is between the microwave and the infrared (Pan et al. 2018). Since its frequency range is at the boundary frequency between light and electromagnetic waves, it is called millimeter wave and submillimeter wave in the field of electronics, while it is called far infrared ray in the field of spectroscopy.
The significance of studying THz radiation is not only reflected in the particular frequency range in which it is located, but also because THz radiation has many unique properties and has broad application prospects.
A typical width of a THz pulse is a few ps, which is typically sampled and measured using a femtosecond pulse. The sampling time is very short, which can effectively suppress the interference of background noise. Therefore, THz detection technology has a high signal to noise ratio up to 105, which is much higher than other spectral measurement techniques.
THz pulses are broadband. A THz pulse contains a frequency segment that reflects the characteristics of the sample to be tested. Many material macromolecules have rotational energy levels in the THz band, so they exhibit strong absorption and resonance in the terahertz band. The THz wave is very sensitive to small changes in the structure of the material. By using the different absorption spectra of the THz band, the material composition, structure and interaction can be analyzed.
The energy of the THz pulse is very low. The photon energy of 1THz is only 4.14 meV, which is very safe for the human body (Cao 2003).
THz radiation has good penetrability for many non-polar materials and dielectric materials, including wood. THz radiation also has good coherence. THz radiation is generated by dipole oscillation driven by coherent current, or by coherent laser pulse generated by nonlinear optical difference frequency effect. THz coherent measurement technology can directly measure electric field amplitude and phase, then the refractive index and absorption coefficient of the sample can be extracted conveniently.
The THz-TDS signal can be represented by a transform domain representation method such as time domain, frequency domain, and time-frequency domain. The original THz-TDS signal is a time-domain signal. The advantage of THz time-domain spectrum is that it is intuitive, but it does not clearly reveal the intrinsic information of the signal. After Fourier transform processing, the time-domain THz-TDS signal can be transformed into a frequency-domain signal, in which one can analyze the characteristic peak of the material fingerprint and calculate the complex refractive index. Further on, time-frequency analysis of THz signal can be performed by wavelet transform and short-time Fourier transform (STFT), etc. Time-frequency analysis can provide joint distribution information in time-domain and frequency-domain.
Principal component analysis (PCA) principle
Principal component analysis is a statistical analysis method that turns the original multiple variables into a few comprehensive indicators (Liu et al. 2016). From a mathematical point of view, this is a dimensionality reduction processing technique.
For the multi-dimensional data processing procedure, it is necessary to reduce the data dimensions for efficient processing (Xu et al. 2010). Generally, multiple modified indicators are used to replace the original variable indicators (Yi et al. 2016). The PCA can depict abundant information reflected by many indicators and they are independent from each other.
Suppose that there are n data samples and each sample has p variable descriptions. Thus, an n × p-order data matrix X can be formed, and the original variable indicators (dimensions) are denoted as x1, x2, …, xp. Their synthesis indicators, namely the new variable indicators, are denoted as z1, z2, …, zm (m < p), respectively, as shown by Eq. 1:
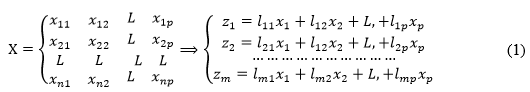
The new variable indicators z1, z2, …, zm determined in this way are respectively denoted as the first, second, … etc.; m principal components represent the original variable indicators of x1, x2, …, xp. Among them, z1 accounts for the largest proportion of the total variance and the variance of z1, z2, …, zm in turn decreases.
From above analysis, the principal component is the determination of the load lij (i = 1, 2, …, m; j = 1, 2, …, p) of the original variable xj (j = 1, 2, …, p) on the principal component zi (I = 1, 2, …, m). It can be deduced by mathematical methods that they are the eigenvectors corresponding to the m larger eigenvalues of the correlation matrix of the x1, x2, …, xp.
SVM principle
A SVM is a supervised learning method that is mainly used for the learning, classification, and prediction of small sample data (Foody and Mathur 2004). It is widely used in statistical classification and linear regression. Its basic model is a linear classifier with the largest interval defined on the feature space. For linear inseparable cases, the linear inseparable sample of the low dimensional input space is transformed into a high dimensional feature space by using the nonlinear mapping algorithm to make it linearly separable. The linear algorithm is used for the sample in the high dimensional feature space and nonlinear characteristics are analyzed via linear analysis (Wu and Yang 2015).
The main goal of SVM is to establish an optimal decision-making hyper plane, which maximizes the distance between two nearest plane samples from two sides of the plane, thus providing a good generalization ability for the classification problem (Rizk et al. 2013). For a multidimensional sample set, the system can randomly generate a hyper plane, move continuously, and classify the samples until both sides of the hyper plane become the sample points in the training sample. There are multiple hyper planes under this condition. The SVM formally seeks classification accuracy while classifying samples. The best classification of linearly separable samples is achieved by maximizing the blank area on both sides of the hyper plane.
Linear classification
For linear separable problems, the samples are classified by solving the hyper plane with the largest geometric interval.
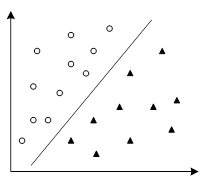
Fig. 1. Linear separable sample
Assume that the support vector is (xi, yi)and the solution of the hyper plane is (w, b). Therefore, it requires the largest geometric interval. The problem of finding the maximum distance on both sides of the hyperplane can be solved using Eq. 2.
![]()
The Lagrangian function can be obtained by using the Lagrange multiplier method:
![]()
By using the Lagrangian multiplier method, the optimal solution α is obtained. Then, w and b are obtained, and therefore the classification hyper plane is obtained through. wTx + b = 0 The decision function is denoted as follows:
![]()
The sign function is used to extract the sample symbols for sample category determination.
Nonlinear classification
For nonlinear classification, SVM uses the inner product kernel function to convert the process into a linear classification process by mapping the sample set into high-dimensional space, and then its classification hyper plane is solved (Zhang et al. 2007b).
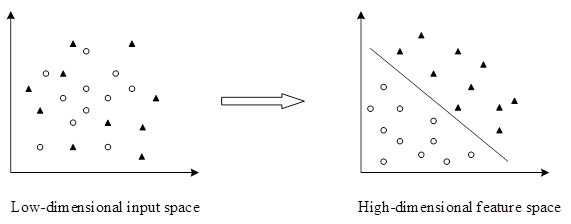
Fig. 2. Low-dimensional spatial linear inseparable samples mapped into high-dimensional space for generating linearly separable samples
For ![]() meets the requirement that,
meets the requirement that,
![]()
where is a mapping from input space X to feature space F and k (x, y)is a kernel function.
The corresponding classification function is,
![]()
where ![]() .
.
The commonly used kernel functions are presented as follows:
Linear kernel function:
![]()
Polynomial kernel function:
![]()
Radial basis kernel function,
![]()
where σ is the parameter; and lastly, the Sigmoid kernel function:
![]()
EXPERIMENTAL
Materials
The authors prepared four kinds of wood samples from the market: Pinus densiflora, Pinus sylvestris, Pseudotsuga menziesii, and Cunninghamia lanceolata. In order to ensure the uniformity of experimental conditions, heartwood was chosen from all four kinds of wood, and each sample was cut in the same direction to prepare a radial section wood block of 50 mm × 30 mm × 5 mm. A total of 30 wood blocks were obtained for each species, namely 120 samples in total.
Before the THz-TDS of wood samples was performed, all wood samples were placed in an indoor environment with a relative humidity of 22% and a temperature of 20 ℃ to ensure that the moisture content of all wood samples was within the same range.
Methods
The THz spectra of wood samples were collected by the THz-TDS system at the State Key Laboratory of Precision Measurement Technology and Instruments in Tianjin University, China. The block diagram of the THz-TDS system is shown in Fig. 3.
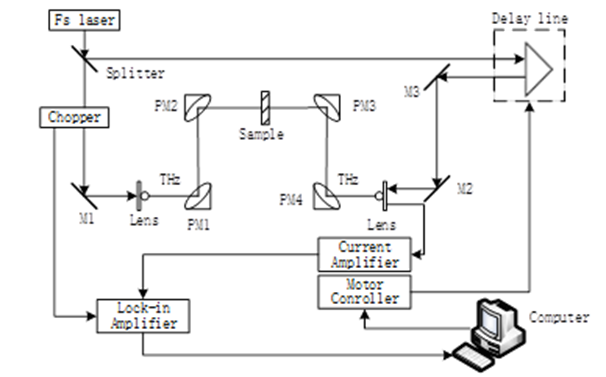
Fig. 3. Block diagram of THz-TDS system
The THz-TDS employs a pump-probe technique. The pump and probe light source adopts a femtosecond (fs) laser with a wavelength of 1560 nm, pulse width of 90 fs, and repetition rate of 100 MHz. The femtosecond pulses were divided into two beams through a beam splitter. The stronger beam was used as the pump light and the other one as a probe light. The pump light activated the photoconductive antenna to generate the THz pulse. The probe light passed through the time delay line and then activated the photoconductive antenna to detect the THz pulse that passed through the sample. On the photoconductive antenna detector a direct current proportional to the electric field of the received THz radiation can be obtained. A lock-in amplifier amplified the current signal, and then it was sent to the computer for further processing.
The wood samples were placed at the communal focus of parabolic mirror PM2 and PM3 of THz-TDS system. The transmission spectra of samples can be obtained by a scanning operation. A set of reference spectra with no samples were measured before the scanning operation. The frequency domain spectra of the sample and reference signals were obtained after fast Fourier transform (FFT) was applied to time the domain signal. During the experiment, the relative humidity was 22.6% and the temperature was 19 ℃. The sampling interval was 26 fs and the sampling length was 80 ps.
RESULTS AND DISCUSSION
Experimental Sample
Due to factors such as the environmental conditions of the experimental site and the accuracy of the instrument itself, the THz time-domain spectrum of wood sample may have a small deviation. In order to reduce the THz time-domain spectral sampling error caused by external factors, the spectral data were collected three times for each sample, then taking the average as the spectral data of the sample (Li et al. 2014). The time domain spectra of four wood types were obtained and are shown in Fig. 4. The THz time-domain spectra passing through the samples showed that time delay and amplitude decreased when compared with the reference spectrum. The spectral delays of Pinus densiflora, Pseudotsuga menziesii, and Cunninghamia lanceolata were basically the same while the time delay of Pinus sylvestris was slightly longer.
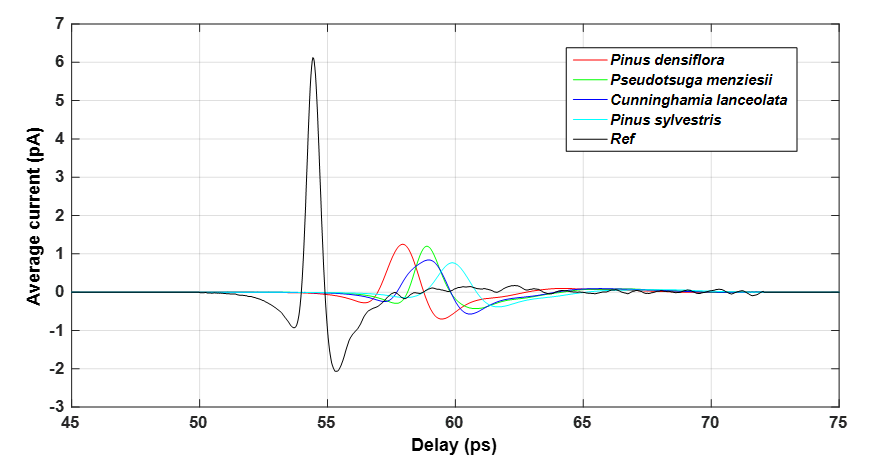
Fig. 4. Time-domain waveform of four kinds of wood
To eliminate the data measurement error caused by factors such as equipment accuracy and the water vapor in the air as well as the oscillation caused by the reflection and refraction of the THz wave, the wood THz time domain spectral data were windowed and intercepted.
The main peak of Pinus densiflora was at 57.94 ps with an amplitude of 1.25 pA; the main peak of Pseudotsuga menziesii was at 58.88 ps with an amplitude of 1.20 pA; the main peak of Cunninghamia lanceolata was at 58.96 ps with an amplitude of 0.84 pA; the main peak of Pinus sylvestris was at 59.87 ps with an amplitude of 0.77 pA; and the main peak of the reference was at 54.43 ps with an amplitude of 6.12 pA. The THz time-domain spectrum of wood samples showed time-delay and energy attenuation in the time domain, indicating that THz is feasible for wood identification.
Figure 5 shows the THz frequency-domain spectra. The change of wood spectrum from THz time-domain to THz frequency-domain is obtained via a Fourier transform step. Due to the obvious noise of the first and the last spectrum, as well as the low data credibility, the data in the 0.2 to 2 THz band are selected for processing and analysis.
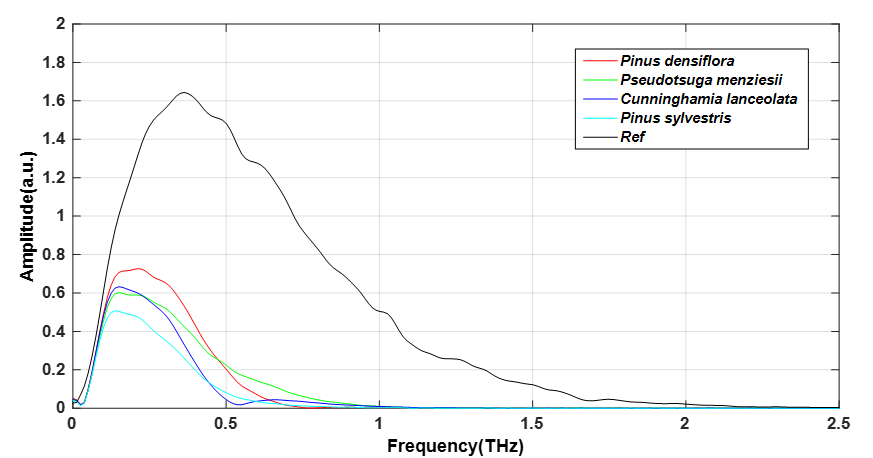
Fig. 5. Frequency-domain waveform of four kinds of wood
From the THz frequency spectrum images, it can be seen that the frequency spectra of four wood samples were similar except for minor differences in magnitude and speed aspects. Compared with the reference spectrum, the amplitude of four wood samples decreased greatly and dropped to 0 in the 0 to 1 THz band. The Pinus sylvestris had the smallest amplitude and the fastest drop, followed by Pseudotsuga menziesii, then Pinus densiflora, and finally Cunninghamia lanceolata.
According to the optical constants extracting model based on THz time-domain spectroscopy proposed by Dorney and Duvillaret (Li et al. 2017), the absorption coefficient and refractive index can be calculated based on THz frequency. The refractive index of THz spectrum can be expressed as follows,
![]()
and the expression of the absorbance is shown below in Eq. 8,
![]()
where ![]() denotes the real part of refractive index; d denotes the sample thickness; c denotes the velocity of the THz wave propagating in a vacuum;
denotes the real part of refractive index; d denotes the sample thickness; c denotes the velocity of the THz wave propagating in a vacuum; ![]() denotes angular frequency; and
denotes angular frequency; and ![]() represent the amplitude ratio and phase difference of sample signal/reference signal, respectively. Figure 6 shows the absorbance waveform of four wood samples.
represent the amplitude ratio and phase difference of sample signal/reference signal, respectively. Figure 6 shows the absorbance waveform of four wood samples.
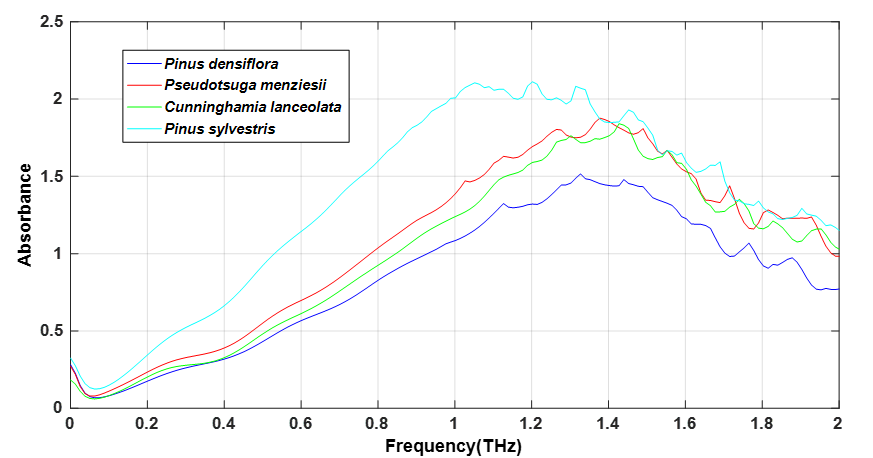
Fig. 6. The absorbance waveform of four kinds of wood
Through the absorption spectrum, it can be seen that the absorption intensity of four wood types for THz waves was different and the absorption peaks varied, which provided the possibility for classification and identification after the mathematical modeling analysis step. Figure 6 shows that the four wood absorption data after 1.5THz had more seriously overlapping bands, and the noise was larger. In order to reduce the influence of noise, the data of 0.2~1.5THz frequency band was selected for further research. Among them, Pinus densiflora showed obvious absorption peaks at 1.127 THz, 1.327 THz, and 1.440 THz; Pseudotsuga menziesii showed obvious absorption peaks at 1.026 THz, 1.265 THz, and 1.377 THz; Cunninghamia lanceolata showed obvious absorption peaks at 1.302 THz and 1.427 THz; and Pinus sylvestris showed obvious absorption peaks at 1.051 THz, 1.202 THz, and 1.315 THz. The absorption line trends of Pseudotsuga menziesii and Cunninghamia lanceolata were similar. However, positions of the absorption peak were quite different. Therefore, by selecting the wood absorption data under the characteristic frequency, it can be classified and identified after the data processing procedure.
The absorption peaks of the four wood types were located at different frequencies on the absorption coefficient spectra; thus preliminary wood identification was achieved according to various absorption peaks. However, the recognition step was still challenging as the absorption peak locations of different wood were close. Moreover, some underlying reasons may cause the emergence of an absorption peak at the same time, including moisture, light refraction, and so on. To accurately classify the wood species, it is necessary to build a mathematical model of the wood THz spectrum data for further wood species identification research.
RESULTS AND DISCUSSION
Chemometric Analysis
The THz spectrum contains not only the compositional and structural information of the tested wood, but also the noise, background information, and other system interferences, which makes the THz spectrum information complex. In some cases it may even annihilate the useful information, which greatly affects the accuracy of the recognition model. Therefore, to remove the overlapped information in the spectrum as much as possible, a chemometrics analysis was conducted as an essential part.
PCA Analysis
In this paper, the PCA method was used to remove the overlapped information in the absorption coefficient spectra. As a dimension reduction method, PCA can reduce the redundant components with less influence on the classification features, improving the clustering effect of data. The PCA has been applied to 120 wood samples to perform a cluster analysis.
The eigenvalues and accumulating contribution rates of the first 10 principal components are shown in Table 1. The accumulating contribution rates of the first 10 principal components reached 80.78%, which can reflect most of the information in the original spectral data. Therefore, the authors replaced the original spectral data with the first 10 principal component score matrices. The dimensions of the original data matrix were reduced from 120 61 to 120 33.
Table 1. Accumulating Contribution Rate of Principle Components
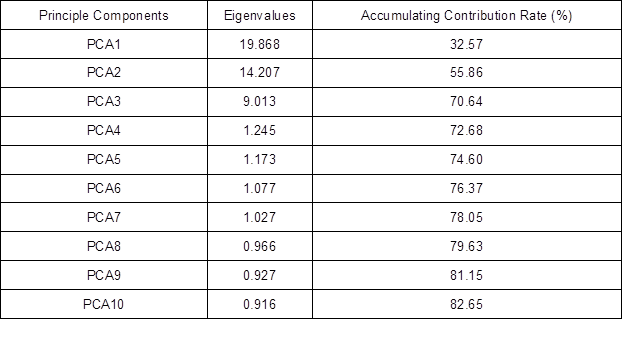
Figure 7 shows the score plot of the top ten principal components. The four kinds of wood were divided into different areas without interlacing in the figure. It can be concluded that PCA had a good clustering effect on the absorption coefficient spectra of the different wood species. Therefore, the four wood species can be identified qualitatively based on principal component analysis. To quantitatively analyze the identification results, the authors used SVM to establish an analytical model.
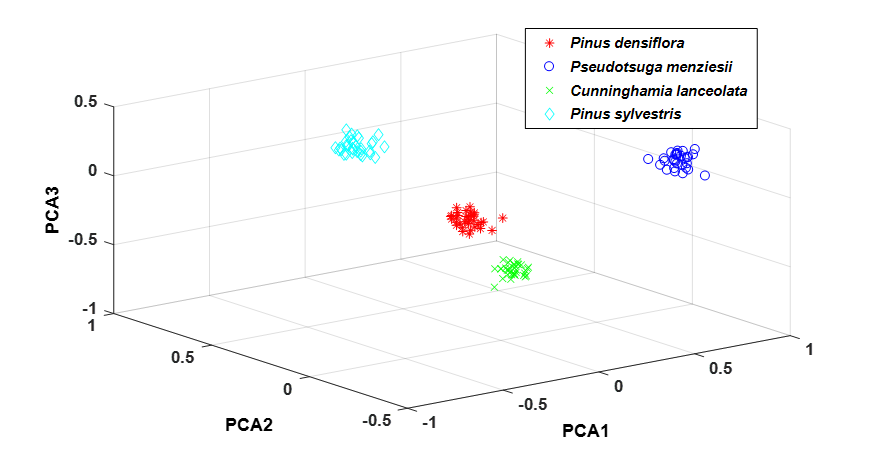
Fig. 7. Principal component score plot of four kinds of wood
SVM Model
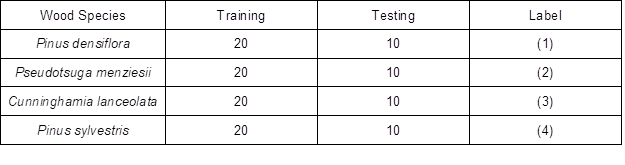
In the experiment, the first 10 principal component score matrices were chosen to establish a SVM wood classification model. The authors divided 30 samples of each wood species into two groups. One group with 20 samples was used as training set and the other with 10 samples was the testing set. The training set data and the test set data were composed of sample data and sample numbers. The four different wood samples were numbered as (1), (2), (3), and (4). Table 2 shows the training set data, test set data, and the numbering for the four sample woods.
Table 2. Training Set Data, Test Set Data, and Numbering for the Four Sample Woods
The training set was used to train the SVM classifier, and then the model was used to predict the test set. Lastly, the classification results of the four wood samples were obtained through this model. Table 3 provides the classification results by using the different kernel functions.
Table 3. Identification Results of SVM Model on Four Wood Samples
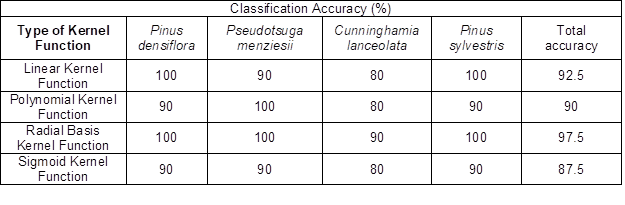
It can be seen from the experimental results that the SVM models established by the four kernel functions had different results in the wood classification process. The results showed that the SVM models established by the four kernel functions had different classification accuracy for different wood types. The SVM model based on the Sigmoid Kernel Function had the lowest classification accuracy of the four wood samples with 87.5%. The SVM model based on the Linear Kernel Function and the Polynomial Kernel Function had similar classification accuracy for the four woods with 92.5% and 90%, respectively. By comparison, the SVM model based on the Radial Basis Kernel Function had the highest classification accuracy rate of the four wood samples, reaching 97.5%.
Therefore, the authors used the SVM model based on the Radial Basis Kernel Function as the final wood classification model. The parameters of the model were determined using the grid method (Chao and Horng 2015): C = 2 and g = 0.0313. Therefore, the radial basis kernel function was used to establish the SVM wood identification model.
CONCLUSIONS
In this work, the authors used THz-TDS to identify Pinus densiflora, Pinus sylvestris, Pseudotsuga menziesii, and Cunninghamia lanceolata. The results showed that the THz spectroscopy had a high degree of differentiation for the four kinds of wood. The spectral data in the frequency-domain showed that the different wood types had completely different absorption effects on the THz waves at different frequencies.
The optical parameters of wood can be extracted from the wood THz spectrum. The results showed that the absorption of different wood on the THz wave can be analyzed by the wood absorption spectrum. The THz classification and identification model of wood can be established by using these properties.
The authors used PCA to reduce the absorption spectrum of wood and data redundancy, as well as to study and then analyze the SVM model established by different kernel functions. The results showed that the wood identification accuracy through the SVM model established by the Radial Basis Kernel Function reached 97.5%.
ACKNOWLEDGMENTS
The authors are grateful for the Fundamental Research Funds for Central Universities (BLX2015-32 and 2016ZCQ08) and the National Natural Science Foundation of China (51605031).
The authors thank the State Key Laboratory of Precision Measurement Technology and Instruments of Tianjin University for the use of their equipment.
REFERENCES CITED
Beech, E., Rivers, M., Oldfield, S., and Smith, P. P. (2017). “GlobalTreeSearch: The first complete global database of tree species and country distributions,” J. Sustainable For. 36(5). 454-489. DOI: 10.1080/10549811.2017.1310049
Borga, P., Hämäläinen, M., and Theander, O. (1992). “Correlations between near-infrared spectra of wet-stored timber and the storage time in relation to the water quality,” Holzforschung 46(4), 299-303. DOI: 10.1515/hfsg.1992.46.1.0
Cao, J. C. (2003). “Interband impact ionization and nonlinear absorption of terahertz radiation in semiconductor heterostructures,” Physical Review Letters 91(23), 237401.
Chao, C. F., and Horng, M. H. (2015). “The construction of support vector machine classifier using the firefly algorithm,” Computational Intelligence and Neuroscience 2015, Article ID 212719. DOI: 10.1155/2015/212719
Degen, B., and Fladung, M. (2008). “Use of DNA-markers for tracing illegal logging,” Landbauforschung Volkenrode 321, 6-14.
Dev, S. A., Muralidharan, E. M., Sujanapal, P., and Balasundaran, M. (2014). “Identification of market adulterants in East Indian sandalwood using DNA barcoding,” Annals of Forest Science 71(4), 517-522. DOI: 10.1007/s13595-013-0354-0
Foody, G. M., and Mathur, A. (2004). “Toward intelligent training of supervised image classifications: Directing training data acquisition for SVM classification,” Remote Sensing of Environment 93(1-2), 107-117. DOI: 10.1016/j.rse.2004.06.017
Horikawa, Y., Mizuno-Tazuru, S., and Sugiyama, J. (2015). “Near-infrared spectroscopy as a potential method for identification of anatomically similar Japanese diploxylons,” Journal of Wood Science 61(3), 251-261. DOI: 10.1007/s10086-015-1462-2
Inagaki, T., Hartley, I. D., Tsuchikawa, S., and Reid, M. (2014). “Prediction of oven-dry density of wood by time-domain terahertz spectroscopy,” Holzforschung 68(1), 61-68. DOI: 10.1515/hf-2013-0013
Jackson, J. B., Mourou, M., Labaune, J., Whitaker, J. F., Duling, III, I. N., Williamson, S. L., Lavier, C., Menu, M., and Mourou, G. A. (2009). “Terahertz pulse imaging for tree-ring analysis: A preliminary study for dendrochronology applications,” Measurement Science and Technology 20(7), 190-190. DOI: 10.1088/0957-0233/20/7/075502
Jördens, C., Wietzke, S., Scheller, M., and Koch, M. (2010). “Investigation of the water absorption in polyamide and wood plastic composite by terahertz time-domain spectroscopy,” Polymer Testing 29(2), 209-215. DOI: 10.1016/j.polymertesting.2009.11.003
Li, B., Long, Y., and Liu, H. S. (2017). “The determination of glucose based on terahertz spectroscopy,” Spectroscopy and Spectral Analysis 2017(7), 2165-2170. DOI: 10.3964/j.issn.1000-0593 (2017)07-2165-06
Li, W., Hu, B., and Wang, M. (2014). “Discrimination of varieties of borneol using terahertz spectra based on principal component analysis,” Spectroscopy and Spectral Analysis 34(12), 3235-3240 DOI:10.3964/j.issn.1000-0593 (2014) 12-3235-06
Liu, W., Sun, Z., Chen, J., and Jing, C. (2016). “Raman spectroscopy in colorectal cancer diagnostics: Comparison of PCA-LDA and PLS-DA models,” Journal of Spectroscopy 2016, Article ID 1603609. DOI: 10.1155/2016/1603609
Pan, L., and Lv, D. (2018). “Terahertz band simulations using two different radiative transfer models,” Science China Earth Sciences 61(10), 1482-1490 DOI: 10.1007/s11430-017-9242-3
Puc, U., Abina, A., Rutar, M., Zidanšek, A., Jeglič, A., and Valušis, G. (2015). “Terahertz spectroscopic identification of explosive and drug simulants concealed by various hiding techniques,” Applied Optics 54(14), 4495-4502. DOI: 10.1364/AO.54.004495
Reid, M., and Fedosejevs, R. (2006). “Terahertz birefringence and attenuation properties of wood and paper,” Applied Optics 45(12), 2766-2772. DOI: 10.1364/AO.45.002766
Rizk, Y., Mitri, N., and Awad, M. (2013). “A local mixture based SVM for an efficient supervised binary classification” in: The 2013 International Joint Conference on Neural Networks (IJCNN), Dallas, TX, USA, pp. 1-8. DOI: 10.1109/IJCNN.2013.6707032
Sterczewski, L. A., Nowak, K., Szlachetko, B., Grzelczak, P. M., Szczesniak-Siega, B., Plinska, S., Malinka, W., and Plinski, E. F. (2017). “Chemometric evaluation of THz spectral similarity for the selection of early drug candidates,” Scientific Reports 7(1), Article ID 14583. DOI: 10.1038/s41598-017-14819-6
Tanaka, S., Shiraga, K., Ogawa, Y., Fujii, Y., and Okumura, S. (2014). “Applicability of effective medium theory to wood density measurements using terahertz time-domain spectroscopy,” Journal of Wood Science 60(2), 111-116. DOI: 10.1007/s10086-013-1386-7
Wu, J., and Yang, H. (2015). “Linear regression-based efficient SVM learning for large-scale classification,” IEEE Transactions on Neural Networks and Learning Systems 26(10), 2357-2369. DOI: 10.1109/TNNLS.2014.2382123
Xu, H., Caramanis, C., and Sanghavi, S. (2010). “Robust PCA via outlier pursuit,” IEEE Transactions on Information Theory 58(5), 3047-3064. DOI: 10.1109/TIT.2011.2173156
Yang, Y., Harsha, S. S., and Shutler, A. J. (2012). “Identification of Genistein and Biochanin A by THz (far-infrared) vibrational spectra,” Journal of Pharmaceutical and Biomedical Analysis 62, 177-181.
Yang, Z., Liu, Y., Pang, X., and Li, K. (2015). “Preliminary investigation into the identification of wood species from different locations by near infrared spectroscopy,” BioResources 10(4), 8505-8517. DOI: 10.15376/biores.10.4.8505-8517
Yi, X., Park, D., Chen, Y., and Caramanis, C. (2016). “Fast algorithms for robust PCA via gradient descent,” in: Neural Information Processing Systems Conference, Barcelona, Spain, pp. 4152-4160.
Zhang, C., Jiang, X., Mu, K., Zhang, X-C., Zhang, L., Zhou, Q., Zhang, Y., Shen, Y., Zhao, G., and Jiao, Y. (2007a). “Identification of explosives and drugs and inspection of material defects with THz radiation – art. no. 68400S,” Proceedings of SPIE Terahertz Photonics 6840, 68400S-1-68400S-10. DOI: 10.1117/12.760133
Zhang, Q., Wang, S., and Guo, Q. (2007b). “A novel SVM and its application to breast cancer diagnosis,” in: The International Conference on Bioinformatics and Biomedical Engineering, Wuhan, China, pp. 633-636.
Article submitted: September 29, 2018; Peer review completed: November 18, 2018; Revisions accepted: December 10, 2018; Published: December 12, 2018.
DOI: 10.15376/biores.14.1.1033-1048