
Abstract
Wheat straw produced annually in the Shaanxi Guanzhong region is a potential biomass feedstock for the production of transportation fuels and specialized chemicals through combustion, pyrolysis, or gasification. In this work, the pyrolytic characteristics, evolved gas products, and kinetics of Guanzhong wheat straw and its components were first investigated with a thermogravimetry-Fourier infrared spectroscopy (TG-FTIR) system. A comparative kinetic study was conducted using different model-free methods of Flynn-Wall-Ozawa (FWO), Kissinger-Akahira-Sunose (KAS), Kissinger, and the Coats-Redfern methods. The main pyrolysis products identified by FTIR include H2O, CH4, CO2, and CO as well as aromatics, acids, ketones, and aldehydes. Kinetic results showed that the pyrolytic apparent activation energy of the straw is approximately 200 kJ/mol obtained via FWO and KAS methods at the conversion range of 0.4 to 0.75, which was 30 kJ/mol higher than the value 171.1 kJ/mol obtained by the Kissinger method. The apparent activation energy of cellulose in its main pyrolysis region is 135.5 kJ/mol and is about three times larger than that of hemicellulose (49.5 kJ/mol). The apparent activation energy of lignin at the temperature range of 45 to 116 °C was 34.5 kJ/mol, while that value at the temperature range of 120 to 252 °C was 6.64 kJ/mol.
Download PDF
Full Article
Pyrolytic Characteristics and Kinetics of Guanzhong Wheat Straw and its Components for High-value Products
Bingtao Hu,a Zhaolin Gu,a Junwei Su,a and Zhijian Li b,c,*
Wheat straw produced annually in the Shaanxi Guanzhong region is a potential biomass feedstock for the production of transportation fuels and specialized chemicals through combustion, pyrolysis, or gasification. In this work, the pyrolytic characteristics, evolved gas products, and kinetics of Guanzhong wheat straw and its components were first investigated with a thermogravimetry-Fourier infrared spectroscopy (TG-FTIR) system. A comparative kinetic study was conducted using different model-free methods of Flynn-Wall-Ozawa (FWO), Kissinger-Akahira-Sunose (KAS), Kissinger, and the Coats-Redfern methods. The main pyrolysis products identified by FTIR include H2O, CH4, CO2, and CO as well as aromatics, acids, ketones, and aldehydes. Kinetic results showed that the pyrolytic apparent activation energy of the straw is approximately 200 kJ/mol obtained via FWO and KAS methods at the conversion range of 0.4 to 0.75, which was 30 kJ/mol higher than the value 171.1 kJ/mol obtained by the Kissinger method. The apparent activation energy of cellulose in its main pyrolysis region is 135.5 kJ/mol and is about three times larger than that of hemicellulose (49.5 kJ/mol). The apparent activation energy of lignin at the temperature range of 45 to 116 °C was 34.5 kJ/mol, while that value at the temperature range of 120 to 252 °C was 6.64 kJ/mol.
Keywords: Guanzhong wheat straw; Pyrolysis; TG-FTIR; Kinetics; Apparent activation energy
Contact information: a: School of Human Settlements and Civil Engineering, Xi’an Jiaotong University, University, Xi’an 710049, China; b: College of Light Industry and Energy , Shanxi University of Science & Technology, 710021, Xi’an, Shaanxi, China; c: Key Laboratory of Paper Technology and Specialty Paper Development of Shaanxi Province, Xi’an 710021, China; *Corresponding author: lizj@sust.edu.cn
INTRODUCTION
The reserve of traditional fossil energy fuels, such as petroleum, natural gas, and coal is limited and its energy utilization efficiency is low at present. Moreover, the products, such as CO2, SO2, and NOx, produced in the process of its depletion are the main reasons for global warming and air pollution (Türe et al. 1997; Faisal Mushtaq et al. 2014). Biomass energy is one of the most potential and promising alternative energies due to its environment-friendly, carbon-neutral, and abundant features compared with fossil fuels. Petroleum, coal, and natural gas account for 33%, 24%, and 19% of global energy consumption, respectively, while the proportion of biomass energy is 13%, which is about one eighth of the total global energy consumption (Stocker 2008). However, improper exploitation and utilization technologies lead to low efficiency of the biomass feedstock, thus a highly efficient biomass energy transformation technology is urgently needed.
Biomass feedstock can be converted into bioenergy by means of thermochemical and biochemical approaches. Thermochemical transformation technology is widely used due to its favorable feedstock compatibility, short production cycle, and highly flexibility of feedstock utilization (Bridgwater 2003; Balagurumurthy and Bhaskar 2014). Pyrolysis technology is regarded as one of the most crucial thermochemical transformation technologies and is the basis of solid biomass gasification and combustion technology. Through the pyrolysis technology, biomass feedstock can be converted into activated carbon, transportation fuels, and specialized chemicals. Therefore, pyrolysis technology is an effective way of biomass utilization.
An enormous amount of wheat straw with high cellulose produced annually in the Guanzhong region of China’s Shanxi Province is a typical and potential source of biomass feedstock. There are three methods local farmers use in disposing of these agricultural residuals: 1) Straw returning to the field for the purpose of improving soil organic levels; 2) Serving as a type of livestock feed product; 3) Incineration for cooking and heating systems. These methods not only aggravate environmental pollution but also result in a huge waste of biomass feedstock that is not utilized fully and efficiently.
Enormous efforts have been made to understand the kinetics of biomass pyrolysis, the detailed pyrolysis mechanisms of biomass, and the specific volatile species during biomass pyrolysis (Zhang et al. 2020; Salman et al. 2020; Eschenbacher et al. 2020; Zhao et al. 2020); however, the fundamental mechanism of biomass pyrolysis and differences between various kinetic methods have not been illustrated clearly. Furthermore, there is a need for investigations on the pyrolysis of Guanzhong wheat straw, suggesting that abundant wheat straw have not been fully utilized. The main objective of this study is to present a complete and detailed characterization of the pyrolytic behavior of Guanzhong wheat straw and its components as well as the validity of the apparent energy obtained by different isoconversional methods of Flynn-Wall-Ozawa (FWO), Kissinger-Akahira-Sunose (KAS), Kissinger, and Coats-Redfern methods. The kinetic results will lay a solid foundation for further investigation of the pyrolytic mechanism and full utilization of the Guanzhong wheat straw, which is significant for developing thermal reactor technology, enhancing the utilization efficiency of biomass energy, and boosting the regional economy.
EXPERIMENTAL
Materials
The wheat straw samples used in this study were collected from the northwestern Guanzhong Region of Shanxi Province, China. The air-dried samples were pulverized and sieved into a particle size of 80- to 100-mesh (150 to 180 μm) to avoid heat and intraparticle mass-transfer effects. Remarkable differences exist in physical and chemical properties of various lignocellulosic materials, and an elaborate characterization is required for better understanding the influence of feedstock characteristics on pyrolytic behavior. The proximate and ultimate analyses were conducted in this study, and the ultimate analysis was performed using an elemental analyzer (Vario EL III, Elementar Analysensysteme GmbH, Hanau, Germany). The calorific value of the sample characterized by lower heating value (LHV) was obtained using the Dulongs equation (Perry and Chilton 1973). The extraction and separation scheme of cellulose, hemicellulose, and lignin from Guanzhong wheat straw is illustrated in Fig. 1 as well as the detailed procedures of the extraction process (Sun and Tomkinson 2002; Sun et al. 2004). Lignin can be removed from the feedstock via chlorine dioxide, peracetic acid, or alkaline peroxide pretreatment. The hemicellulose sample was obtained via alkaline extraction of the holocellulose fraction that was removed from the lignin. The cellulose fraction was separated from the wheat straw using 72% nitric acid and 95% ethanol. As is shown in Fig. 1, Soxhlet extraction using toluene/ethanol mixture was the first step in order to remove gums, waxes, terpenoids, etc. from the wheat straw; thus, the organic-soluble extractive-free residue was obtained. After the hot-water washing, the water-soluble extractives and hard-to-remove sugars (soluble) were removed from the residue, and water-soluble extractives-free residue were obtained. Then 72% sulfuric acid solvent was used to hydrolyze the residue to obtain the Klason lignin. The 72% sulfuric acid solution partly hydrolyzed the polysaccharides into dextrin and the weak acid (3% sulfuric acid) to fully hydrolyze the polysaccharide into monosaccharide and dissolve into the solvent, which can remove most of the hemicellulose. As to the extraction of the hemicellulose, after dissolving the hemicellulose content of the carbohydrate residue using 10% KOH solvent, the hemicellulose can be recovered by precipitation of the neutralized hydrolysate in 3 volumes of 95% ethanol. After filtration, the solids were washed by 70% ethanol and freeze-dried. The resulting pellets of the hemicellulose were washed using 70% ethanol and freeze-dried, whereby the hemicellulose sample was obtained (Peng and Wu 2010). The detailed extraction process flow chart is shown in Fig. 1. The Fourier transform infrared (FTIR) spectra of the raw biomass was also measured by preparing a transparent KBr disk containing 1 wt% of finely pulverized sample on a FTIR (VERTEX 70, Bruker, Leipzig, Germany) spectrophotometer to identify the functional groups of the sample.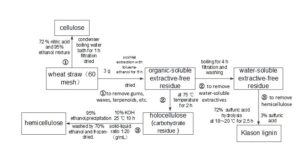
Fig. 1. Flow chart for extraction process of cellulose, hemicellulose, and lignin from wheat straw. Step 1: removal of gums, waxes, terpenoids, etc via Soxhlet extraction; Step 2: removal of water-soluble extractives via hot water washing; and Step 3: removal of hemicellulose.
Thermogravimetric (TG)-FTIR Experiments
To investigate the thermal decomposition behavior and typical decomposition products of the raw material at the same time, TG-FTIR experiments were performed. The TG-FTIR system consisted of a thermogravimetric analyzer (TGA, STA 449/F3; Netzsch Company, Waldkraiburg, Germany) coupled with a FTIR spectrophotometer (VERTEX 70, Bruker, Leipzig, Germany). For each experimental run, approximately 4 mg of the sample was placed evenly and loosely in an open Al2O3 sample crucible to avoid the possible temperature gradient in the sample and ensure the kinetic control of the pyrolysis process (Di Blasi et al. 2001). The wheat straw sample was pyrolyzed from ambient temperature to 1000 °C at a heating rate of 5, 10, and 20 K/min using 80 mL min-1 of high-purity helium (99.999% minimum purity) as the carrier gas. The components of the wheat straw were pyrolyzed at a single heating rate of 20 K/min under the same conditions. The volatiles released generated from the sample pyrolysis in the TGA were directly transferred to an FTIR spectrometer connected to the TGA via a transfer line that was heated and stabilized at 210 °C to prevent less evolved gases from condensation. The FTIR spectra were recorded at a wavelength range of 4000 to 650 cm-1 with the resolution factor of 4 cm-1 every 16 s. The experiments were repeated twice to ensure the reproducibility of results.
Methods
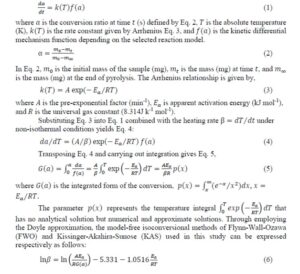
The kinetics of biomass decomposition are considered to be based on a typical kind of heterogeneous solid-state single reaction (Capart et al. 2004; Várhegyi 2007). According to the Arrhenius law, the non-isothermal solid decomposition rate can generally be described by Eq. 1,
RESULTS AND DISCUSSION
Characterization and Chemical Structure of Feedstock and its Components
A detailed characterization of a given solid biomass feedstock is crucial to the investigation and utilization of such feedstock and the biomass composition characterizes and determines the properties, quality, potential applications, and environmental problems related to the feedstock (Vassilev et al. 2010). Table 1 shows the main characteristics of the sample, from which one can know that the sample is characterized by a high content of C and O while by a low content of H, N, and S. In addition, the sample is also characterized by a high amount of volatile matter (74.6%) and a low amount of ash (3.65%), which is favorable to the biomass fuel performance. Biomass with a high content of volatile matter and fixed carbon while a low content of ash is preferred to be an ideal biomass fuel (Sanchez-Silva et al. 2012). It is also noticed that the calorific value of the sample is not very high (3031 kcal kg-1), which is probably due to the low content of H and high content of moisture in the sample. Lignocellulosic biomass, as a kind of natural polymer, are mainly composed of cellulose (35% to 45%, dry weight), hemicellulose (25% to 30%, dry weight), and lignin (20% to 35%, dry weight) (de Wild et al. 2012). Table 2 shows the content of cellulose, hemicellulose, and lignin (mainly Klason lignin) of Guanzhong wheat straw are 45.0%, 29.0%, and 22.3% by dry weight, respectively.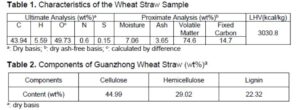
Figure 2 shows the FTIR spectrum of the raw material. As can be seen from Fig. 1, a sharp characteristic absorption peak appeared at 3334 cm-1, which represents the stretching vibration of O-H, while the absorption peaks at 2920 and 2854 cm-1 represent the asymmetrical and symmetrical stretching vibration of C-H bond, respectively, which could be assigned to the characteristic peaks of aliphatics contained in the waxes of the wheat straw. The absorption peaks at 1733 and 1253 cm-1 are due to the substantial acetyl groups attached to the hemicellulose of the sample (Sun et al. 2005). The absorption peak at 1050 cm-1 is assigned to be the characteristic absorption peak of lignin of the sample (Pandey 1999). The absorption at 1162 cm-1 is due to the antisymmetric stretching vibration of the glucosidic bond C-O-C, which existed in the cellulose and hemicellulose of the sample (Gierlinger et al. 2008). It can be concluded that the sample most likely consisted of acids, alkanes, alphatics, and aromatics.
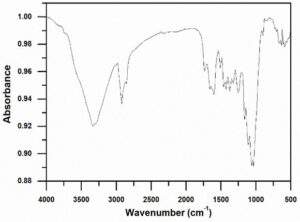
Fig. 2. FTIR spectrum of the Guanzhong wheat straw sample
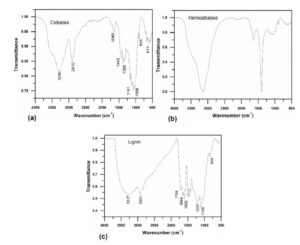
Fig. 3. FTIR spectrum of cellulose (a), hemicellulose (b), and lignin (c) samples extracted from Guanzhong wheat straw
Cellulose is the main composition of the cell wall of higher plants, such as cotton, wood, and flax. It is a linear polysaccharide macromolecular compound made by anhydro-D-glucose units linked through b-(1→4) bonds (Pasangulapati et al. 2012). Figure 3 shows the FTIR spectrum of the cellulose, hemicellulose, and lignin of Guanzhong wheat straw. As can be seen from Fig. 3a, the absorption peaks at 1602, 1504, and 1423 cm-1 that are relevant to lignin had disappeared following nitric acid and ethanol pretreatment of the wheat straw (Sun et al. 2004). The absorption peaks at 3290 cm-1 and 2910 cm-1 represent the stretching vibration of O-H and C-H. The absorption peak at 1649 cm-1 represents the deformation vibration of bound water (Pandey 1999) and the peaks at 1369 cm-1 and 1369 cm-1 are the bending vibrations of -CH2 and –OH, respectively. The skeletal vibration of C—C and C—O appears at the absorption peak of 1320 cm-1 and the asymmetric stretching vibration of C—O appears at the absorption peak of 1163 cm-1. A strong absorption peak at 1066 cm-1 is due to the skeletal vibration of C—O—C of the pyranose ring. The absorption peak at 905 cm-1 represents the vibration of C1—H group and the ring and is a characteristic peak of b-glucosidic bond of glucose. Absorption peaks at 1737 (C=O) and 1372 cm-1 (—C—CH3) are characteristic peaks of acetyl ester, which indicate that the catalysis of nitric acid ethanol has caused the acetylation of cellulose. Absorption peaks at 1443, 1369, 1320, 1163, 1066, and 905 cm-1 are specific absorption peaks of cellulose. As can be seen from Fig. 3b, absorption peaks at 3128 cm-1 and 1638 cm-1 are the stretching vibration of —OH and the deformation vibration of bound water respectively. The absorption peak at 1404 cm-1 is the stretching or bending vibration of C-H and C-O. The specific absorption peak of xylan at 1051 cm-1 is the stretching vibration of C-O and C-C, and the characteristic peak of b-glucosidic bond appears at 905 cm-1. Figure 3c shows the FTIR spectrum of lignin. The absorption peak at 3317 cm-1 is due to the hydroxyl of phenols and aliphatics (Sun et al. 2005). The absorption peak at 2931 cm-1 represents the C-H stretching vibration of aromatic methyl and methylene. The absorption peak at 2850 cm-1 is caused by the alkyl group and the shoulder peaks at 1709 cm-1 and 1664 cm-1 are due to the conjugate stretching vibration of carbonyl. The absorption peaks located at 1602 cm-1, 1504 cm-1, and 1426 cm-1 represent the stretching vibration of aromatic ring skeleton, and the asymmetric bending vibration of C-H appears at the absorption of 1456 cm-1. The absorption peak at 1105 cm-1 represents the in-plane bending vibration of C-H in the syringyl group, and the absorption peak at 836 cm-1 is the out-of-plane bending vibration of the aromatic ring. In addition, it can be concluded that the lignin of Guanzhong wheat straw belongs to the G type according to the standard of the largest peak between 1065 to 1175 cm-1 (Faix 1991; Wang et al. 2009). It can be seen that the components of Guanzhong wheat straw are composed of olefins, esters, aromatics, ketones, alcohols and other compounds, and some oxygen-containing functional groups.
Thermal Decomposition Characteristics
The TG and DTG profiles of the wheat sample obtained at different heating rates of 5, 10, and 20 K/min are shown in Fig. 4, from which one can clearly observe that the main pyrolytic zone of the sample was in the temperature range of 200 to 400 °C and the residual amount at the end of the pyrolysis was about 27.3 to 33.4% of the sample. The process of biomass pyrolysis is generally considered as a superposition of the independent pyrolysis of its main individual components. According to the composition of biomass and the slope change of the DTG profile, the pyrolysis process of the sample can be divided into four stages. The first stage that ranged from room temperature to around 150 °C is characterized by a weight loss of approximately 4%, which is attributed to the dehydration of the sample. At the second stage (150 to 300 °C), there appeared an inconspicuous shoulder peak that probably was due to the pyrolysis of hemicellulose.
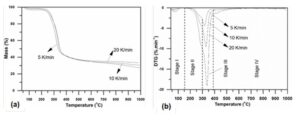
Fig. 4. TG (a) and DTG (b) curves of the sample at different heating rates
Hemicellulose is a low-molecular amorphous compound with a lower degree of polymerization that leads to its low thermal stability (Ma et al. 2015). The third stage (300 to 380 °C) with a maximum weight loss of approximately 60% is due to the pyrolysis of the cellulose of the sample. The final stage that proceeded over a wide temperature range (380 to 1000 °C) was a carbonization and slow pyrolysis of lignin because lignin is a highly cross-linked and highly branched amorphous polymer with a large molecular weight consisted of functional groups including aromatic sub-structures of carbon (Lee et al. 2013). With the increase of heating rate, TG and DTG profiles shifted to a higher temperature zone and the maximum decomposition rate increased at the same time. Therefore, a higher heating rate can decrease the time needed to reach the pyrolysis temperature while delaying the pyrolysis process of the sample. Thus, a lower heating rate is more conducive to biomass pyrolysis, which can mitigate the thermal lag effect.
The TG and DTG curves of components of Guanzhong wheat straw are illustrated in Fig. 5. It can be clearly observed that the pyrolysis characteristics of the components were noticeably different. The pyrolysis behavior of cellulose and hemicellulose were similar, and both degraded in a narrow temperature range. The initial pyrolysis temperature of hemicellulose was the lowest, and its pyrolysis temperature was at the range of 180 to 390 °C. The weight loss was approximately 76% at the range and the maximum pyrolysis loss peak appeared at the temperature of 353 °C, and the maximum weight loss rate was approximately 30.5%. The initial pyrolysis temperature of cellulose was higher than that of hemicellulose, and its weight loss was approximately 78% at the temperature range of 256 to 412 °C. The maximum weight loss peak appeared at the temperature of 369 °C and the maximum weight loss rate was approximately 57.4% at the range, which indicates that hemicellulose was less stable than cellulose. The degradation of lignin takes place at a wide temperature range, which indicates that lignin is difficult to degrade and has a better thermal stability. There were three distinct weight loss peaks on the DTG curves of lignin. The peak at approximately 100 °C was due to the volatilization of the free water in lignin, and the peak at approximately 201 °C was probably the result of the carbohydrates of hemicellulose that remained in the lignin. The weak peak at approximately 418 °C was attributed to the further depolymerization of lignin and secondary reactions induced by lignin. The difference in chemical structure of each component is the main reason of each component’s distinct pyrolysis behavior.
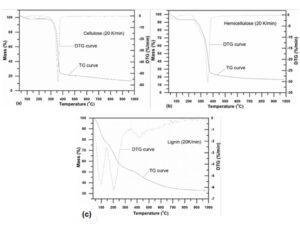
Fig. 5. TG and DTG curves of cellulose (a), hemicellulose (b), and lignin (c) samples extracted from Guanzhong wheat straw at heating rate of 20 K/min
Hemicellulose is composed of a variety of monosaccharides including xylan, mannose, glucose, and galactose. It has an amorphous and multi-branched structure and is prone to degradation at lower temperatures, while cellulose is a kind of linear polymer composed of glucose units and is more difficult to degrade. The lignin contains various branched aromatic rings, which makes the degradation of lignin take place at wider temperature range (Qu et al. 2011). In addition, the solid residuals of cellulose, hemicellulose, and lignin were 13.4%, 16.5%, and 32.5%, respectively, indicating that lignin can noticeably enhance the yields of pyrolysis charcoal.
Analysis of the Pyrolytic Products
The FTIR spectrum (absorbance-temperature-wavenumber) of the volatiles from sample pyrolysis at heating of 20 K/min is shown in Fig. 6. It is noted that maximum yields of gas products are evolved at the maximum loss temperature (342 °C). According to the Lambert-Beer law, the absorbance intensity at a specific wavenumber is linearly dependent on relative concentration of gas species (Liu et al. 2008). Therefore, the variation of absorbance intensity in the pyrolysis process can reflect the tendency of relative concentration of the gas species. As shown in Fig. 6(b), the typical gas species of wheat straw pyrolysis were H2O, CO2, and CO. It is inferred from the C=O that appeared in the region of 1580 to 1600 cm-1 that acids, ketones, and aldehydes existed in the pyrolysis products. The functional groups of C=C and benzene skeleton in the region of 1460 to 1590 cm-1 indicates the presence of aromatics in the pyrolysis products while C-O, C-C, and carbon chain skeleton in the region of 1000 to 1475 cm-1 suggests the existence of alcohols, alkanes, phenols, and ethers. Among the main products, the formation of CH4 probably resulted from the decomposition of -OCH3, -CH3, and -CH2– during the pyrolysis (Liu et al. 2008), while CO2 was probably derived from the breakage of carbonyl and decarboxylation in the pyrolysis (Fu et al. 2012). The breakage of C=O and ether linkage leads to the formation of CO (Granada et al. 2012).
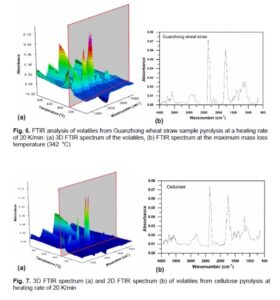
The 2D FTIR spectra of volatiles from cellulose pyrolysis at a heating rate of 20 K/min are illustrated in Fig. 7. The stretching vibration of O-H takes place in the region of 4000 to 3500 cm-1 and it is attributed to the production of water. The wavenumber at 2356 cm-1 is the absorption peak of CO2. The wavenumber between 1800 to 1540 cm-1 corresponds to the stretching vibration of C=O and the wavenumber between 1483 to 1427 cm-1 corresponds to the C—H symmetrical deformation in the methoxy functional group. The absorption peak at 1180 cm-1 is the stretching vibration of C—O—C and the wavenumber between 1600 to 800 cm-1 is the skeletal vibration of C—O and C—C. It can be inferred that the products of cellulose pyrolysis include H2O, CO, CO2, and hydrocarbons that contain C—H bonds and acids, aldehydes, and ketones that contain a C=O bond.
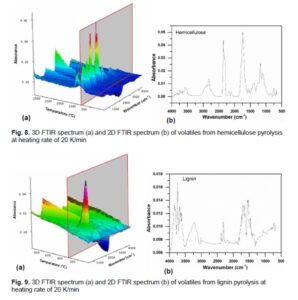
The FTIR spectrum of volatiles of hemicellulose in the main pyrolysis reaction stage is illustrated in Fig. 8, from which it can be observed that the main products of hemicellulose pyrolysis include CO2, CH4, H2O, CO, and some acids, aldehydes (C =O), alkanes (C—C), esters (C—O—C), and other organic substances. The relative content of aldehydes, ketones, acids, and other compounds containing C=O bond produced in the pyrolysis of hemicellulose is higher than the relative content of CO2 compared with cellulose.
Figure 9 shows the FTIR spectrum of volatiles of lignin in the main pyrolysis reaction stage, from which it can be seen that absorption peaks at 3972 to 3520 cm-1 and 1810 to 1316 cm-1 are characteristic absorption peaks of H2O, and water can be produced via the cleavage of the upper aliphatic hydroxyl group of the side chain of phenylpropane. Absorption peaks at 2400 to 2217 cm-1 and 750 to 600 cm-1 indicate the production of CO2, which could be produced by the cleavage of the C—C bond (Brebu et al. 2013). The absorption peak at 1743 cm-1 indicates the formation of formaldehyde, mainly produced from the cleavage of the methylol functional group existing on the side chain of phenylpropane (Shen et al. 2010). The O-H vibration that takes place in the range 1407 to 1294 cm-1 indicates the formation of phenols that were produced by the breakage of the ether bond in the main chain. The strong absorption peaks at 3230 to 2940 cm-1 indicate the presence of methane and other hydrocarbons, while the absorption peaks at 1090 to 970 cm-1 indicate the formation of methanol, which may stem from the cleavage of the methoxy group on the benzene ring.
Analysis of the Apparent Activation Energy
Model-free methods that use multiple heating rates are built on an isoconversional basis wherein the conversion ratio of a reaction is assumed to be constant. Model-free methods allow for the determination of the kinetic parameters of pyrolysis reaction without hypothesizing the form of kinetic mechanism function and rate order. Furthermore, the systematic errors resulted from the approximation of the Arrhenius parameters in kinetic analysis can be eliminated (Brown et al. 2000).
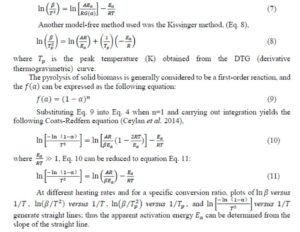
Figure 10 shows the fitted lines of three model-free methods of FAW, KAS, and Kissinger employed in this study to evaluate the apparent activation energy of Guanzhong wheat straw. At the conversion ratio range of 0.1 to 0.9 (the interval is 0.05), the apparent activation energy was determined by employing the FWO and KAS methods. As shown in Fig. 10, the coefficients of determination (R2) of fitted straights lines obtained when the conversion rate was below 0.1 were below 0.90, indicating the activation energy determined was not representative and reliable. The reason for this is the uncertainty and randomness of determination of pyrolysis endpoint (Anca-Couce et al. 2014). In this study, the pyrolysis endpoint was selected based on the identical weight loss rate at different heating rates. It was noted that the R2 values of fitted straights lines were high (0.945 to 0.995) at the conversion rate of 0.1 to 0.8 and the fitted lines were nearly parallel, which indicating that there only exists one pyrolytic kinetic mechanism during the pyrolysis process of Guanzhong wheat straw. Thus, the pyrolysis of Guanzhong wheat straw is a one-stage reaction. The activation energy obtained was almost fixed, and the results were reliable.
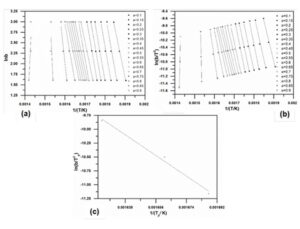
Fig. 10. Plot of FWO (a), KAS (b), and Kissinger method (c) to determine the apparent activation energy of Guanzhong wheat straw
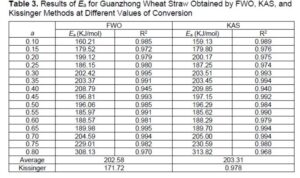
Table 3 shows the distribution of activation energy calculated by the FWO, KAS and Kissinger methods. As shown in Table 3, the activation energy changed with increasing conversion rate globally and slight fluctuations of the value were observed at local region, which suggests that biomass pyrolysis is a complicated process containing a series of parallel, competitive, and consecutive reactions. In addition, similar tendency of activation energy are found between FWO and KAS methods, and the average of both calculated activation energy were around 202.6 kJ/mol and 203.3 kJ/mol respectively. The deviation could be explained by the different approximation algorithms utilized in each method (Ounas et al. 2011).
The results of FWO and KAS methods demonstrated the reliability of the estimated activation energy and indicated the pyrolysis of Guanzhong wheat straw obeyed the single reaction mechanism at the conversion rate of 0.1 to 0.8. According to the thermal stability difference of each component of Guanzhong wheat straw obtained aforementioned, the change of the activation energy with extent of conversion can be divided into three stages: 0.1 to 0.2, 0.2 to 0.65, and 0.65 to 0.8. At the conversion extents of 0.1 to 0.2, the activation energy determined by FWO method changed from 160.21 to 199.12 kJ/mol and the activation energy determined by KAS method changed from 159.13 to 200.17 kJ/mol. This corresponds to the pyrolysis of hemicellulose, because the less energy is needed to degrade hemicellulose due to its amorphous chain structure. Within the extent of conversion range of 0.2 to 0.65, there was a fluctuation of activation energy determined by FWO and KAS methods, and the value presented a first-fall-rise and then-rise-fall trend. The activation energy determined by FWO and KAS methods changed within the range of 185.62 to 209.85 kJ/mol, which corresponds to the pyrolysis of cellulose of Guanzhong wheat straw. More energy is needed to degrade cellulose due to its semi-crystalline lattice structure. At the conversion extents of 0.65 to 0.8, the activation energy increased rapidly. This was mainly due to the pyrolysis of lignin, due to the high crosslinking properties of the three phenylpropane units present in lignin and the low-reactivity char generated during pyrolysis, which entailed more activation energy to decompose (Ma et al. 2015). However, the activation energy derived from the Kissinger method was 171.7 kJ/mol, which was about 30 kJ/mol lower than the value obtained by the other two methods. This can be explained by the overestimation tendencies of isoconversional methods (Anca-Couce et al. 2014). The results are in agreement with published literature (Cai and Bi 2009; Wilson et al. 2011). In addition, the selected mechanism function of pyrolysis, the biomass species, the particle dimensions, the types of TG curves, the composition of the materials, and operating conditions, including the heating rates, feedstock loading, and the flow rate of carrier gas could affect the kinetic parameters (Cai et al. 2013).
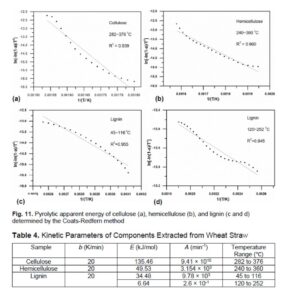
In order to adequately illustrate the evolution of Ea of the Guanzhong wheat straw and its components, the effect of pyrolysis temperature was investigated relative to the evolution of different gaseous functional groups or compounds with temperature in the pyrolysis process at heating rate of 20 K/min. According to the Lambert-Beer law, the relative amount of different volatiles in the pyrolysis process are higher within the temperature range of 250 to 400 ℃, and the main highest relative content of the four volatiles from high to low are : CO2 at the wavenumber of 2357 cm-1 > aldehydes, ketones, and acids represented by C=O bond > esters and alkanes > H2O. The relative content of each volatiles in the pyrolysis of Guanzhong wheat straw decreased with the increase of temperature when the pyrolysis temperature was above 400 ℃, while the relative content of H2O and CO2 decreased slowly with the increase of the temperature. The activation energy of hemicellulose decomposition is 49.5 kJ/mol within the temperature range of 240 to 360 ℃. The activation energy of cellulose is 135.5 kJ/mol within the temperature range of 282 to 376 ℃, which is higher that of hemicellulose, indicating that the thermal stability of cellulose is greater than that of hemicellulose. At the initial stage of the pyrolysis, the activation energy of lignin decomposition is about 34.5 kJ/mol when the temperature is below 252 ℃, which is much lower that of cellulose and hemicellulose. This indicates that lignin is hard to degrade at low temperature and its degradation takes place at higher temperature.
The kinetic parameters of pyrolysis reaction of cellulose, hemicellulose, and lignin were determined using the aforementioned Coats-Redfern method to better understand the pyrolysis behavior and mechanism of Guanzhong wheat straw. In addition, the kinetic results can be used in simulating the devolatilization process and boost the utilization efficiency of the feedstock. Figure 11 illustrates the pyrolytic apparent energy of cellulose, hemicellulose, and lignin determined by the Coats-Redfern method, from which it can be observed that the kinetic fitting curve of each component had a high linear coefficient of determination. The results indicate that the estimated kinetic parameters of each component were reasonable within their pyrolysis temperature range. Table 4 shows the kinetic parameters of components extracted from wheat straw. The apparent activation energy of cellulose in its main pyrolysis region was 135.5 kJ/mol, which is about three times larger than that of hemicellulose (49.5 kJ/mol). This further demonstrates that cellulose has a higher thermal stability. Compared with the apparent activation energy of cellulose and hemicellulose, the apparent activation energy of lignin at the temperature range of 45 to 116 °C was 34.5 kJ/mol, while that value at the temperature range of 120 to 252 °C was 6.64 kJ/mol, which shows that lignin exhibited the highest thermal stability and hardly degraded in the low temperature range. The degraded part came from hemicellulose and other substances that remained in the process of lignin extraction. In addition, the pyrolytic activation energy of cellulose was found to be comparable to that of wheat straw (86.5 kJ/mol). The apparent energy of wheat straw determined using the Coats-Redfern method was 86.5 kJ/mol when assuming the pyrolysis reaction order is one, which is different from that of value by employing the FWO, KAS, and Kissinger methods. The main reason for this difference could be: (1) the pyrolysis of biomass is a complex and heterogeneous reaction process; and (2) there are deviations between different pyrolysis reaction kinetic methods. The FWO, KAS, and Kissinger methods are based on the multiple heating rates, while the Coats-Redfern method is based on a single heating rate assuming the reaction order is one. The multiple heating rate method can obtain a more reliable apparent activation energy value; (3) the pyrolysis reaction order characterizes the pyrolysis process. When the reaction order is assumed to be 1, there may be deviations from the actual reaction order. The apparent activation energy calculated by the Coats-Redfern method is aiming to describe the local area of the reaction, while the apparent activation energy of the FWO, KAS, and Kissinger methods is aiming to describe the whole process of pyrolysis reaction.
Investigation on the pyrolysis kinetics of Guanzhong wheat straw and its components was conducted to provide a technical basis for biomass gasification, optimization of biomass pyrolysis process parameters, upgradation of pyrolysis equipment, integration of the gasification process, and the production of high-quality biomass fuels, which is important for enhancing the utilization efficiency of biomass energy and boosting the regional economy. The prospect of fuels and chemicals produced from Guanzhong wheat straw is promising. Further investigation is needed to improve the utilization efficiency of Guanzhong wheat straw, and a detailed pyrolysis mechanism of Guanzhong wheat straw is still needed for further investigated.
While TG-FTIR technology is widely used in the investigations of biomass pyrolysis, it can only determine the low molecular weight gas volatiles and other substances with unique functional groups in the pyrolysis products. In order to determine and investigate the high molecular weight compounds of the pyrolysis products, the technologies of GC (Gas Chromatography), GC-MS (Gas Chromatography-Mass Spectrometry), and HPLC (High Performance Liquid Chromatography) are regularly used. The technology of Py-GC/MS(Pyrolysis-Gas Chromatography/Mass Spectrometry) is considered to be an effective way to investigate the pyrolytic behaviors, products, and mechanisms of biomass pyrolysis, which can be used to qualitatively and quantitatively investigate the evolved volatiles during biomass pyrolysis. The evolved volatiles during the pyrolysis of Guanzhong wheat straw will be qualitatively and quantitatively investigated in depth by performing the Py-GC/MS experiments and the in-depth pyrolytic mechanisms of Guanzhong wheat straw will be presented in our future work.
CONCLUSIONS
- Guanzhong wheat straw is characterized by high C, O, and volatile content, and low ash content. In addition, the content of cellulose, hemicellulose, and lignin (mainly Klason lignin) of Guqnzhong wheat straw are 45.0%, 29.0%, and 22.3% by dry weight, respectively. Thus, enormous amount of high-cellulose Guanzhong wheat straw is a potential source of biomass feedstock as fuel.
- The process of Guanzhong wheat straw pyrolysis at different heating rates can be divided into four stages: dehydration (room temperature to around 150 °C), pyrolysis of hemicellulose (150 to 300 °C), pyrolysis of cellulose (300 to 380 °C), and pyrolysis of lignin (380 to 1000 °C). The initial pyrolysis temperature of hemicellulose was the lowest, and its pyrolysis temperature was at the range of 180 to 390 °C. The initial pyrolysis temperature of cellulose was higher than that of hemicellulose, and its weight loss was approximately 78% at the temperature range of 256 to 412 °C. The degradation of lignin takes place at a wide temperature range, which indicates that lignin is difficult to degrade and has a better thermal stability. In addition, the solid residuals of cellulose, hemicellulose, and lignin were 13.4%, 16.5%, and 32.5%, respectively
- The main typical pyrolytic products of Guanzhong wheat straw identified by an FTIR spectrum were H2O, CO2, CO, and compounds such as aromatics, alcohols, alkanes, phenols, and ethers. The products of cellulose pyrolysis include H2O, CO, CO2, and hydrocarbons that contain C—H bonds and acids, aldehydes, and ketones that contain a C=O bond. The main products of hemicellulose pyrolysis include CO2, CH4, H2O, CO, and some acids, aldehydes (C =O), alkanes (C—C), esters (C—O—C), and other organic substances. The relative content of aldehydes, ketones, acids, and other compounds containing C=O bond produced in the pyrolysis of hemicellulose is higher than the relative content of CO2 compared with cellulose.
- The pyrolytic apparent activation energy of the Guanzhong wheat straw was found to be approximately 200 kJ/mol obtained via iso-conversional FWO and KAS methods within the conversion range of 0.1 to 0.8, which was 30 kJ/mol higher than the value 171.1 kJ/mol obtained by the Kissinger method. The apparent activation energy of cellulose in its main pyrolysis region is 135.5 kJ/mol and is about three times larger than that of hemicellulose (49.5 kJ/mol). The apparent activation energy of lignin at the temperature range of 45 to 116 °C was 34.5 kJ/mol, while that value at the temperature range of 120 to 252 °C was 6.64 kJ/mol.
ACKNOWLEDGMENTS
The authors are grateful for the support of the Key Laboratory of Paper Technology and Specialty Paper Development of Shaanxi Province and the Key Scientific Research Innovation Team Project of Shaanxi Province (No. 2018ZDCXL-SF-02-06).
REFERENCES CITED
Anca-Couce, A., Berger, A., and Zobel, N. (2014). “How to determine consistent biomass pyrolysis kinetics in a parallel reaction scheme,” Fuel 123, 230-240. DOI: 10.1016/j.fuel.2014.01.014
Balagurumurthy, B., and Bhaskar, T. (2014). “Hydropyrolysis of lignocellulosic biomass: State of the art review,” Biomass Convers. Biorefin. 4(1), 67-75. DOI: 10.1007/s13399-013-0086-2
Brebu, M., Tamminen, T., and Spiridon, L. (2013). “Thermal degradation of various lignins by TG-MS/FTIR and Py-GC-MS,” Journal of Analytical and Applied Pyrolysis 104, 531-539. DOI: 10.1016/j.jaap.2013.05.016
Bridgwater, A. V. (2003). “Renewable fuels and chemicals by thermal processing of biomass,” Chem. Eng. J. 91(2-3), 87-102. DOI: 10.1016/S1385-8947(02)00142-0
Brown, M. E., Maciejewski, M., Vyazovkin, S., Nomen, R., Sempere, J., Burnham, A., Opfermann, J., Strey, R., Anderson, H. L., Kemmler, A., et al. (2000). “Computational aspects of kinetic analysis: Part A: The ICTAC kinetics project-data, methods and results,” Thermochim. Acta 355(1-2), 125-143. DOI: 10.1016/S0040-6031(00)00443-3
Cai, J. M., and Bi, L. S. (2009). “Kinetic analysis of wheat straw pyrolysis using isoconversional methods,” J. Therm. Anal. Calorim. 122(412), 1588-2926.
Cai, C., Zhang Y. H., Chen W. T., Zhang P., and Dong Y. P. (2013). “Thermogravimetric and kinetic analysis of thermal decomposition characteristics of low-lipid microalgae,” Bioresource Technol.150, 139-148. DOI: 10.1016/j.biortech.2013.09.137
Capart, R., Khezami, L., and Burnham, A. K. (2004). “Assessment of various kinetics models for the pyrolysis of a microgranular cellulose,” Thermochim. Acta 417(1), 79-89. DOI: 10.1016/j.tca.2004.01.029
Ceylan, S., Topcu, Y., and Ceylan, Z. (2014). “Thermal behaviour and kinetics of alga Polysiphonia elongata biomass during pyrolysis,” Bioresource Technol. 171, 193-198. DOI: 10.1016/j.biortech.2014.08.064
de Wild, P. J., Huijgen, W. J. J., and Heeres, H. J. (2012). “Pyrolysis of wheat straw-derived organosolv lignin,” J. Anal. Appl. Pyrol. 93, 95-103. DOI: 10.1016/j.jaap.2011.10.002
Di Blasi, C., Branca, C., Santoro, A., and Hemandez, E. G. (2001). “Pyrolytic behavior and products of some wood varieties,” Combust. Flame 124(1-2), 165-177. DOI: 10.1016/S0010-2180(00)00191-7
Eschenbacher, A., Saraeian, A., Jensen, P. A., Shanks, B. H., Li, C. P., Duus, J. Ø., Smitshuysen, T. E. L., Damsgaard, C. D., Hansen, A. B., Kling, K. I, Mentzel, U. V., Henricksen, U. B., Ahrenfeldt, J., and Jensen, A. D. (2020). “Deoxygenation of wheat straw fast pyrolysis vapors over Na-Al2O3 catalyst for production of bio-oil with low acidity,” Chemical Engineering Journal 394, 124878. DOI:10.1016/j.cej.2020.124878
Faix, O. (1991). “Classification of lignins from different botanical origins by FTIR spectroscopy,” Holzforschung 45(1), 21-27. DOI: 10.1515/hfsg.1991.45.s1.21
Fu, P., Hu, S., Xiang, J., Sun, L., Su, S., and An, S. (2012). “Study on the gas evolution and char structural change during pyrolysis of cotton stalk,” J. Anal. Appl. Pyrol. 97, 130-136. DOI: 10.1016/j.jaap.2012.05.012
Gierlinger, N., Goswami, L., Schmidt, M., Burgert, I., Coutand, C., Rogge, T., and Schwanninger, M. (2008). “In situ FT-IR microscopic study on enzymatic treatment of poplar wood cross-sections,” Biomacromolecules 9(8), 2194-2201. DOI: 10.1021/bm800300b
Granada, E., Eguia, P., and Vilan, J. A. (2012). “FTIR quantitative analysis technique for gases. Application in a biomass thermochemical process,” Renew. Energy 41, 416-421. DOI: 10.1016/j.renene.2011.11.020
Lee, Y., Park, J., Ryu, C., Gang, K. S., Yang, W., Park, Y. K., Jung, J., and Hyun, S. (2013). “Comparison of biochar properties from biomass residues produced by slow pyrolysis at 500 °C,” Bioresource Technol. 148, 196-201. DOI: 10.1016/j.biortech.2013.08.135
Liu, Q., Wang, S., Zheng, Y., Luo, Z., and Cen, K. (2008). “Mechanism study of wood lignin pyrolysis by using TG-FTIR analysis,” J. Anal. Appl . Pyrol. 82(1), 170-177. DOI: 10.1016/j.jaap.2008.03.007
Ma, Z., Gu, D. C. J., Bao, B., and Zhang, Q. (2015). “Determination of pyrolysis characteristics and kinetics of palm kernel shell using TG-FTIR and model-free integral methods,” Energ. Convers. Manage. 89, 251-259. DOI: 10.1016/j.enconman.2014.09.074
Mushtaq, F., Mat, R., and Ani, F. N. (2014). “A review on microwave assisted pyrolysis of coal and biomass for fuel production,” Renew. Sust. Energ. Rev. 39, 555-574. DOI: 10.1016/j.rser.2014.07.073
Ounas, A., Aboulkas, A., El harfi, K., Bacaoui, A., and Yaacoubi, A. (2011). “Pyrolysis of olive residue and sugar cane bagasse: Non-isothermal thermogravimetric kinetic analysis,” Bioresource Technol. 102(24), 11234-11238. DOI: 10.1016/j.biortech.2011.09.010
Pandey, K. (1999). “A study of chemical structure of soft and hardwood and wood polymers by FTIR spectroscopy,” J. Appl. Polym. Sci. 71(12), 1969-1975. DOI: 10.1002/(SICI)1097-4628(19990321)71:12<1969::AID-APP6>3.0.CO;2-D
Pasangulapati, V., Ramachandriya, K. D., Kumar, A., Wilkins, M. R., Jones, C. L., and Huhnke, R. L. (2012). “Effects of cellulose, hemicellulose, and lignin on thermochemical conversion characteristics of the selected biomass,” Bioresource Technol. 114, 663-669. DOI: 10.1016/j.biortech.2012.03.036
Peng, Y. Y., and Wu, S. B. (2010). “The structural and thermal characteristics of wheat straw hemicellulose,” J. Anal. Appl. Pyrol. 88(2), 134-139. DOI: 10.1016/j.jaap.2010.03.006
Perry, S. W., and Chilton, C. N. (1973). Chemical Engineering Handbook, 5th Ed. McGraw-Hill, New York, NY, USA.
Qu, T., Guo, W., Shen, L., Xiao, J., and Zhao, K. (2011). “Experimental study of biomass pyrolysis based on three major components: Hemicellulose, cellulose, and lignin,” Ind. Eng. Chem. Res. 50(18), 10424-10433. DOI: 10.1021/ie1025453
Salman, R. N., Imtiaz, A., Saqib, N., and Taqvi, S. A. A. (2020). “Assessment of agro-industrial residues for bioenergy potential by investigating thermo-kinetic behavior in a slow pyrolysis process,” Fuel, 278, 118259. DOI: 10.1016/j.fuel.2020.118259
Sanchez-Silva, L., López-González, D., Villaseñor, J., Sánchez, P., and Valverde, J. L. (2012). “Thermogravimetric-mass spectrometric analysis of lignocellulosic and marine biomass pyrolysis,” Bioresource Technol. 109, 163-172. DOI: 10.1016/j.biortech.2012.01.001
Shen, D. K., Gu, S., Luo, K. H., Wang, S. R., and Fang, M. X. (2010). “The pyrolytic degradation of wood-derived lignin from pulping process,” Bioresource Technol. 101(15), 6136-6146. DOI: 10.1016/j.biortech.2010.02.078
Stocker, M. (2008). “Biofuels and biomass-to-liquid fuels in the biorefinery: Catalytic conversion of lignocellulosic biomass using porous materials,” Angew. Chem. Int. Ed. 47(48), 9200-9211. DOI: 10.1002/anie.200801476
Sun, R. C., and Tomkinson, J. (2002). “Characterization of hemicelluloses obtained by classical and ultrasonically assisted extractions from wheat straw,” Carbohyd. Polym. 50(3), 263-271. DOI: 10.1016/S0144-8617(02)00037-1
Sun, X. F., Sun, R. C., Su, Y., and Sun, J. X. (2004). “Comparative study of crude and purified cellulose from wheat straw,” J. Agric. Food Chem. 52(4), 839-847. DOI: 10.1021/jf0349230
Sun, X. F., Sun, R. C., Fowler, P., and Baird, M. S. (2005). “Extraction and characterization of original lignin and hemicelluloses from wheat straw,” J. Agric. Food Chem. 53(4), 860-870. DOI: 10.1021/jf040456q
Türe, S., Uzun, D., and Ture, I. E. (1997). “The potential use of sweet sorghum as a non-polluting source of energy,” Energy 22(1), 17-19. DOI: 10.1016/0360-5442(95)00024-0
Várhegyi, G. (2007). “Aims and methods in non-thermal reaction kinetics,” J. Anal. Appl. Pyrol. 79(1-2), 278-288. DOI: 10.1016/j.jaap.2007.01.007
Vassilev, S. V., Baxter, D., Andersen, L. K., and Vassileva, C. G. (2010). “An overview of the chemical composition of biomass,” Fuel 89(5), 913-933. DOI: 10.1016/j.fuel.2009.10.022
Wang, S., Wang, K., Liu, Q., Gu, Y., Luo, Z., Cen, K., and Fransson, T. (2009). “Comparison of the pyrolysis of lignins from different tree species,” Biotechnol. Adv. 27(5), 562-567. DOI: 10.1016/j.biotechadv.2009.04.010
Wilson, L., Yang, W., Blasiak, W., Geoffrey, J. R., and Guthbert, M. F. (2011). “Thermal characterization of tropical biomass feedstocks,” Energ. Convers. Manage. 52(1), 191-198. DOI: 10.1016/j.enconman.2010.06.058
Zhang, Y. F., Xie, X. X., Zhao, J., and Wei, X. L. (2020). “The alkali metal occurrence characteristics and its release and conversion during wheat straw pyrolysis,” Renew. Energy 151, 255-262. DOI: 10.1016/j.renene.2019.11.013
Zhao, S. H., Yang, P. B., Liu, X. F., Zhang, Q.-G., and Hu, J.-J. (2020). “Synergistic effect of mixing wheat straw and lignite in co-pyrolysis and steam co-gasification,” Bioresource Technol. 302, 122876. DOI: 10.1016/j.biortech.2020.122876
Article submitted September 29, 2020; Peer review completed: January 15, 2021; Revisions accepted: January 24, 2021; Published: January 27, 2021.
DOI: 10.15376/biores.16.1.1958-1979