
Abstract
To evaluate the influence of different normal pressures and the fiber orientation on the in-plane compression behavior of paperboard during the deep drawing process, a new method was developed. In addition, the influence of the wrinkle formation on the dynamic coefficient of friction and the bending resistance was examined. To evaluate the eligibility of the in-plane compression testing method, a validation strategy was developed to compare the results from the new alternative tests with the punch force profiles from the deep drawing process within an empirical model.
Download PDF
Full Article
A New Method to Evaluate the In-plane Compression Behavior of Paperboard for the Deep Drawing Process
Alexander Lenske,a,* Tobias Müller,b Nicole Ludat,a Marek Hauptmann,a,c and Jens-Peter Majschak a
To evaluate the influence of different normal pressures and the fiber orientation on the in-plane compression behavior of paperboard during the deep drawing process, a new method was developed. In addition, the influence of the wrinkle formation on the dynamic coefficient of friction and the bending resistance was examined. To evaluate the eligibility of the in-plane compression testing method, a validation strategy was developed to compare the results from the new alternative tests with the punch force profiles from the deep drawing process within an empirical model.
DOI: 10.15376/biores.17.2.2403-2427
Keywords: In-plane compression; Friction behavior; Bending resistance; Empirical model; Paperboard; Tribocharging; Deep drawing process; 3D-forming
Contact information: a: Fraunhofer Institute for Processing Technology IVV, Heidelbergerstraße 20, 01189 Dresden, Germany; b: Chair of Processing Machines/Processing Technology, Technische Universität Dresden, Bergstrasse 120, 01069 Dresden Germany; c: Chair of packaging machines and packaging technologies, Steinbeis-Hochschule, Ernst-Augustin-Str. 15, 12489 Berlin, Germany;
* Corresponding author: alexander.lenske@ivv-dresden.fraunhofer.de
GRAPHICAL ABSTRACT
INTRODUCTION
Deep drawing of paperboard with rigid tools and immediate compression is characterized by drawing a paperboard blank with a punch into a forming cavity against the resistance induced through a blankholder (Hauptmann and Majschak 2011). During the forming process a compression force develops in-plane within the paperboard blank due to the excess material from the difference between the outer perimeter of the paperboard blank and the inner perimeter of the forming cavity, resulting in inevitable wrinkles (Hauptmann et al. 2015; Wallmeier et al. 2015; Müller et al. 2017). Mark (2002) presented different methods to characterize the in-plane compression behavior of paperboard within substitute tests, but none of them used a defined normal load orthogonal to the plane of the paperboard blank to simulate the characteristic blankholder force from the deep drawing process.
The purpose of this paper is to present a newly developed method to investigate the in-plane compression behavior of paperboard under a defined normal load orthogonal to the plane of the paperboard blank to meet the requirements of the deep drawing process. The in-plane compression behavior of a commercially available paperboard material was determined based on three different normal loads and the fiber direction of the paperboard sample. To evaluate the eligibility of the newly developed method to investigate the in-plane compression behavior as a substitute test for the deep drawing process, a validation strategy was developed. Within the validation strategy four variations of the deep drawing process were presented to isolate the overlapping process forces of the forming process. In addition to that, the respective punch force profiles of the forming process variations were compared to reconstructed punch force profiles from results of the newly developed in-plane compression method as well as results from friction and bending tests.
EXPERIMENTAL
Materials
In the experiments to be described, the commercially available material called Trayforma Natura (Stora Enso, Imatra, Finland) was used, which consists of three layers of virgin-quality fiber, with a grammage of 350 g/m2, and a thickness of
0.43 mm to 0.45 mm (www.storaenso.com).
Methods
3-D forming equipment and variants of the deep drawing process
All deep drawing tests were conducted with the same tool-setup in a servo-hydraulic press described in Hauptmann and Majschak (2011). The tool-setup consists of a forming cavity, a blankholder, and a punch, as shown in Fig. 1a. The forming cavity, the blankholder, and the punch were made of polished stainless steel (Material No. X5CrNi18-10 or 1.4301 in accordance with the DIN EN 10027-2 (2015) standard). To reduce the friction between the paperboard sample and the tool surfaces, the blankholder and the upper part of the forming cavity were prepared with self-adhesive PTFE-foil (Polytetrafluorethylene glass fabric foil 0.13 AS AD-T, Hightechflon Films and Fabrics, Konstanz, Germany) (Fig. 1a). Preliminary tests showed that the PTFE-foil could not be applied to the area of the infeed radius and the inner contour of the forming cavity with reproducible results. Therefore, it was only applied to the circular ring surface under the blankholder.
Figure 1a shows also the schematic of deep drawing process variant 1. The geometrical data of the tool-setup, as listed in Tab. 1, was taken from Lenske et al. (2017), except for the drawing clearance aGap. By reducing the radius of the drawing punch rP, the distance aGap between cavity and punch increased significantly in relation to the thickness of the paperboard material. Because of that, there was no contact between the paperboard material and the inner contour of the forming cavity, preventing any friction in this area.

Fig. 1. a) Tool-setup schematic for deep drawing process variant 1 with the location of the self-adhesive PTFE-foil; b) Schematic of the effective process force components during deep drawing process variant 1; c) Schematic of the modified paperboard sample used in deep drawing process variant 1, 2 and 3
The blankholder was positioned at a defined distance dBH.1, 30 millimeters above the paperboard sample. Since no blankholder force was applied during deep drawing process variant 1, the friction between the paperboard sample and the tool surfaces could be kept as low as possible, but at the same time the paperboard sample blank was bent around the punch edge. To avoid in-plane compression, the paperboard sample was modified with triangular cutouts (Fig. 1c). Because of that, no excess material was compressed within wrinkles due to the lateral movement of the paperboard material during the deep drawing process variant. The cutouts were evenly distributed around the circumference of the paperboard sample, each with an opening angle Sample of 3 ° starting from a radius rFC. These modified paperboard samples were also used in deep drawing process variant 2 and 3. The only effective process force within deep drawing process variant 1 was the bending force around the punch edge FB.PE.1 (sP) (Fig. 1b), which can be measured completely isolated from all other process forces within the punch force FP.1 during the punch movement sP.
Table 1. Geometrical Data and Parameters of the Deep Drawing Process Variants

Figure 2a shows the schematic of deep drawing process variant 2. In contrast to deep drawing process variant 1, the blankholder was positioned at a defined distance dBH.2, 3 millimeters above the modified paperboard. Since no blankholder force was applied during deep drawing process variant 2, the friction between the modified paperboard sample and the tool surfaces was kept as low as possible, but at the same time the modified paperboard sample blank was bended around the punch edge and the infeed radius. Due to the modified paperboard sample, no in-plane compression occurred. Because of that, the effective process forces within deep drawing process variant 2 were the bending force components around the punch edge FB.PE.2 (sP) and around the infeed radius FB.IR.2 (sP), as well as the spring-back force FB.SB.2 (sP), which could be measured completely isolated from all other process forces within punch force profile FP.2 (sP) (Fig. 2b).

Fig. 2. a) Tool-setup schematic for deep drawing process variant 2 b) Schematic of the effective process force components during deep drawing process variant 2
Figure 3a shows the schematic of deep drawing process variant 3. In contrast to deep drawing process variant 1 and 2, the blankholder applied a constant normal load pN.BH onto the modified paperboard sample. As a result, friction forces were acting between the modified paperboard sample and the blankholder FF.BH.3 (sP), the forming cavity FF.FC.3 (sP), and the infeed radius FF.IR.3 (sP) (Fig. 3a) as an addition to the bending force components FB.PE.3 (sP), FB.IR.3 (sP), and FB.SB.3 (sP) (Fig. 3b). All process forces within deep drawing process variant 3 could be measured within punch force profile FP.3 (sP) (Fig. 3b).

Fig. 3. a) Tool-setup schematic for deep drawing process variant 3 and effective friction force components; b) Schematic of the effective bending force components during deep drawing process variant 3
Figure 4a shows the schematic of deep drawing process variant 4. In contrast to deep drawing process variant 1, 2, and 3, the blankholder applied a constant normal load pN.BH onto a paperboard sample without triangular cutouts (Fig. 4c). As a result, friction forces were active between the paperboard sample and the blankholder FF.BH.4 (sP), the forming cavity FF.FC.4 (sP), and the infeed radius FF.IR.4 (sP) (Fig. 4a) as an addition to the bending force components FB.PE.4 (sP), FB.IR.4 (sP), and FB.SB.4 (sP) and the in-plane compression force FIPC.4 (sP) (Fig. 4b). All process forces within deep drawing process variant 4 could be measured within punch force profile FP.4 (sP) (Fig. 4b).

Fig. 4. a) Tool-setup schematic for deep drawing process variant 4 and effective friction force components; b) Schematic of the effective bending and in-plane compression force components during deep drawing process variant 3
To compare the in-plane compression force FIPC.4 (sP) of deep drawing process variant 4 and the results of the newly developed in-plane compression method, the in-plane compression ratio kDDP.4 for deep drawing process variant 4 was determined. In general, the in-plane compression ratio k is the ratio between the in-plane compression movement and the total length of the paperboard sample. In deep drawing process variant 4 the maximum in-plane compression movement is the difference between the outer perimeter of the paperboard sample blank and the inner perimeter of the forming cavity (Fig. 4c). The total length of the paperboard sample is then the outer perimeter of the paperboard sample blank. To describe the progression of the in-plane compression ratio kDDP.4, the movement of the paperboard sample below the blankholder sPS.BH was used, which ended after 25 millimeters, when the paperboard sample was completely drawn into the forming cavity (Fig. 4a and 4c).
 (1)
(1)
In-plane compression measurement equipment
The in-plane compression testing method (Fig. 5a), in the following abbreviated with IPCTM, is based on a similar approach to investigate the in-plane compression behavior of paperboard from Lenske et al. (2017a) and mounted on the flexible testing rig described in Lenske et al. (2017b).

Fig. 5. a) Schematic side-view of the in-plane compression testing method (IPCTM) with tool-samples prepared with PTFE-foil; b) Schematic detail-view of tool-sample 2, the paperboard sample, the compression plate and the metal sheet
A rectangular paperboard sample was positioned between two tool-samples. A compression plate served as end-stop for the paperboard sample. The compression plate was attached to a force sensor (KD9363s, ME Messsysteme, Henningsdorf, Germany; measuring range ± 2,5 kN; accuracy class 0.1%) and the surrounding frame structure. On the other side of the paperboard sample, a metal sheet was attached to a force sensor (KD9363s, ME Messsysteme, Henningsdorf, Germany; measuring range ± 12 kN; accuracy class 0.1%) within a metal frame and could be moved due to the pulling system described in Lenske et al. (2017b). The metal sheet must be slightly thinner than the thickness of the paperboard sample to avoid contact between the tool samples and the metal sheet. The thickness of the metal sheet tMS.IPCTM was therefore determined as 0.4 mm (Fig. 5b). During the IPCTM, the upper tool arrangement applied a constant normal pressure pN.IPCTM (sIPCTM) onto the paperboard sample blank due to the force control of the pushing system described in Lenske et al. (2017b). The in-plane compression force FIPC.IPCTM resulted from the movement sIPCTM of the metal sheet into the paperboard sample with a defined relative velocity vIPCTM against the end-stop of the compression plate. The compression plate was positioned two tenths of a millimeter from the two tool-samples away, to record the in-plane compression force FIPC.IPCTM (sIPCTM) without disturbance of any other force component such as friction. As a result of the IPCTM, the paperboard samples showed a significant wrinkle formation (Fig. 10). In order to investigate the influence of this wrinkle formation on the friction and bending behavior, the paperboard samples with wrinkle formation were used within the strip-testing method (STM) (Fig. 6a) and the modified two-point bending test (MTPBT) (Fig. 8a). For this purpose, the width of the paperboard samples wPS.IPCTM was expanded (Tab. 2). The paperboard samples with wrinkle formation for the STM and MTPBT were produced without investigating the in-plane compression force FIPC.IPCTM. The tool-samples were fully covered with self-adhesive PTFE foil (Fig. 5a). The in-plane compression ratio was adapted from deep drawing process variant 4 and transferred to the paperboard sample blank for the IPCTM. The geometrical data and parameters used for the IPCTM are listed in Table 2.
 (2)
(2)
Table 2. Geometrical Data and Parameters of the IPCTM

Friction measurement equipment
The evaluation of the friction behavior of the paperboard material was carried out with the strip-testing method (STM) (Fig. 6a), according to Lenske et al. (2017b). The tool-samples were fully covered with self-adhesive PTFE foil. The geometry of the tool- and paperboard samples used during the STM are shown in Fig. 6b and listed in Table 3. The orientation of the paperboard sample with wrinkle formation during the STM is shown in Fig. 6c.

Fig. 6. a) Schematic side-view of the Strip-testing method (STM) according to
Lenske et al. (2017b) with tool-samples prepared with PTFE-foil; b) Schematic detail-view of tool-sample 2 and a paperboard sample; c) Schematic detail-view of tool-sample 2 and a paperboard sample with wrinkle formation
Table 3. Geometrical Data and Parameters of the STM

To examine the effect of the transition from the area covered with PTFE-foil into the area consisting of the polished stainless steel within deep drawing process variant 3 and 4 at the infeed radius (Figs. 3a and 4a), the double strip-testing method (DSTM) (Fig. 7a), was used according to Lenske et al. (2018). Within the DSTM, the tool-samples were only covered partially with self –adhesive PTFE-foil, representing the area between the blankholder and the upper part of the forming cavity. The length of the PTFE-foil covered area of the tool sample lTS.PTFE.DSTM is shown in Fig. 7b, as well as all other relevant geometry descriptions of the tool and paperboard samples. The infeed radius of the forming cavity was represented through the part of the tool-sample within the DSTM, which was uncovered with PTFE-foil lTS.SS.DSTM and consisted of polished stainless steel (Material No. X5CrNi18-10 or 1.4301 in accordance with the DIN EN 10027-2 (2015) standard). The paperboard sample started the sliding movement sDSTM from the line, which marked the transition from PTFE-foil to polished stainless steel. The geometrical data and parameters used for the DSTM are listed in Table 4. The normal forces, which were used for the DSTM, were selected according to the normal forces in Lenske et al. (2018).

Fig. 7. a) Schematic side-view of the Double strip-testing method (DSTM) according to
Lenske et al. (2018) with tool-samples partially prepared with PTFE-foil; b) Schematic detail-view of tool-sample 2 and a paperboard sample
Table 4. Geometrical Data and Parameters of the DSTM

Bending measurement equipment
A modified two-point bending test (MTPBT) (Fig. 8a) according to
DIN 53121 (2008) was used to examine the bending resistance of the paperboard material, built on the base of the flexible testing rig from Lenske et al. (2017b). For this purpose, the force sensor from the friction measurement system was removed and the lower tool assembly was connected to the machine frame. The upper tool arrangement, driven by an electromechanical servo-cylinder (Serac KH30, Ortlieb, Kirchheim, Germany; constant force range ± 30 kN) could then pass the lower tool arrangement without hindrance. The movement of the upper tool arrangement bent the paperboard sample around the edge of lower tool sample. The bending force FB.MTPBT (sMTPBT) was measured through a force sensor (KD9363s, ME Messsysteme, Hennigsdorf, Germany; measuring range ± 10 kN; accuracy class 0.1%) between the electromechanical servo-cylinder and the upper tool arrangement and evaluated as bending resistance WB.MTPBT (sMTPBT) in relation to the paperboard sample width wPS.MTPBT in order to compare the results of the MTPBT for paperboard samples without wrinkle formation and paperboard samples with wrinkle formation, which were produced within the IPCTM. Both tool samples were positioned at a defined distance from each other. The distance corresponded to the drawing clearance aGap within the tool-set of the forming process (Fig. 1a and Table 1). Figure 8b shows the paperboard sample without wrinkle formation and Fig. 8c with wrinkle formation and the corresponding bending lines as an example of the positioning within the MTPBT. Within the deep drawing process, the wrinkles always run radially from the center of the base geometry to the edge of the wall section of the drawn part. Because of that, the bending line is always orthogonal to the direction of the wrinkle orientation. For example, a paperboard sample that was modified during the IPCTM with a wrinkle formation in MD was consequently loaded in the MTPBT orthogonally to the wrinkle orientation, which was arranged parallel to CD. The calculation of the bending resistance WB.MTPBT (sMTPBT) of the paperboard sample with wrinkle formation was also based on the original sample length lPS.IPCTM of 42 mm before the in-plane compression.

Fig. 8. a) Modified two-point bending test schematic according to DIN 53121 (2008); Positioning of the paperboard sample and the bending line in relation to the fiber-direction during the MTPBT b) without wrinkle formation and c) with wrinkle formation
Table 5 summarizes geometrical data and parameters for the MTPBT.
Table 5. Geometrical Data and Parameters of the MTPBT

Test procedure
To ensure that there was no contamination of the paperboard samples, clean surgical gloves were worn, and the metal tools for the deep drawing process as well as for the substitute tests were cleaned before each test series with a sterile cotton wipe soaked with acetone. In addition to that, before each test series, fresh PTFE-foil was attached to each of the tool surfaces according to the descriptions above. All the repetitions of a test series with the same parameter setup were performed using fresh paperboard samples for each repetition. Each test series performed with the substitute tests and all deep-drawing process variants were performed with 10 repetitions in a row, except for one test series from the STM. To show the influence of triboelectric charging during the friction test, the test series shown in Fig. 13a was performed with 200 repetitions in a row. The tools used for the substitute tests were composed of polished stainless steel (Material No. X5CrNi18-10 or 1.4301 in accordance with the DIN EN 10027-2 (2015) standard) and were separately grounded on the side of the tool bulk. The deep drawing process variants and the substitute tests were performed under standard climate conditions (23 °C; 50% relative humidity) and with unheated tools at 23 °C.
RESULTS AND DISCUSSION
In-plane Compression
During the IPCTM, the total force FT.IPCTM, the in-plane compression force FIPC.IPCTM, and the friction force FF.IPCTM against the lower tool sample were recorded according to Figure 5a. Figure 9 shows the progression of the three force curves as a mean value from a test series of 10 repetitions in line of the main fiber direction in MD and with a normal pressure pN.IPCTM of 0.3 MPa. The total force FT.IPCTM must be the sum of the in-plane compression force FIPC.IPCTM and two times the friction force FF.IPCTM from the paperboard sample against both tool samples. Trayforma has the same virgin fiber material layers on both sides. Because of that, the friction force FF.IPCTM should be the same against both tool samples. Figure 9 shows, therefore, the difference FDiff.IPCTM between the total force FT.IPCTM and two times the friction force FF.IPCTM. The difference force FDiff.IPCTM and the in-plane compression force FIPC.IPCTM were almost exactly the same in terms of progression and amount, meaning that FIPC.IPCTM was measured without the influence of any friction forces in contrast to the results in Wallmeier et al. (2021).

Fig. 9. Measured and calculated force profiles and tool movement during the IPCTM at a normal pressure pN.IPCTM of 0.3 MPa in MD direction of the paperboard sample
The progression of the in-plane compression force FIPC.IPCTM increased steadily at the beginning of the IPCTM to a global maximum and then decreased to an almost constant plateau. The global maximum probably marks the point at which the in-plane compression had exhausted the compensatory capacity of the fiber structure of the paperboard sample mentioned in Hauptmann et al. (2015). After this point, the paperboard material must move out of the in-plane to evade the increasing compression force. This assumption is reinforced by evaluating the position of the upper tool sample trough the movement signal of the electromechanical servo-cylinder (Serac KH30, Ortlieb, Kirchheim, Germany; constant force range ± 30 kN). The accumulation of paperboard material results in an increasing counterforce against the normal pressure of the upper tool arrangement. In order to maintain the default constant normal pressure due to the force control of Serac KH30, the upper tool must move away from the increasing material accumulation. Because of the tool movement, the paperboard material could more easily evade the in-plane compression from the metal sheet, resulting in a reduced compression force FIPC.IPCTM after the global maximum depicted in Fig. 9. To prove this hypothesis, future research should add a camera setup to the IPCTM to record the progression of the wrinkle formation in relation to the position of the metal sheet, similar to the approach described in Wallmeier et al. (2021).
Figure 10 shows a paperboard sample from the test series depicted in Fig. 9, after the IPCTM from a side view with a distinct wrinkle formation. The left side of the compressed paperboard sample shows damage of the fiber structure because of the contact with the metal sheet. The metal sheet had penetrated the paperboard sample, slicing the fiber structure apart. In relation to the total length lPS.IPCTM of the paperboard sample the penetration depth must be considered negligible. However, in future work, the penetration depth of the metal sheet and the corresponding thickness of the metal sheet should be observed more closely.

Fig. 10. Paperboard sample after the IPCTM from the test series depicted in Fig. 9, with distinctive wrinkle formation
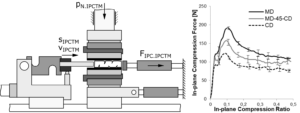
Figure 11a shows the influence of the anisotropy of the paperboard sample on the progression of the in-plane compression force FIPC.IPCTM for the fiber orientation in MD, CD, and 45° from MD pivoted (MD-45-CD) at 0.3 MPa normal pressure.

Fig. 11. Influence of the anisotropy of the paperboard sample at a normal pressure pN.IPCTM of 0.3 MPa during the IPCTM on the a) in-plane compression force FIPC.IPCTM (sIPCMT) and b) global maximum values of the in-plane compression force FIPC.IPCTM (sIPCMT)
The compression force FIPC.IPCTM was highest along the main fiber orientation in MD. Due to the manufacturing process of natural fiber materials, most of the individual fibers were aligned in MD, compared to only a few in CD. Assuming that the individual fibers act as thin cylinders, the mechanical load along their height can theoretically be viewed as an Euler’s buckling case. This means that the individual fiber resisted the external mechanical load until the cylinder structure buckled and finally broke. When the mechanical resistance of the fiber structure was mainly applied by the number of individual fibers that are arranged along the load direction, the resulting compression force must decrease from MD to CD. The evaluation of the global maxima of the in-plane compression force curves FIPC.IPCTM in Fig. 11b shows a linear relationship between the fiber orientations and the corresponding maximum in-plane compression forces.
The influence of normal pressure on the progression of the in-plane compression force is shown in Fig. 12a for two normal pressures at 0.3 and 0.5 MPa in MD. For a better overview, the normal pressure in between, 0.4 MPa, was omitted. Both in-plane compression force curves were almost identical. This result supported the conceptual model, mentioned above, that the mechanical resistance of the fiber structure was mainly applied only by the number of individual fibers that are arranged along the in-plane load direction. A higher normal pressure orthogonal to the in plane of the paperboard sample decreased only the out-of-plane tool movement and therefore the free spaces where the excess material can go to avoid the in-plane compression force, probably resulting in a better distributed wrinkle formation (Hauptmann and Majschak 2011). Figure 12b shows the global maxima of the in-plane compression force curves for three normal pressure levels in MD, CD, and 45° from MD pivoted (MD-45-CD).

Fig. 12. Influence of the normal pressure pN.IPCTM during the IPCTM on the a) in-plane compression force FIPC.IPCTM (sIPCMT) in MD direction of the paperboard sample and b) global maximum values of the in-plane compression force FIPC.IPCTM (sIPCMT) in MD, MD-45-CD, and CD direction of the paperboard sample
Frictional Behavior
Lenske et al. (2017b) showed the influence of the triboelectric charging on the coefficient of friction from paperboard against unheated stainless steel tools. The coefficient of friction increased significantly due to the assumed growth of the triboelectric charging over a high number of repetitions. To examine the influence of the PTFE-foil on the dynamic coefficient of friction in comparison to the results from Lenske et al. (2017b), Fig. 13a shows the dynamic coefficient of friction as a mean value from the last 10 tests of two test series with 200 individual repetitions, each performed with the STM at 0.3 MPa normal pressure against PTFE-foil and polished stainless steel. Compared to the dynamic coefficient of friction curve for polished stainless steel, taken from Lenske et al. (2017b), the dynamic coefficient of friction against PTFE-foil was significant lower and remained constant over the entire sliding movement. Static and sliding friction are caused by the two main friction mechanisms adhesion and deformation (Bayer and Sirico 1971; Tabor 1981). Hydrogen bridge bonding is the most common adhesion mechanism between two surfaces in close contact (Tabor 1981). It results from the electrostatic force between a hydrogen atom covalently bonded to a very electronegative atom such as an oxygen atom and another very electronegative atom for instance a second oxygen atom from another water molecule (Jeffrey 1997). PTFE consists of fluoride atoms with high electronegativity, which must cause a high attraction force for hydrogen atoms. But due to this high electronegativity they are on a severe inter molecular bond with their own carbon atoms, meaning that no or only very weak hydrogen bridge bonds can be formed with PTFE (Dunitz and Taylor 1997). On the other hand, triboelectric charging is explained in the literature (Galembeck et al. 2014; Zhang et al. 2015) primarily with the presence of moisture in the contact area of the friction partners. Diaz and Felix-Navarro (2004) described steel surfaces as hydrophilic, meaning that water can be bonded to the metal surface (Roudgar and Gross 2005). When paperboard is brought into contact with the metal surface, there must be an exchange of charge carriers from the paperboard to the metal surface (Zhang et al. 2015), when both surfaces are separated through the friction test. In theory, with the increasing amount of surface water between both contact partners after each repetition of the friction test, more hydrogen bridge bonds can be formed, resulting in an increasing force to separate both surfaces. In addition to that, there must be a saturation effect, when the amount of hydrogen bridge bonds remains constant and therefore the resulting friction force (Fig. 13b). In addition, the coefficient of friction from paperboard against stainless steel remains constantly low, similar to the behavior against PTFE-foil, when the tool surface is heated up to 120 °C
(Lenske et al. 2017b). Due to the high temperature, the wettability of the metal surface must be reduced. Because of that, the amount of surface water onto the metal is reduced significantly, resulting in a constant coefficient of friction, due to the limited amount of hydrogen bridge bonds. Because of the hydrophobic effect of the PTFE-foil, the number of individual tests for all subsequent test series with PTFE-foil can be limited to 10.

Fig. 13. Influence of the tool-sample surface during the STM at a normal pressure pN.STM of
0.3 MPa on a) the progression of the dynamic coefficient of friction against PTFE-foil and polished stainless steel taken from Lenske et al. (2017b) and on b) the progression of the mean values of the dynamic coefficient of friction over 200 repetitions against PTFE-foil and polished stainless steel taken from Lenske et al. (2017b)
The influence of the wrinkle formation on the dynamic coefficient of friction can be seen in Fig. 14a as a comparison between the STM performed with paperboard samples with and without wrinkle formation at 0.3 MPa normal pressure in MD. In addition, the dynamic coefficient of friction between the paperboard sample and tool-sample 2 during the IPCTM was evaluated from the frictional force FF.IPCTM and the constant normal pressure pN.IPCTM in relation to the decreasing paperboard sample surface between both tool samples. The wrinkle formation had no significant influence on the dynamic coefficient of friction, neither longitudinally nor orthogonal to the pulling direction. The same applied to all three normal pressure levels (Fig. 14b). Following the hydrogen bridge bonding theory above, the adhesion force between the paperboard and the PTFE-foil must be limited, due to the hydrophobic effect. Therefore, the friction resistance must be caused mainly by deformation mechanisms. When surface layers came into contact, roughness peaks interlocked with each other, causing contact deformations during a relative motion between both surfaces. The material characteristics of the surface layers, such as shear strength and hardness, as well as normal load, sliding speed, and temperature, had a major influence on the deformation component. The PTFE-foil had a very smooth finish to the surface layer, probably causing the independency between the normal load and the resulting coefficient of friction due to the limited amount of surface interlockings.

Fig. 14. Influence of the wrinkle formation during the STM and the IPCTM at a normal pressure pN.STM or pN.IPCTM of 0.3 MPa in MD-direction of the paperboard sample on the a) progression of the dynamic coefficient of friction and b) mean value of the dynamic coefficient of friction for three normal pressure levels pN.STM or pN.IPCTM
The influence of the transition from PTFE-foil to polished stainless steel on the dynamic coefficient of friction each performed with the DSTM at 400 N or 1200 N constant normal force is shown in Fig. 15a. The dynamic coefficient of friction in the area covered with PTFE-foil up to 25 mm sliding distance was comparable to that in Fig. 13a for tool plates completely prepared with PTFE-foil, supporting the already mentioned normal force independency of the coefficient of friction against PTFE-foil. When the paperboard sample left the area covered with PTFE-foil, the dynamic coefficient of friction decreased significantly, but it remained nearly constant thereafter. In addition to that, the standard deviation showed no growth of the coefficient of friction against polished stainless steel due to triboelectric charging effects mentioned in Lenske et al. (2018). In contrast to Lenske et al. (2018), the normal force had no influence on the dynamic coefficient of friction after the transition from PTFE-foil to polished stainless steel (Fig. 15b). The normal force dependency of the dynamic coefficient of friction for paperboard against unheated stainless steel tools described in Lenske et al. (2018) must be mainly caused by a growing adhesion force component, due to hydrogen bridge bonds. With an increasing normal force, the real area of contact between both surface layers increased likewise (Tabor 1981). With a higher real contact area, probably more hydrogen bridge bonds could be formed, resulting in a normal force dependency of the coefficient of friction. In addition to that, the transfer of the electrostatic charge must occur immediately when both surfaces come in contact with each other, explaining the transition effect. However, future research should examine the tool surfaces after the friction tests with an electron spectroscopy for chemical analysis, which was used for instance in Gurnagul et al. (1992). In addition to controlling the triboelectric charge, the transition effect from PTFE-foil to stainless steel is also of economic importance, especially regarding the production of complex forming cavities inner contours and their preparation with coatings to reduce frictional resistance.

Fig. 15. Influence of the constant normal force FN.DSTM during the DSTM a) on the progression of the dynamic coefficient of friction during the transition from PTFE-foil to polished stainless steel and b) on the mean values of the dynamic coefficient of friction after the transition from PTFE-foil to polished stainless steel
Bending Resistance
Figure 16a shows the influence of the anisotropy of the paperboard sample on the bending resistance WB.MTPBT (sMTPBT) during the MTPBT (Fig. 8b). After 3 to 5 mm of tool movement, the maximum bending resistance was reached and marked the bending break of the paperboard sample. Due to the structural damage, the resulting bending resistance WB.MTPBT (sMTPBT) decreased significantly. In addition, the maximum bending resistance was higher in MD than in CD, probably resulting from the higher number of fibers aligned in MD. Figure 16b shows the influence of the wrinkle formation on the bending resistance during the MTPBT (Fig. 8c). As a result of the additional wrinkle formation, the bending resistance increased significantly in MD and CD, compared to the results from the MTPBT without wrinkle formation (Fig. 16a). The wrinkle formation changed the material cross-section of the paperboard samples for the MTPBT significantly and therefore increased the bending resistance. In addition to that, the bending resistance in MD was smaller than in CD, resulting from the positioning of the paperboard sample with wrinkle formation within the MTPBT (Fig. 8c). The influence of the normal pressure during the IPCTM, when producing the paperboard samples with wrinkle formation for the MTPBT, is shown in Fig. 16c. The normal pressure during the IPCTM had no influence on the bending resistance of the paperboard sample neither in MD nor in CD. The differences between the normal pressure levels were too small to change the cross-section of the paperboard samples significantly, resulting in a similar behavior regarding the bending resistance.

Fig. 16. Progression of the bending resistance WB.MTPBT (sMTPBT) in MD and CD direction of the paperboard sample during the MTPBT a) without wrinkle formation (Fig. 8b) and b) with wrinkle formation (Fig. 8c); c) Influence of the anisotropy of the paperboard sample and the normal pressure pN.IPCTM during the IPCTM on the maximum bending resistance WB.MTPBT (sMTPBT) with wrinkle formation
Validation Strategy and Empirical Model Building
The empirical model for the reconstruction of the punch force profile FP.1 (sP) from deep drawing process variant 1 must represent the bending force around the punch edge FB.PE.1 (sP) as the only effective process force (Fig. 1b). For this purpose, the mean values from the progression of the bending resistance WB.MTPBT (sMTPBT) in MD and CD of the modified two-point bending test are formed and described with a 5-degree polynomial (Fig. 17a). Therefore, the empirical model FPFC.1 (sMTPBT) to describe the effective process force components during deep drawing process variant 1 are only valid for tool movement sMTPBT.
 (3)
(3)
Figure 17b shows the punch force profile FP.1 (sP) from deep drawing process variant 1 and the progression of the empirical model of FPFC.1 (sMTPBT) from Eq. 3. The punch force profile FP.1 (sP) showed a steep increase up to a global maximum at about 5 millimeters of punch movement. The global maximum probably marked the bending break at the punch edge, according to the results of the MTPBT (Fig. 16a). After that, the punch force profile decreased immediately. The remaining punch force must be caused from the friction between the modified paperboard sample and the inner contour of the forming cavity. However, the punch force profile and the corresponding empirical model were almost identical, meaning that the results from the modified two-point bending test and the selected modeling approach were sufficiently precise.

Fig. 17. a) Progression of the bending resistance 45 ° pivoted between MD and CD and corresponding 5th degree polynomial as trendline; b) Comparison between FP.1 (sP) and FPFC.1 (sMTPBT)
The empirical model for the reconstruction of the punch force profile FP.2 (sP) from deep drawing process variant 2 must represent all active process force components shown in Fig. 2b and was calculated from two partial models. The empirical model is only valid within the movement of the modified paperboard sample below the blankholder sPS.BH.
The first partial model described the initial bending break at the two bending lines punch edge and infeed radius of the forming cavity within the first 5 millimeters of paperboard movement sPS.BH according to the results from deep drawing process variant 1 (Fig. 17b) and the MTPBT (Fig. 16a). To calculate the bending force component FB.IR.2 (sPS.BH), Eq. 4 can be adapted with the geometry of the corresponding bending line around the infeed radius of the forming cavity.
 (4)
(4)
 (5)
(5)
After that, the bending force FB.PE.2 (sPS.BH) must decrease completely, according to the results from deep drawing process variant 1 (Fig. 17b). The bending force FB.IR.2 (sPS.BH), on the other hand, must remain active until the modified paperboard sample has been completely drawn into the forming cavity. As the paperboard movement sPS.BH continues, still unformed material of the modified paperboard sample was bended around the infeed radius, meaning that there was a continued bending break within the material structure. The continued bending break was calculated with the global maximum of the bending resistance curve in Fig. 17a. In addition to that, as the paperboard movement sPS.BH continues, the circumference of the modified paperboard sample increases along the bending line, which means that the resulting bending force FB.IR.2 (sPS.BH) must increase at the same time, due to an increase of the material cross-section, until the modified paperboard sample is completely drawn into the forming cavity.
 (6)
(6)
The spring back force FB.SB.2 (sPS.BH) must occur when the initial bending break around the infeed radius is complete and remain active as long the bending force FB.IR.2 (sPS.BH) is active. Through interpolation, the springback force FB.SB.2 (sPS.BH) was assumed to be 50% of the bending force around the infeed radius of the forming cavity FB.IR.2.2 (sPS.BH).
 (7)
(7)
The empirical model for the process force components FPFC.2 (sPS.BH), which were active during deep drawing process variant 2, was calculated from Eq. 8 and compared to the punch force profile FP.2 (sP) (Fig. 18). Within Eq. 8, Eqs. 4 and 5 are valid for the paperboard movement sPS.BH from 0 to 5 millimeters and Eqs. 6 and 7 are valid for the paperboard movement sPS.BH from 5 to 25 millimeters.
 (8)
(8)

Fig. 18. Comparison between punch force profile FP.2 (sP) and the empirical model of the process force components FPFC.2 (sPS.BH) during deep drawing process variant 2
The punch force profile FP.2 (sP) shows a steep increase up to a local maximum at approx. 4 millimeters of punch movement. This presumably marks the initial bending break at the two bending lines. The punch force profile FP.2 (sP) then drops slightly and rises again to a global maximum. The paperboard sample is exposed to a constant bending load at the infeed radius of the forming cavity, which only ends when the material is completely drawn into the forming cavity. As the punch movement continues, the circumference of the formed material increases along the bending line, which means that the resulting punch force must increase at the same time, due to an increase of the material cross-section. As soon as the paperboard sample leaves the area below the blankholder after approx. 25 millimeters, the punch force profile decreases almost completely. The punch force profile FP.2 (sP) and the sum of all process force components FPFC.2 (sPS.BH) from Eq. 8 are almost identical, meaning that the modeling approach must be sufficient.
The empirical model for the reconstruction of the punch force profile FP.3 (sP) from deep drawing process variant 3 must represent all bending force components shown in Fig. 3b, in addition to all friction force components shown in Fig. 3a. The empirical model is only valid within the movement of the modified paperboard sample below the blankholder sPS.BH. To calculate the bending force components, Eq. 8 was used, according to the results shown in Fig. 18. To reconstruct the frictional forces between the modified paperboard sample and the blankholder FF.BH.3 (sP) or the forming cavity FF.FC.3 (sP), a logarithmic trendline (Fig. 19a) was derived from the results of the STM from Figure 13a. According to Amontons (1699), the friction force results from the product of the coefficient of friction µ and the normal pressure pN in relation to a defined area A. The effective area below the blankholder corresponds to a circular ring, which decreased with increasing punch movement until the modified paperboard sample was completely drawn into the forming cavity after 25 mm.
 (9)
(9)
 (10)
(10)
The capstan equation or the Euler-Eytelwein formula was used to calculate the friction force around the infeed radius FF.IR.3 (sP) according to Hauptmann (2010). The coefficient of friction in the area of the infeed radius was calculated from a 2nd degree polynomial as a trendline (Fig. 19a) from the results during the DSTM at 800 N constant normal force after the transition from PTFE-foil to polished stainless steel. The holding force FHolding.3 (sPS.BH) was calculated from the summation of the friction force components FF.BH.3 (sPS.BH) and FF.FC.3 (sPS.BH) in Eq. 12.
 (11)
(11)
 (12)
(12)
The empirical model for all process force components FPFC.3 (sPS.BH), which were active during deep drawing process variant 3, was calculated from Eq. 13, as summation of Eqs. 8 through 11.
 (13)
(13)

Fig. 19. a) Progression of the dynamic coefficients of friction from the STM and the DSTM for 0.3 MPa or 800 N and the associated trendlines; b) Punch force profiles FP.3 (sP) from forming process variant 3 for three blank holder pressure levels; c) Comparison between punch force profile FP.3 (sP) and the empirical model of all active process force components FPFC.3 (sPS.BH) during forming process variant 3 for three blankholder pressure levels
Figure 19b shows the punch force profile FP.3 (sP) during deep drawing process variant 3 at three different normal pressures from the blankholder. The punch force curve increased to a global maximum at approximately 4 to 5 millimeters of punch movement. After that, the punch force profile decreased steadily until the modified paperboard sample was completely drawn into the forming cavity. It is noteworthy that the punch force profile decreased completely after a punch movement of approximately 28 mm, but the estimated drawing height must be 25 mm due to the modified paperboard sample geometry (Tab. 1). Hauptmann (2010) described an expansion of the paperboard sample under the normal load of the blankholder, whereby the sample blank was presumably held longer under the blankholder. The occurring strain effect was only taken into account indirectly within the empirical model, while the punch force curve was viewed retrospectively 25 millimeters from the position at which the punch force had completely decreased. After that, the adjusted punch force profile FP.3 (sP) was compared to the empirical model for all active process force components FPFC.3 (sPS.BH) during deep drawing process variant 3 at three different normal pressures from the blankholder (Fig. 19c). The empirical model curves were almost exactly the same as the measured punch force profiles for all three examined blankholder pressures. This means, that the assumptions from the substitute tests and the modelling approach seem to be correct.
The empirical model for the reconstruction of the punch force profile FP.4 (sP) from deep drawing process variant 4 must represent all active force components shown in Figs. 4a and 4b. To reconstruct the in-plane compression force FIPC.4 (sP) with results from the IPCTM, the in-plane compression force FIPC.IPCTM (sIPCTM) must be transferred from the IPCTM related paperboard sample (Fig. 5b) to the area of the paperboard sample, which was under in-plane compression during deep drawing process variant 4 (Fig. 4c). For this purpose, the in-plane compression force FIPC.IPCTM (sIPCTM) was related to the decreasing surface of the paperboard sample APS.IPCTM (sIPCTM) and referred to as in-plane compression resistance WIPC.IPCTM (sIPCTM).
 (14)
(14)
A trendline was derived from the in-plane compression resistance WIPC.IPCTM (sIPCTM) relative to the in-plane compression ratio kIPCTM (sIPCTM) using a polynomial of the 6th degree (Fig. 20a). After that, the in-plane compression resistance WIPC.IPCTM (kIPCTM) was transferred to the paperboard sample blank surface, which was under in-plane compression during deep drawing process variant 4.
 (15)
(15)
The in-plane compression force FIPC.4 (sPS.BH) is aligned radially to the circumference of the paperboard sample (Fig. 4b). To calculate the in-plane compression force component FIPC.PFC.4 (sPS.BH) of the punch force profile FP.4 (sP) during deep drawing process variant 4, FIPC.4 (sPS.BH) must be aligned in the direction of the punch movement sP, using a trigonometric tangent function.
 (16)
(16)

Fig. 20. a) Progression of the in-plane compression resistance WIPC.IPCTM (kIPCTM) from the IPCTM at 0.3 MPa and the associated trendline; b) Interpolated progression curve of the bending resistance WB.4 (sPS.BH) with increasing wrinkle formation
To calculate the bending force components FB.PFC.4 (sPS.BH), which are active during deep drawing process variant 4 (Fig. 4b), the influence of the wrinkle formation on the bending resistance WB.MTPBT (sMTPBT) (Fig. 16b and 16c) must be considered within the empirical model building. Hauptmann et al. (2015) and Müller et al. (2017) showed that no wrinkles occur during the first couples of millimeters of punch movement during the deep drawing process with immediate compression, because the excess material is compressed within the material structure. Accordingly, the initial bending break around the punch edge FB.PE.4 (sP) can be calculated with Eq. 4 until 5 millimeters of punch movement. After that, it was assumed that wrinkles were forming until the paperboard sample was completely drawn into the forming cavity. Accordingly, the bending resistance around the infeed radius FB.IR.4 (sP) and the springback force FB.SB.4 (sP) must be increasing due to the increasing material accumulation within the wrinkle formation. To calculate both bending force components, an increasing bending resistance profile WB.4 (sPS.BH) was interpolated from three known bending resistances. There was no bending resistance before the punch movement started. According to the results from deep drawing process variant 1 (Fig. 17b) and deep drawing process variant 2 (Fig. 18), the initial bending break was reached after approximately 5 millimeter of punch movement, with no wrinkle formation yet. After a punch movement of 25 millimeter, the material accumulation of the wrinkle formation must result in a global maximum of the bending resistance, which can be taken from Figs. 16b and 16c. The resulting trendline of the interpolated bending resistance profile WB.4 (sPS.BH) in relation to the movement of the paperboard sample under the blankholder sPS.BH (Fig. 20b) can be used to calculate the bending force components FB.IR.4 (sPS.BH) and FB.SB.4 (sPS.BH) with Eqs. 17 and 18.
 (17)
(17)
 (18)
(18)
The empirical model for all bending force components FB.PFC.4 (sPS.BH), which were active during deep drawing process variant 4, was calculated as summation from
Eqs. 4, 17, and 18. Within Eq. 19, Eq. 4 is only valid for the paperboard movement sPS.BH from 0 to 5 millimeters and Eqs. 17 and 18 are valid for the paperboard movement sPS.BH from 0 to 25 millimeters.
 (19)
(19)
To reconstruct the friction force components FF.BH.4 (sP) and FF.FC.4 (sP), Eqs. 9 and 10 were used in combination with the results from the STM (Fig. 19a). To calculate the friction force around the infeed radius FF.IR.4 (sP), Eq. 20 was used. In contrast to deep drawing process variant 3, the in-plane compression force component FIPC.PFC.4 (sPS.BH) must be implemented when calculating the holding force FHolding.4 (sPS.BH) in Eq. 21.
 (20)
(20)
 (21)
(21)
The empirical model for all friction force components FF.PFC.4 (sPS.BH), which were active during deep drawing process variant 4, was calculated as summation from
Eqs. 9, 10, and 20.
 (22)
(22)
The empirical model for all process force components FPFC.4 (sPS.BH), which were active during deep drawing process variant 4, was calculated from Eqs. 16, 19, and 22.
 (23)
(23)
Figure 21 shows the comparison between the punch force profile FP.4 (sP) and the empirical model of all process force components FPFC.4 (sPS.BH), which were active during deep drawing process variant 4, at three different normal pressures from the blankholder. Similar to the results from deep drawing process variant 3 (Fig. 19b), the punch force profile FP.4 (sP) decreased completely after a punch movement of approximately 28 mm, due to the supposed elongation effect. Because of that, the punch force profile FP.4 (sP) was viewed retrospectively 25 mm from the position at which the punch force had completely decreased, according to the results in Fig. 19c. Similar to the punch force profile FP.3 (sP) during deep drawing process variant 3, the punch force profile FP.4 (sP) increased to a global maximum at approximately 5 to 7 mm of punch movement. The punch force curve then decreased steadily until the sample blank was completely drawn into the forming cavity.
The empirical model curves were almost exactly the same as the measured punch force profiles for all three examined blankholder pressures. Because of that, the results from the newly developed method to investigate the in-plane compression behavior of paperboard IPCTM can be used as a substitute test for the deep drawing process.

Fig. 21. Comparison between the adjusted punch force profile FP.4 (sP) and the empirical model of all active process force components FPFC.4 (sPS.BH) during forming process variant 4 for three blankholder pressure levels
CONCLUSIONS
- The in-plane compression force can be measured without the disturbance of any friction force components within the newly developed in-plane compression testing method.
- The in-plane compression force depends on the anisotropy of the paperboard sample material. In the main fiber direction, the resulting in-plane compression force was significantly higher than orthogonal to the main fiber direction. It was assumed that the resistance of the material structure depends only on the number of fibers aligned in the direction of the mechanical load.
- The global maximum of the in-plane compression force was independent from the applied normal pressure. A higher normal pressure decreased only the out-of-plane tool displacement distance and therefore the free spaces where the excess material can go to avoid the in-plane compression force, probably resulting in a better distributed wrinkle formation.
- With the IPCTM, samples can be produced with a distinctive wrinkle formation and characterized in subsequent substitute tests to evaluate their friction behavior and bending resistance. However, the dynamic coefficient of friction was independent of the wrinkle formation. On the other hand, the bending resistance increased for paperboard samples with a wrinkle formation in relation to paperboard samples without a wrinkle formation.
- The triboelectric charging of uncoated paperboard material against unheated stainless steel tools at ambient temperature described in Lenske et al. (2017b, 2018), can be fully compensated by the application of self-adhesive PTFE-foil on the tool-sample surface. This significantly improved the reproducibility of the measurement data, which is why the number of individual tests within each test series can be significantly reduced. In addition to that, forming tools used within an industrial production line could be coated as well to prevent failures and enhance the production reliability.
- The application of the PTFE-foil within the deep drawing process variants was only possible in the area below the blankholder. This created a height difference from the PTFE-foil to the stainless steel surface in the area of the infeed radius. This transition effect could be simulated with the DSTM and significantly reduced the dynamic coefficient of friction against the stainless steel surface. Because of that, the forming cavity could be coated only in the area below the blankholder, leaving the infeed radius and the inner contour of the forming cavity uncoated.
- The comparison between the punch force profiles and the empirical model of all active punch force components during the validation strategy showed the eligibility of the newly developed method to investigate the in-plane compression behavior as a substitute test for the deep drawing process.
ACKNOWLEDGMENTS
The authors would like to thank Coesfeld Materialtest GmbH & Co. KG for technical support developing the friction tester and to Stefan Büttner, the Chair of Processing Machines and Mobile Machines of the TU Dresden, for software support.
REFERENCES CITED
Amontons, G. A. (1699). “De la resistance cause dans les machines [About resistance and force in machines],” Memories de l´Academie Royale A 275-282. DOI:
Bayer, R. G., and Sirico, J. L. (1971). “The friction characteristics of paper,” Wear 17,
269-277. DOI: 10.1016/0043-1648(71)90030-5
Diaz, A. F., and Felix-Navarro, R. M. (2004). “A semi-quantitative tribo-electric series for polymeric materials: The influence of chemical structure and properties,” Journal of Electrostatics 62(4), 277-290. DOI: 10.1016/j.elstat.2004.05.005
DIN 53121 (2008). “Testing of paper and board – determination of the bending stiffness by the beam method,” German Institute for Standardization, Berlin, Germany.
DIN EN ISO 1924-2 (2009). “Paper and board – Determination of tensile properties – Part 2: Constant rate of elongation method (20 mm/s),” German Institute for Standardization, Berlin, Germany.
Dunitz, J. D., and Taylor, R. (1997). “Organic fluorine hardly ever accepts hydrogen bonds,” Chemistry – A European Journal 3(1), 89-97. DOI: 10.1002/chem.19970030115
EN ISO 287 (2009). “Paper and board – Determination of moisture content of a lot – Oven drying method,” European Committee for Standardization, Brussels, Belgium.
Galembeck, F., Burgo, T. A. L., Balestrin, L. B. d. S., Gouveia, R. F., Silva, C. A., and Galembeck, A. (2014). “Friction, tribochemistry and triboelectricity: Recent progress and perspectives,” Royal Society of Chemistry Advances 4 (109),
64280-64298. DOI: 10.1039/c4ra09604e
Gurnagul, N., Ouchi, M. D., Dunlop-Jones, N., Sparkes, D. G., and Wearing, J. T. (1992). “Factors affecting the coefficient of friction of paper,” Journal of Applied Polymer Science 46(5), 804-814. DOI: 10.1002/app.1992.070460508
Hauptmann, M. (2010). “Die gezielte Prozessführung und Möglichkeiten zur Prozessüberwachung beim mehrdimensionalen Umformen von Karton durch Ziehen [Process management and process monitoring during the deep drawing of paperboard],” PhD Thesis, Technical University of Dresden
Hauptmann, M., and Majschak, J. (2011). “New quality level of packaging components from paperboard through technology improvement in 3D forming,” Packaging Technology and Science 24 (7), 419-432. DOI: 10.1002/pts.941
Hauptmann, M., Wallmeier, M., Erhard, K., Zelm, R., and Majschak, J. (2015). “The role of material composition, fiber properties and deformation mechanisms in the deep drawing of paperboard,” Cellulose 22(5), 3377-3395.
Jeffrey, G. A. (1997). An Introduction to Hydrogen Bonding, Oxford Press, Oxford, UK.
Lenske, A., Müller, T., Hauptmann, M., and Majschak, J. (2018). “New method to evaluate the frictional behavior within the forming gap during the deep drawing process of paperboard,” BioResources 13(3), 5580-5597. DOI: 10.15376/biores.13.3.5580-5597
Lenske, A., Hardtmann, A., Andrä, H. and Majschak, J.-P. (2017a). “Simulative und experimentelle Analyse des Umformvorgangs von Karton durch Ziehen [Simulative and experimental analysis of the deep drawing process of paperboard],” Final report of research project IGF-18047BG (www.ivlv.org)
Lenske, A., Müller, T., Penter, L., Schneider, M., Hauptmann, M., and Majschak, J. (2017b). “Evaluating the factors influencing the friction behavior of paperboard during the deep drawing process,” BioResources 12(4), 8340-8358. DOI: 10.15376/biores.12.4.8340-8358
Mark, R. E. (2002). Handbook of Physical Testing of Paper – Vol. 1, Marcel Dekker Inc., New York, NY, USA.
Müller, T., Lenske, A., Hauptmann, M., and Majschak, J. (2017). “Method for fast quality evaluation of deep-drawn paperboard packaging components,” Packaging Technology and Science 30(11), 703-710. DOI: 10.1002/pts.2315
Roudgar, A., and Gross, A. (2005). “Water bilayer on the Pd/Au(111) overlayer system: Coadsorption and electric field effects,” Chemical Physics Letters 409(4-6),157-162. DOI: 10.1016/j.cplett.2005.04.103
Tabor, D. (1981). “Friction – The present state of our understanding,” Journal of Lubrication Technology 103(2), 169-179. DOI: 10.1115/1.3251622
Wallmeier, M., Hauptmann, M., and Majschak, J. (2015). “New methods for quality analysis of deep-drawn packaging,” Packaging Technology and Science 28(2), 91-100. DOI: 10.1002/pts.2091
Wallmeier, M., Barbier, C., Beckmann, F., Brandberg, A., Holqvist, C., Kulachenko, A. Moosmann, J., Östlund, S., Pettersson, T. (2021). “Phenomenological analysis of constrained in-plane compression of paperboard using micro-computed tomography Imaging,” Nordic Pulp & Paper Research Journal 36(3), DOI: 10.1515/npprj-2020-0092
Zhang, Y., Pähtz, T., Liu, Y., Wang, X., Zhang, R., Shen, Y., Ji, R., and Cai, B. (2015). “Electric field and humidity trigger contact electrification,” Physical Review X 5(1), article ID 011002. DOI: 10.1103/PhysRevX.5.011002
Article submitted: November 4, 2021; Peer review completed: January 8, 2022; Revised version received: February 14, 2022; Accepted: February 27, 2022; Published: March 6, 2022.
DOI: 10.15376/biores.17.2.2403-2427