
Abstract
Print mottle is problematic in the print and paper industry. In this report, a mathematical evaluation model of print mottle was generated after analyzing several methods. The print mottle images can be evaluated by the model based on the theory of wavelet image denoising analyses that use the wavelet multi-scale fast algorithm. The model was then applied to analyze print mottle on four business papers (inkjet papers, newsprint papers, art papers, and double-coated offset printing papers). The correlation between the results of this method and the human visual evaluation system (HVS) was calculated and evaluated. Experimental results showed that the model predictions agreed with HVS results. The correlation between the printed newsprint papers and the eight different wavelet base functions was over 0.76 (such as haar, sym4, bior3.7, etc.) and decomposed at the first, second, and third levels. The results of the three other papers were better matched with the analysis by human eyes, but the correlation of the art paper and visual model were not as strong as the others. The optimal parameters for the print mottle model were presented in the four kinds of papers presented.
Download PDF
Full Article
Analysis and Evaluation Model for Print Mottle using Wavelet Image Denoising Method
Yongjian Xu,* Qiaoping Liang,* Qian Wang, Guodong Liu, and Lin Li
Print mottle is problematic in the print and paper industry. In this report, a mathematical evaluation model of print mottle was generated after analyzing several methods. The print mottle images can be evaluated by the model based on the theory of wavelet image denoising analyses that use the wavelet multi-scale fast algorithm. The model was then applied to analyze print mottle on four business papers (inkjet papers, newsprint papers, art papers, and double-coated offset printing papers). The correlation between the results of this method and the human visual evaluation system (HVS) was calculated and evaluated. Experimental results showed that the model predictions agreed with HVS results. The correlation between the printed newsprint papers and the eight different wavelet base functions was over 0.76 (such as haar, sym4, bior3.7, etc.) and decomposed at the first, second, and third levels. The results of the three other papers were better matched with the analysis by human eyes, but the correlation of the art paper and visual model were not as strong as the others. The optimal parameters for the print mottle model were presented in the four kinds of papers presented.
Keywords: Print mottle; Wavelet; Image denoising method; Mathematical evaluation model
Contact information: College of Bioresources Chemical and Materials Engineering, Shaanxi University of Science and Technology, XI’AN, Shaanxi, 710021, China;
* Corresponding authors: xuyongjian@sust.edu.cn; liangpu2016@outlook.com
INTRODUCTION
The characterization and evaluation of print mottle is a crucial factor in the assessment of print quality of papers and boards. Print mottle is a printing defect that generally relates to print density unevenness across the whole sheet. The definition proposed by the ISO 13660 (2001) standard says that print mottle is a periodic fluctuation of densities at a spatial frequency of less than 0.4 cycles per millimeter in all directions (Fahlcrantz and Johansson 2004). Print mottle may arise from an uneven ink transfer and absorption or penetration properties of substrates. When mottle occurs it is usually a result of a combination of factors, which can cause unevenness in one or more of the layers in the paper. This can be traced to variations in the formation and transverse (Z-directional) structure of the underlying base stock and/or coating. The causes of print mottle are typically related to ink type, paper type, the printing process, and binder migration to the coated paper surface. Because print mottle is an important aspect of print quality, it has been studied thoroughly, particularly with regard to the impacts on the quality of printed surfaces in multi-color printing.
Much has been written about the mechanisms, causes, and cures for print mottle. Back trap mottle is one type of print mottle in which ink is pulled from the printed surface onto a blanket as the sheet passes through successive printing nips. It is caused by uneven capillary absorption of paper and non-uniform ink setting. Latex composition has a significant influence on both back-trap mottle and fountain solution removal from paper during commercial printing (Van Gilder and Purfeerst 1994). Print mottling could occur even if a surface was homogeneous, resulting from a stochastic failure within the ink film (Schoelkopf et al. 2001; Ridgway and Gane 2003). The propensity for mottle correlates with the degree of porosity variation within the coating (Preston et al. 2008). Thus, there is an extension that offers a mathematical evaluation model of print mottling. Currently, evaluation methods for print mottle are largely subjective. For example, in the Chinese market, print mottle is evaluated by comparing the quality of printed samples with standard papers bearing the same printed image. This type of assessment relies heavily on the qualitative observations of experienced operators and, thus, lacks precision.
Several print mottle models have been discussed and established by other researchers. These models are called the ISO print mottle model (Fahlcrantz and Johansson 2004), the specific perimeter print mottle model, the coefficient of variation by band-pass image analysis print mottle model (Fahlcrantz et al. 2003), the descreening analysis of print mottle model (Christoffersson 2004), and the Stochastic Frequency Distribution Analysis (SFDA) algorithm (Rosenberger et al.2001; 2003). However, all of these lack complete accuracy in evaluating the print mottle.
The ISO print mottle model, which was built by mottle geometric definitions and algorithms, is considered fairly rough and has poor precision. The specific perimeter print mottle model does not consider noise and thresholding at 50% feature area. Therefore, the results by calculating pattern border length might not correspond well with human visual evaluation system (HVS) assessments. The pattern border length and the specific character of the pattern are both dependent on the threshold level (Fahlcrantz and Johansson 2004).
Using the coefficient of variation by band-pass image analysis and de-screening, the analysis could evaluate print mottle effectively. However, these models do not associate time domain with frequency domain and they failed to describe the typical stochastic features of the paper surface and print mottle because they use a global features for these changes. Wavelet analysis is a powerful tool to analyze images, as it can relate time domain with frequency domain to compensate for the shortcomings of the above techniques. Therefore, wavelet analysis has become more widely used in analyzing print mottle (Bernié et al. 2004; Dube et al. 2005; Eid et al. 2011; Liu et al. 2012).
The aim of this paper was to establish a mathematical model for analysis and to also evaluate the print mottle based on the wavelet image denoising method. The proposed model was tested and validated with different grades of paper by comparing the model results with those of human visual evaluation. The effects of the various wavelet base functions at different decomposition levels were conferred when they were used to assess the print mottle. Finally, this work studied the optimal parameters for the print mottle model on different grades of paper.
EXPERIMENTAL
Mathematical Model for Print Mottle Using Wavelet Image Denoising Analysis
Wavelet transforming is a type of analysis method for time-frequency that was developed in the mid-1980s. It has been called a mathematic microscope and is widely used in digital image analysis fields due to the function of the multi-resolution analysis (Zhang 2008; 2009). The wavelet transform of a signal x consists of an alternative representation of it, given by a coarser resolution version plus all the details lost across the several decomposition stages performed. This is also called multi-resolution decomposition and is conducted by successively applying quadrature mirror filters to the coarser resolution version (Mallat and Zhong 1992). The coarse resolution occurs after each decomposition stage and also when there is detail signaling. An example of detail signaling is when the filter shows what is lost when passing from one resolution level to a coarser one (Reis and Bauer 2009). Because the print mottle is a 2-D image, the digital image is discretized by a 2-D discrete wavelet transformation. This is accomplished through alternating applications of the 1-D filtering operations to the rows and columns of the matrix of pixel intensities. By implicitly using a separable 2-D wavelet basis set (tensor products of the 1-D basis functions) or by using the application of non-separable 2-D wavelet functions (Jansen 2012). The 2-D discrete wavelet transform is defined in Eq. 1, and the inverse wavelet transform is defined in Eq. 2,
 (1)
(1)
 (2)
(2)
where f(x, y) is the print mottle image and  is the wavelet base function. For base functions, some common and mature base functions such as db1, db3, db4, db5, haar, sym4, sym5, and bior3.7 were investigated in this paper. Other functions that are commonly used in wavelet analyses like morlet, mexican, and meyer do not have compact support and cannot be applied in discrete wavelet transforms (Liu et al. 2012). In this equation, j represents the decomposition level of the image, while k and l are the pixel position (j, k, l are integers). M and N pertain to the size of the discretized image.
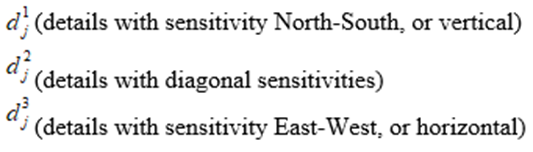
When a 2-D wavelet transformation is applied to decompose a digital image of the print mottle, it results in two parts, high and low in frequency. The high frequency parts of the image represent the detail of the print mottle image. In the 2-D situation, there are three types of details that are obtained at each scale. Such detailed images contained information regarding different spatial orientations: horizontal, vertical, and diagonal. For instance, for scale j, the detail images are as follows (Reis et al. 2009):
However, the low frequency parts describe an approximation of the print mottle image. For example, Fig. 1 shows an example of the wavelet transformation into the print mottle image after three decomposition stages. The high frequency parts generally included noise in the image. Thus, in this work, the high frequency parts were removed by setting them to zero, and the low frequency parts were kept. The reconstruction of the low parts was obtained by inverse discrete wavelet transformations. The print mottle image was denoised and transferred to a smooth image of print mottle (Rosenberger 2001; Zhang 2008; 2009). Variations in gray values of each pixel in the image reflect the information variations within the smooth image. The gray value coefficient of variance (COV) of the denoised image represents the index of print mottle (PM) as seen in Eqs. 3 through 5. Equation 3 is the mean of gray values for the denoised image. Equation 4 is the variance of gray values for the denoised image. Equation 5 is the COV of gray values in the denoised image, that is, the index of PM.
 (3)
(3)
 (4)
(4)
 (5)
(5)

I (x, y) is the size of gray values of a reconstructed smooth print mottle image after being discretized. N represents the size of the discretized image matrix.
Fig. 1. 2-D wavelet transform of a print mottle image, with the different detail images and the resulting coarser resolution approximation image, after three decomposition stages
Establishment of Evaluation System for Print Mottle
To check the validity of the new print mottle model, the establishment of a human visual evaluation system model was necessary because print mottle has traditionally been evaluated by a visual assessment. The correlation was calculated between the new print mottle model and HVS model.
Establishment of Human Visual Evaluation System
Print mottle is usually a subjective evaluation without formal guidelines or other criteria for ranking. It is based on several criteria (Rosenberger 2001). A popular method internationally called the “three grades” assessment method was used. This method was used to judge the printed images quality. Firstly, all samples (N) were observed. The best one in the sample group was assigned a score of m1 (m1 equals 1), and the worst was assigned m2 (m2 equals 3). Another was chosen from N-2 samples and assigned to mi (where i was the ith sample) to compare alongside the best and the worst sample groups. Finally, the scores for N samples were obtained as [m1, m2, …mi…mn], where m represented the score between 1 and 3. In order to make the results more precise, N people were chosen to evaluate the N samples under the range of normal visual distance.
Correlation Analysis of the Print Mottle Evaluation Model and HVS
Correlation analyses of the print mottle mathematical model and human visual evaluation system was determined using Eq. 6. The samples were evaluated using the HVS model. The results were V = [m1, m2, …mi…mn]. Next, the COV of gray value images was calculated by using one of the wavelet base functions at each of the four decomposition levels, as described above. The value of the correlation coefficient rXY represents the degree of similarity between the mathematical model and HVS. A higher value indicated a stronger the correlation between the two methods,
 (6)
(6)
where  is the correlation coefficient between X and Y,
  is the mean of value Xi, and
  is the mean of value Yi.
RESULTS AND DISCUSSION
The accuracy and applicability of the mathematical print mottle analysis model was verified using four grades of business papers: inkjet papers, newsprint papers, art paper, and double coated offset printing papers.
Experimental Samples
Four commercial paper samples were used from different suppliers. Details about the different papers are in Table I. The paper samples were 80 × 250 mm2. Care was taken to make sure the paper samples were not folded and had no other defects on the surface. The printing samples were printed on an IGT C1-7 tester (Amsterdam, Netherlands) with 0.3 mL offset magenta ink (Light and Quick Dry Magenta ink, Tianjin Toyo Ink co., Ltd) applied precisely by an IGT ink pipette, Tk-TNSG,). The printing condition were 0.2 m/s under 300 N of printing pressure at 23 °C. A total of 50 samples from each of the 70 individual samples for each paper grade were chosen because of the visibly noticeable print mottle on the paper surface through visual observations. The print mottle image of each sample was scanned and converted into digital images by ScanMaker 9800XL Plus scanner (model MRS-3200A3L, Microtek, Shanghai, China) as explained in Table 1, with representative examples shown in Fig. 2. An evaluation area of 4.27 × 4.27 cm was discretized in 2048 × 2048 (480 pixel/cm) with 256 gray levels (Dube and Mairesse 2005). The ROI (Region of Interest) was a region of at least 161 mm2 with the smallest dimensions at 12.7 mm2, contained wholly in the area (Fahlcrantz and Johansson 2004). The image was shown in an area of 8 × 8 cm area on a computer screen. This gave an effective resolution of 256 pixels/cm.

Fig. 2. Samples of print mottle image (a is an image in the lowest end of print quality on newsprint papers, with ranking of 3:00; b is one of the better images on art paper, with visual ranking of 1:10.)
Table 1. Properties of the Studied Commercial Paper Grades

Table 2. Scanner Conditions during Image Acquisition

Analysis Print Mottle Based on Wavelet Image Denoising
The print mottle assessment method was then applied to the four grades of printed papers. The correlation analysis between this method and HVS was considered. Twenty people were included in the visual assessment of the printed samples. All observers had normal visual perception and were trained on how to evaluate print mottle. The contrast and luminosity were 200:1 and 180 nits, respectively. The evaluation was done at a distance of 30 cm from the screen under ambient light (Dube et al. 2005). The scores were limited in the range from 1 to 3. A total of 50 printed samples were chosen for the evaluation of the print mottle. The average assessments of the 50 newsprint samples are shown as V below. The correlation results of eight wavelet base functions at different decomposition levels are given in Table 2.
V = [2.50 2.25 2.41 1.54 2.63 1.16 2.95 1.59 3.00 2.80 2.43 2.95 2.70 1.47 2.75 2.55 2.35 1.21 1.50 1.61 2.61 2.67 1.63 1.06 1.21 2.47 2.87 2.58 2.47 1.00 2.67 1.16 2.30 1.43 2.40 2.90 3.00 3.00 2.95 2.54 2.47 1.51 1.73 1.51 2.30 2.63 1.73 2.85 2.62 3.00]
For newsprint papers, the correlation between HVS and the haar function at decomposition levels 1 to 4 is shown in Figs. 3 through 6. As shown in Table 2, the evaluation results (all over 0.76) between the HVS and each wavelet base function of haar, sym4, sym5, bior3.7, db1, db3, db4, and db5 at level 1 to 3 were higher than those at level 4. Therefore, the optimal parameters for the newsprint paper would be with the base functions at levels 1 to 3. However, level 2 was preferred, and the results between the eight base functions were very similar. Therefore, this model would be a good evaluation method for print mottle as a substitution for visual assessments.

Fig. 3. Correlation between COV and visual evaluation with haar at level 1

Fig. 4. Correlation between COV and visual evaluation with haar at level 2

Fig. 5. Correlation between COV and visual evaluation with haar at level 3

Fig. 6. Correlation between COV and visual evaluation with haar at level 4
The correlation on the other three papers was variable, while their results showed predictive promise for the model. The results are shown in Tables 3 through 5. In Table 3, the results for inkjet paper show that a stable and good correlation occurred at decomposition levels 1 to 3. The level 2 was also preferred. In Table 4, the optimal decomposition level for double coated offset printing paper was level 3 to 4 regardless of what base function were being used. The paper got a lower correlation than the newsprint paper. In Table 5, the results of correlation on art papers were around 0.67 at level 1 for all base functions. The main reason for this is because it had excellent optical characteristics for the art paper. The art paper produced some deviation in the phase of scanning, and this was shown through a computer screen and visual assessment (Liu et al. 2012). Thus, deviations could be improved by using more precise instruments. The optimal parameters for the print mottle model for all grades of paper in this study are shown in Table 6.
Table 3. Correlation between Visual Assessment and Print Mottle Evaluation Results on Newsprint Papers with Eight Wavelet Base Functions (EWBF) at Four Decomposition Levels (FDL)

Table 4. Correlation between Visual Assessment and Print Mottle Evaluation Results on Inkjet Papers with EWBF at FDL

Table 5. Correlation between Visual Assessment and Print Mottle Evaluation Results on Double Coated Offset with EWBF at FDL

Table 6. Correlation between Visual Assessment and Print Mottle Evaluation Results on Art Papers with EWBF at FDL

Table 7. Optimal Parameters

CONCLUSIONS
- A mathematical model for the evaluation and analysis of print mottle on a wavelet denoising image that has a wavelet multi-scale fast algorithm was presented.
- The evaluation results showed that the HVS method had a good correlation with various wavelet base functions including haar, sym4, sym5, bior3.7, db1, db3, db4, db5 at different decomposition levels. The correlations of newsprint papers processing results and HVS were the best one with over 0.76 of all base functions demonstrating R2 for using the different wavelet base decomposing at the first, second, and third level to process the images of printed newspapers. The base function and decomposition level was taken into account when the method was applied to determine the print mottle. This is because the type of base functions and the decomposition level used will have minor influences on the overall results. The optimal parameters of the print mottle model for inkjet papers, newsprint papers, art papers, and double coated offset printing papers were also acquired. The correlations were not as strong for art papers as other papers.
- The mathematical model for evaluation and analysis of print mottle could benefit the print and papermaking industries through being able to accurately evaluate the print mottle on various papers. Now mills could then make improvements by modifying printing quality of papers and boards by testing it against the model. Papermaking industries could evaluate the printability of their papers according to the test results and improve their product quality. The next step is to find an industrial partner to help with a pilot scale trial.
ACKNOWLEDGMENTS
This work was supported by the Program of Key Lab of Pulp and Paper Science & Technology, Ministry of Education (Qilu University of Technology, Shandong Province) (08031345) and the Academic Leader Training Program (2013XSD25) from Shaanxi University of Science and Technology. The authors acknowledge the Scientific Research Project (51402180) supported by NSFC. The authors would also like to acknowledge the teachers and students from the print and papermaking engineering departments of Shaanxi University of Science and Technology (China) that assisted in the visual assessment of the papers.
REFERENCES CITED
Bernié, J. P., Pande, H., and Gratton, R. (2004). “A new wavelet-based instrumental method for measuring print mottle,” Pulp & Paper Canada 105(9), 24-26. DOI: 10.1117/12.766785
Christoffersson, J. (2004). Evaluation of Systematic and Colour Print Mottle, Master’s Thesis, Linkoping University, Norrköping, Sweden.
Dube, M., Mairesse, F., Boisvert, J. P., and Voisin, Y. (2005). “Wavelet analysis of print mottle,” IEEE Transactions on Image Processing (http://www.uqtr.ca/~dubma/double.pdf ).
Eid, A. H., Ahmed, M. N., Cooper, B. E., and Rippetoe, E. E. (2011). “Characterization of electrophotographic print artifacts: Banding, jitter, and ghosting,” IEEE Transactions on Image Processing 20(5), 1313-1326. DOI: 10.1109/TIP.2010.2092511
Fahlcrantz, C. M., and Johansson, P. A. (2004). “A comparison of different print mottle evaluation models,” in: 56th Annual Technical Conference of the Technical Association of the Graphic Arts, San Antonio, USA, pp. 511-525.
Fahlcrantz, C. M., Johansson, P. Å., and Åslund, P. (2003). “The influence of mean reflectance on perceived print mottle,” Journal of Imaging Science and Technology 47(1), 54-59.
Jansen, M. (2012). “Noise reduction by wavelet thresholding,” in: Lecture Notes in Statistics, Springer New York (Vol. 161), New York, pp. 9-45. DOI: 10.1007/978-1-4613-0145-5ISO 13660 (2001). “Information Technology – Office Equipment – Measurement of image quality attributes – Binary Monochrome text and graphic images,” International Organization for Standardization and International Electrotechnical Commission, Geneva, Switzerland.
Liu, G. D., Zhang, M. Y., and Liang, Q. P. (2012). “Study on the assessment method of print mottle using discrete wavelet analysis,” in: Applied Mechanics and Materials (Vol. 262), Trans Tech Publications, Pfaffikon, Switzerland, pp. 177-180. DOI: 10.4028/www.scientific.net/AMM.262.177
Mallat, S., and Zhong, S. (1992). “Characterization of signals from multiscale edges,” IEEE Transactions on Pattern Analysis & Machine Intelligence 14(7), 710-732.
Preston, J., Hiorns, A. G., Elton, N., and Strom, G. (2008). “Application of imaging reflectometry to studies of print mottle on commercially printed coated papers,” Tappi Journal 7(1), 11-18.
Reis, M. S., and Bauer, A. (2009). “Wavelet texture analysis of on-line acquired images for paper formation assessment and monitoring,” Chemometrics and Intelligent Laboratory Systems 95(2), 129-137. DOI:10.1016/j.chemolab.2008.09.007
Ridgway, C. J., and Gane, P. A. (2003). “Bulk density measurement and coating porosity calculation for coated paper samples,” Nordic Pulp and Paper Research Journal 18(1), 24-31.
Rosenberger, R. R. (2001). “Stochastic frequency distribution analysis as applied to ink jet print mottle measurement,” in: NIP & Digital Fabrication 2001 Conference, Ft. Lauderdale, FL, USA, pp. 808-812(5).
Rosenberger, R. R., and Verity, I. A. (2003). “Stochastic frequency distribution analysis as applied to mottle measurement,” Verity IA LLC, Verity Multifunction, Oshkosh.
Schoelkopf, J., Gane, P. A. C., Ridgway, C. J., Spielmann, D. C., and Matthews, G. P. (2001). “Rate of vehicle removal from offset inks: A gravimetric determination of the imbibition behaviour of pigmented coating structures,” in: TAPPI 2001 Advanced Coating Fundamentals Symposium Proceedings, San Diego, CA, pp. 1-18.
Van Gilder, R. L., and Purfeerst, R. D. (1994). “Latex binder modification to reduce coating pick on six-color offset presses,” TAPPI Journal 1(77), 230-239.
Zhang, D.F. (2008). Wavelet Analysis and Engineering Application, National Defense Industry Press, Beijing, China.
Zhang, D.F. (2009). Wavelet Analysis using MATLAB, China Machine Press, Beijing, China.
Article submitted: May 25, 2016; Peer review completed: August 13, 2016; Revised version received and accepted: September 13, 2016; Published: September 26, 2016.
DOI: 10.15376/biores.11.4.9649-9660