
Abstract
This paper applies a corporate accounting standard approach for measuring greenhouse gas emissions for a particular entity, the GHG Protocol, for a specific type of company in the primary sector. The main goal was to measure the total carbon footprint and carbon balance of the School Forest Enterprise of the Czech University of Life Sciences Prague. The total carbon footprint for Scope 1, Scope 2, and Scope 3 of the forestland managed by the SFE in 2017 was 686 t CO2-eq or 3.5 t/employee, and 3.8 CZK/1000 CZK of turnover or 99 kg CO2-eq/ha. These findings suggested a specific role of forest management in terms of climate change, where, in contrast with other companies in the secondary and tertiary spheres, the sinks outweigh the greenhouse gas production.
Download PDF
Full Article
Carbon Footprint Measurement and Management: Case Study of the School Forest Enterprise
Pavla Kubová,a,* Miroslav Hájek,b and Viktor Třebický,c
This paper applies a corporate accounting standard approach for measuring greenhouse gas emissions for a particular entity, the GHG Protocol, for a specific type of company in the primary sector. The main goal was to measure the total carbon footprint and carbon balance of the School Forest Enterprise of the Czech University of Life Sciences Prague. The total carbon footprint for Scope 1, Scope 2, and Scope 3 of the forestland managed by the SFE in 2017 was 686 t CO2-eq or 3.5 t/employee, and 3.8 CZK/1000 CZK of turnover or 99 kg CO2-eq/ha. These findings suggested a specific role of forest management in terms of climate change, where, in contrast with other companies in the secondary and tertiary spheres, the sinks outweigh the greenhouse gas production.
Keywords: Carbon footprint; Climate change; Forestry enterprise; Life cycle sustainability assessment
Contact information: a: Department of Forestry and Wood Economics, Czech University of Life Sciences Prague, Kamýcká 129, 165 00 Praha 6 – Suchdol, Czech Republic; b: Department of Forestry Technologies and Construction, Czech University of Life Sciences Prague, Kamýcká 129, 165 00 Praha 6 – Suchdol, Czech Republic; c: CI2, Jeronýmova 337/6, 252 19 Rudná, Czech Republic;
* Corresponding author: kubova@fld.czu.cz
INTRODUCTION
Global climate change is considered to be one of the most serious environmental problems that man is currently facing, and therefore environmental considerations are an important factor in justifying industrial decisions (Schramm 1998; Mirasgedis et al. 2008; Samarakoon and Gudmestad 2011). Global climate change is defined as the long-term variation in the climatic parameters, such as the temperatures, precipitation, and wind velocities, from the averages and trends that have characterized the planet since the early 20thcentury (Kräuchi 1993). The causes of climate change are divided into astronomical, natural, and anthropogenic influences (Barros 2006; Eitzinger et al. 2010; Mondal et al. 2014). According to Stocker et al. (2013), the anthropogenic impact is the most important factor behind global climate change at a certainty of 95%, as has been confirmed by many studies, such as Matondo et al. (2004). Anthropogenic greenhouse gases include carbon dioxide (CO2), methane (CH4), nitrous oxide (N2O), ground-level ozone, and chlorofluorocarbons (Houghton 1998; Joos and Spahni 2008; Indira and Srividya 2012; Plummer et al. 2017). Although the Intergovernmental Panel on Climate Control is widely recognized as an impartial advisory forum (Honkasalo et al. 2005), some experts have a different opinion and have expressed doubts about the quality of the analyzed data and the possibility of deriving valid conclusions about the influence of man on global warming (Jaworowski 1994; Soon et al. 2004; McKitrick 2005; Klaus 2007; Pielke Sr. et al. 2007; Michaels 2008).
The main cause of greenhouse gases being released into the atmosphere is human activity (Matondo et al. 2004; Kampen 2011; Plummer et al. 2017), which leads to increasing concentrations of these gases that affect the radiation balance of Earth. During the period before the Industrial Revolution (around 1750), the CO2 and other greenhouse gas concentrations were 270 ppm to 280 ppm. These concentrations have increased and were 405 ppm in 2017 (National Oceanic and Atmospheric Administration 2017), which is an increase of 47%. In addition to the greenhouse gas concentrations, the annual growth dynamics are also increasing. It is already certain that the atmospheric CO2 concentration of today is the highest it has been in the last 2.1 million years (Hönisch et al. 2009). The largest source of emissions is global fossil fuel burning, which grew from 6.8 PgC in 2001 to 9.8 PgC in 2015 (National Oceanic and Atmospheric Administration 2017). Another major source of emissions is deforestation and natural fires (Smith et al. 1993), which account for approximately one fifth of the global emissions. The biggest emission sinks are the oceans (absorbed 1.8 PgC/year to 2.9 PgC/year) and terrestrial vegetation (2.8 PgC/year to 5.0 PgC/year). Thus, 4 PgC to 6 PgC of emissions remain in the atmosphere each year. The research conducted by Gifford (1994) shows that non-deforested terrestrial ecosystems store 2.5 GtC/year ± 2.7 GtC/year.
Climate change strategies include a variety of instruments. In addition to trading in greenhouse gas emissions and environmental taxes, there are also voluntary instruments. Currently, one of the most used voluntary instruments is the carbon footprint, which is an indicator designed to account for the five dimensions of the sustainable development concept (Janoušková et al. 2017). The direct carbon footprint is the amount of greenhouse gas emissions immediately released during a given activity. The indirect carbon footprint is the amount of greenhouse gas emissions released throughout the product life cycle, from production to disposal. Some examples include the emissions associated with building construction, building materials, and automobile production. Wiedmann and Minx (2007) defined the carbon footprint as the emissions of CO2, which are caused directly and indirectly by an activity during the lifecycle of a product. Tjandra et al. (2016) observed that most activities may also emit other greenhouse gases, and the carbon footprint definition should be extended to account for these gases. The term carbon dioxide equivalent (CO2-eq) is commonly used in carbon footprint assessments. It is very difficult to set it at a macro level (Lupač et al.2012). A carbon footprint assessment may be based on various governing international standards and methods of calculation (Pandey et al. 2011). Several studies have employed various methods of assessments, such as a Life Cycle Assessment (Filimonau et al. 2011; Shirley et al. 2012; Onat et al. 2014; Chan et al. 2015; An and Xue 2017).
A clear interpretation of results with regards to the environmental problem it describes (global climate change) is an indisputable advantage of this indicator (Kapitulčinová 2017). The carbon footprint is undoubtedly of great importance in forest management (Logan 1997; Sampson and Sedjo 1997). In addition to the potential for carbon trading because of carbon sequestration, there is also remarkable greenhouse gas production during forest operations. Nave et al. (2010) reported the existence of changes in the carbon storage of forestland because of the influence of timber felling. Felling reduces the carbon content in the soil by about 8%, and the overall carbon content in the soil is reduced by almost 30% because of timber harvesting. A lesser influence was observed in mixed and coniferous forests (Nave et al. 2010). This release of carbon is alarming because of deforestation, which can emit as much as 200 million t C/year (Nepstad et al. 2001). During forest extraction, not only carbon storage is decreased, but so is potassium storage, which can be reduced by up to 40% (Duchesne and Houle 2008). A life cycle sustainability assessment is one of the most common methods for assessing the sustainability of products and processes. It consists of three methods: life cycle assessment, life cycle costing, and social life cycle assessment (Neugebaurer et al. 2015). Within the ecological footprint methodology, the carbon footprint is defined as the regenerative forest capacity required for sequestering CO2 emissions not absorbed by oceans (Mancini et al. 2016). To calculate the carbon footprint, the forest area needed to absorb CO2 emissions from burning a given quantity of fossil fuels is used (Rázgová et al. 2007). The problem is that forests are included as special category areas for carbon absorption. Thomas et al. (2010) showed in their study that increased human nitrogen decomposition can stimulate forests and increase carbon sequestration. An important parameter of the carbon footprint is the Average Forest Carbon Sequestration (AFCS), which is calculated from the net carbon sequestration capacity of forest ecosystems. According to Wang et al. (2008), a source of CO2 was also recorded in a forest just after a disruption, especially felling, fire, etc. The largest share of stored carbon was found to be in growing and mature forests. Carbon dioxide emissions in forest harvesting operations are influenced by the terrain conditions, wood species, management methods, performance of the operators, and machinery limitations (Van Belle 2006; González-García et al. 2009a; González-García et al. 2009b; Kärhä 2011; Vusić et al. 2013; Alam et al. 2014). Based on the carbon footprint and identification of the mitigation measures, it is possible to focus on energy independence and rational use of renewable resources on site. Depending on the carbon footprint, these measures lead to improved air quality. The determination of the carbon footprint is a basis for deciding the mitigation measures, which are measures for reducing greenhouse gas emissions (de Figueiredo et al. 2017), that should be applied. The carbon footprint is usable in the transfer of values, principles, and rules for climate protection from global to national, regional, and local levels.
With an increase in the mechanization of forest operations, it can be expected that emissions could increase (Athanassiadis 2000), even though forestry activities do not tend to emit vast amounts of greenhouse gases. In any case, the innovation and modernization of forestry operations require regular monitoring of the carbon footprint and its ongoing correction. The main objective of this paper was to measure the total carbon footprint and carbon balance of the School Forest Enterprise of the Czech University of Life Sciences Prague.
EXPERIMENTAL
Materials
This study combined two approaches to measure anthropogenic impacts on global climate change, which are usually separate. The first approach is a corporate accounting standard approach for measuring greenhouse gas emissions for a particular entity, which is called the GHG Protocol. The second approach is an ecosystem approach that attempts to measure the overall carbon balance of a particular territory. The combination of these two approaches results in interesting comparisons and is new within a broader spectrum of studies on carbon footprinting in the timber industry (Kutnar and Hill 2014).
The School Forest Enterprise (SFE) in Kostelec nad Černými lesy is a university forest estate operated by the Czech University of Life Sciences Prague (CULS). The main activities of the SFE are to provide practice and exercises for students, and support specialized works and research tasks. The main timber product of the SFE is a more sustainable building material than many other materials (Sathre and O’Connor 2010). More than 4000 students every year pass by the SFE. The current size of the managed area is about 6900 ha. The enterprise tries to apply low impact forest management, promote natural regeneration wherever possible, and exploit the shelterwood system to a maximum extent. Timber handling is performed by the timber transport and handling center with a depot of sufficient capacity to store the required volume of logs, which takes into account the after-processing yield efficiency. Timber production is done by the woodworking center. Another operational unit of the SFE is the center of ornamental and forest nursery. This center produces over 2 million seedlings of more than 500 species and 2000 cultivars of ornamental trees each year. The basic characteristics of the SFE are shown in Table 1.
Table 1. Basic Characteristics of the SFE CULS in 2017

Methods
The procedure for calculating the carbon footprint of products is given by the Technical Specification, which is stated in ISO Standard 14067:2013. The standard contains details of the principles, requirements, and guidelines for quantification. ISO 14067:2013 addresses only one impact category – climate change. Great attention must be paid to using the right unit and order. If the input data is given in units other than the emission factor, it is necessary to convert the input data to the corresponding unit and order. The calculation is performed in the first phase separately for each relevant greenhouse gas. Subsequently, these emissions are recalculated according to their contribution to global climate change to the so-called equivalent carbon dioxide emissions (CO2-eq). This parameter represents the final carbon footprint of an enterprise.
The calculation of the greenhouse gas emissions produced by the SFE CULS was performed in accordance with the GHG Protocol (Daviet and Ranganathan 2005). The activity data (Table 2) was multiplied by the corresponding emission factors (Table 3). If needed, the input activity data was converted to the required unit and order. The calculation was done separately for the emissions of individual greenhouse gases.
Three out of the seven obligatory greenhouse gases, CO2, CH4, and N2O, were converted to CO2-eq emissions according to their contribution to global climate change (global warming potential, GWP; Table 4). For benchmarking purposes, the resulting indicator is related to the turnover of the enterprise, number of employees, and production of wood. This calculation uses Eqs. 1 and 2:

where ADix is the activity data for item i and greenhouse gas x, EFixis the emission factor for item i and greenhouse gas x, CFix is the carbon footprint for item i and greenhouse gas x, GWPx is the contribution to climate change by greenhouse gas x, and CF CO2-eqis the carbon footprint (greenhouse gas emissions) expressed in CO2-eq.
Table 2. Activity Data of the SFE CULS in 2017

Table 3. Emission Factors

Table 4. Global Warming Potential (100-year horizon)

Emissions were divided according to their type into three areas, which are called Scopes and are shown in Fig. 1. Scope 1 includes the direct emissions into the air from activities that occur under the entity (e.g. emissions from boilers in the office, owned cars, and waste eliminated within an enterprise). Scope 2 contains the indirect emissions from purchased energy that do not flow directly into buildings and plants, but are the result of activities (e.g. electricity, heat, and steam purchases). Scope 3 consists of other indirect issues, namely emissions that are the result of business activities, but are not classified within Scope 2 (e.g. purchase of goods and services, business trips, landfilling, etc.).
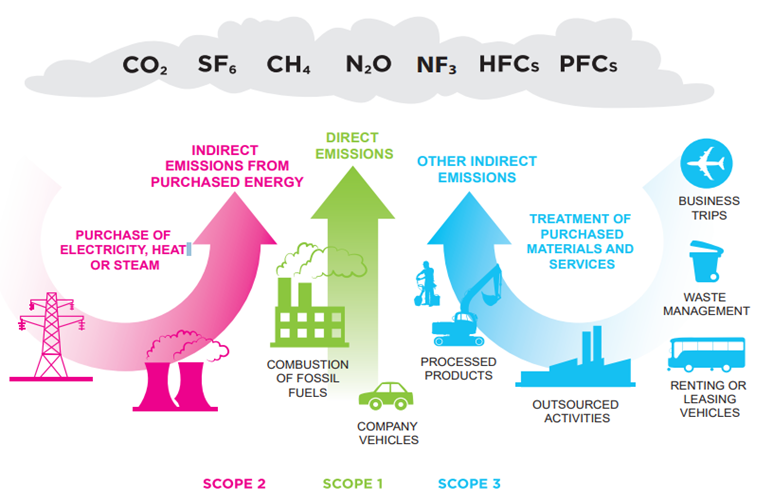
Fig. 1. GHG Protocol carbon footprint
System boundaries
For the purposes of this study, two levels of system boundaries were defined. The first, at the enterprise level, was defined by the boundaries of the SFE operational control center. Of the nine centers of the company, only three centers were included for reasons of data availability. The activities included the production of seedlings, handling of these seedlings and their planting, tending of forest stands, logging, and conversion of wood. The sales of wood, its further use, and end-of-life products were not included. The carbon footprint of the production, maintenance, and disposal of the machines and other technologies that are used in the SFE, i.e. indirect carbon footprint, were not included. To make the study clear and avoid useless calculations, the authors decided to adopt a cut-off criterion. This criterion excluded all of the components of the system and the processes with an incidence lower than 5% with respect to a ton of input materials from the material sum calculation.
The second level of system boundaries is managed forest land of SFE with total area of 6900 ha. These are the forests of the temperate zone with a predominance of spruce and beech. They enter the total carbon balance of the SFE and its economy for one year (change of carbon stocks). The negligible carbon stock in forest land was not included in this analysis.
Carbon balance of the area
To determine the change of carbon stocks the territory on which SFE operates was used GHG Guidance for The Land Use, Land-Use Change, and Forestry Guidance (WRI 2006). The balance sheet is based on the current status of forest management in the given area and published data. This included a study of the carbon stock in forest stands in the Czech Republic and a study of the carbon cycle between the forest ecosystem and atmosphere (Marek 2011). These studies contained data not only about inventories, fossils, and resources, but also their classification according to ecosystem units and natural forest areas. Carbon balance is limited to 1 year for the purposes of this article as well as the carbon footprint of the company. The production and carbon removals sides are therefore comparable. For a longer period of time, one of the dynamic carbon accounting frameworks and models would have to be used.
RESULTS AND DISCUSSION
By converting the activity data (listed in Table 2) to corresponding greenhouse gas emissions, it was found that the total greenhouse gas emissions were predominately caused by electricity consumption, which was mainly used in woodworking (56%). The fuel consumption (diesel) by machines and cars in the SFE (37% of greenhouse gas emissions) was also important. The indirect emissions associated with the use of chemical agents for the protection of trees and seedlings and the consumption of wire fencing were less important. The aggregate results are shown in Tables 5 and 6 and Figs. 2 and 3. As to individual production phases in the forestry enterprise involved in the calculation, timber production and processing were the dominant causes of greenhouse gas production (98%). The production of seeds, their transport, and planting had a far lower impact.
Table 5. Carbon Footprint Results of the SFE CULS in 2017


Fig. 2. Carbon footprint of the SFE CULS in 2017; Total emissions = 686 t CO2-eq according to the scopes

Fig. 3. Composition according to the input items; Total emissions = 686 t CO2-eq according to the scopes
Because of the lack of data, it was not possible to include all sub-classes of indirect emissions Scope 3 (e.g. emissions from machinery assets). The actual total value of indirect emissions is likely to be higher. Improvement of Scope 3 emissions from a forestry enterprise is possible to focus on further research.
Table 6. Carbon Footprint Results of the SFE CULS in 2017 and Composition According to the Production Phases

The absolute results of the carbon footprint of the SFE can be normalized (i.e. converted to comparable values relative to a common denominator and compared with similar enterprises at the next stage) and are given Table 7.
Table 7. Carbon Footprint Benchmarking

CF – carbon footprint; S1 – scope 1; S2 – scope 2
There have been a large number of studies with similar calculations, where the carbon footprint was calculated at different levels. Alvares et al. (2014) determined the carbon footprint to be 1.9 tons CO2-eq per student at the School of Forestry Engineering, Technical University of Madrid using a method based on financial accounts.
Carbon Balance
For the next part of the results, a rough overall carbon balance of the 6900 ha area covered mainly by forest managed by the SFE using the Land Use, Land-Use Change, and Forestry Guidance for GHG Project Accounting (WRI 2006). Carbon footprint and carbon removals are on an annual basis. Change of forest carbon stock consists of extraction of timber and growth of new biomass for 1 year. The next step compares carbon removals per year (growth minus extraction) with carbon footprint of SFE per year. This gives the net carbon balance per year of the territory and the business, removals outweighs production.
Table 8. CO2 Balance

CONCLUSIONS
- This study brings the overall GHG balance for School Forest Enterprise of the Czech University of Life Sciences Prague according to the standards GHG Protocol. It combines the GHG gas production side (especially CO2) – carbon footprint of SFE and GHG removals during one year of forest management.
- The total carbon footprint for Scope 1, Scope 2, and Scope 3 of the forestland managed by the SFE in 2017 was 686 t CO2-eq or 3.5 t/employee, and 3.8 CZK/1000 CZK of turnover or 99 kg CO2-eq/ha. The largest contributing share to the carbon footprint (56%) was the electricity consumption, which corresponded with other research findings (García-Durañona et al. 2016; Hussain et al. 2017).
- In contrast, the total amount of C or CO2 removals was much higher. The increase in forests, where the SFE operates, exceeds mining, the tree growth removes CO2 from the atmosphere due to sequestration (9.9 t/CO2/ha/year). On the other hand, the carbon footprint of the SFE is only 0.1 t/CO2/ha/year.
- The overall carbon balance of this company and its forests was therefore noticeably favorable. The findings suggested a specific role of forest management in climate change, where, in contrast with other enterprises in the secondary and tertiary spheres, the sinks may outweigh the production of greenhouse gases.
- The main timber product of the SFE is a more sustainable building material than many other materials. This analysis showed that the contribution of forestry to CO2 assimilation is far greater than the greenhouse gas production from silviculture and timber conversion itself. This was consistent with the findings of Sathre and O’Connor (2010), which was a meta-analysis of 21 international studies of wood substitution and found an average displacement factor of 2.1 t CO2 emissions/t C in the wood products used in place of non-wood materials.
- With regards to the requirements for the reduction of emissions, it can be assumed that the overall emissions of the activities of the SFE will decrease in the future. Modeling for 2030 showed that replacing current conventional electricity (i.e. 50% fossil) with a carbon-free option (so-called green electricity) is the most effective way to reduce the carbon footprint of the SFE. This would result in a virtually immediate reduction of 56% in the overall carbon footprint. A less efficient and more long-term option would be reducing the electricity consumption by 2%/year. This would result in a SFE carbon footprint reduction of 14.5% by 2030. A similar result could be obtained with a fuel consumption reduction of 3%/year. Replacement of the current fences with a low-carbon material would reduce the carbon footprint by 1%.
- It was concluded that even though the carbon balance of the enterprise is favorable as is, an absolute reduction of the emission burden is feasible. The most promising measure in this respect is the use of carbon-free electricity, which is produced from renewable sources. If it were used not only for the illumination and heating of the SFE facilities, but also in mobile machines (sawmills, cars, harvesters, etc.) to replace diesel (i.e. introduction of electric drives), a carbon footprint reduction of 93% could be achieved, which would meet the Paris Convention requirements for the mid-21st century.
ACKNOWLEDGMENTS
The authors are grateful for the support from the IGA (Project No. B08/17).
REFERENCES CITED
Alam, M., Walsh, D., Strandgard, M., and Brown, M. (2014). “A log-by-log productivity analysis of two Valmet 475EX harvesters,” International Journal of Forest Engineering 25(1), 14-22. DOI: 10.1080/14942119.2014.891668
An, J., and Xue, X. (2017). “Life-cycle carbon footprint analysis of magnesia products,” Resour. Conserv. Recy. 119, 4-11. DOI: 10.1016/j.resconrec.2016.09.023
Athanassiadis, D. (2000). “Energy consumption and exhaust emissions in mechanized timber harvesting operations in Sweden,” Sci. Total Environ. 255(1-3), 135-143. DOI: 10.1016/S0048-9697(00)00463-0
Barros, V. (2006). Global Climate Change [Globální Změna Klimatu], Mladá fronta, Prague, Czech Republic.
Chan, Y. H., Yusup, S., Quitain, A. T., Tan, R. R., Sasaki, M., Lam, H. L., and Uemura, Y. (2015). “Effect of process parameters on hydrothermal liquefaction of oil palm biomass for bio-oil production and its life cycle assessment,” Energ. Convers. Manage. 104, 180-188. DOI: 10.1016/j.enconman.2015.03.075
CHMI (2017). National Greenhouse Gas Inventory Report of the Czech Republic (Reported Inventories 1990-2014), Czech Hydrometeorological Institute (CHMI), Prague, Czech Republic.
Daviet, F., and Ranganathan, J. (2005). The Greenhouse Gas Protocol: The GHG Protocol for Project Accounting, World Business Council for Sustainable Development, Geneva, Switzerland.
de Figueiredo, E. B., Jayasundara, S., de Oliveira Bordonal, R., Berchielli, T. T., Reis, R. A., Wagner-Riddle, C., and La Scala Jr., N. (2017). “Greenhouse gas balance and carbon footprint of beef cattle in three contrasting pasture-management systems in Brazil,” J. Clean. Prod. 142, 420-431. DOI: 10.1016/j.jclepro.2016.03.132
Duchesne, L., and Houle, D. (2008). “Impact of nutrient removal through harvesting on the sustainability of the boreal forest,” Ecol. Appl. 18(7), 1642-1651. DOI: 10.1890/07-1035.1
Eitzinger, J., Orlandini, S., Stefanski, R., and Naylor, R. E. L. (2010). “Climate change and agriculture: Introductory editorial,” J. Agr. Sci. 148(5), 499-500. DOI: 10.1017/S0021859610000481
Envimat (2017). “Methodology of envimat,” (http://envimat.cz/metodika/), Accessed 15 December 2017.
Filimonau, V., Dickinson, J., Robbins, D., and Huijbregts, M. A. J. (2011). “Reviewing the carbon footprint analysis of hotels: Life Cycle Energy Analysis (LCEA) as a holistic method for carbon impact appraisal of tourist accommodation,” J. Clean. Prod. 19(17-18), 1917-1930. DOI: 10.1016/j.jclepro.2011.07.002
García-Durañona, L., Farreny, R., Navarro, P., and Boschmonart-Rives, J. (2016). “Life cycle assessment of a coniferous wood supply chain for pallet production in Catalonia, Spain,” J. Clean. Prod. 137, 178-188. DOI: 10.1016/j.jclepro.2016.07.032
Gifford, R. M. (1994). “The global carbon cycle: A viewpoint on the missing sink,” Funct. Plant Biol. 21(1), 1-15. DOI: 10.1071/PP9940001
González-García, S., Berg, S., Feijoo, G., and Moreira, M. T. (2009a). “Environmental impacts of forest production and supply of pulpwood: Spanish and Swedish case studies,” Int. J. Life Cycle Ass.14(4), 340-353. DOI: 10.1007/s11367-009-0089-1
González-García, S., Berg, S., Moreira, M. T., and Feijoo, G. (2009b). “Evaluation of forest operations in Spanish eucalypt plantations under a life cycle assessment perspective,” Scand. J. Forest Res. 24(2), 160-172. DOI: 10.1080/02827580902773462
Hönisch, B., Hemming, N. G., Archer, D., Siddall, M., and McManus, J. F. (2009). “Atmospheric carbon dioxide concentration across the mid-Pleistocene transition,” Science 324(5934), 1551-1554. DOI: 10.1126/science.1171477
Honkasalo, N., Rodhe, H., and Dalhammar, C. (2005). “Environmental permitting as a driver for eco-efficiency in the dairy industry: A closer look at the IPPC directive,” J. Clean. Prod. 13(10-11), 1049-1060. DOI: 10.1016/j.jclepro.2004.12.016
Houghton, J. T. (1998). Global Warming [Globální Oteplování], Academia, Prague, Czech Republic.
Hussain, M., Malik, R. N., and Taylor, A. (2017). “Carbon footprint as an environmental sustainability indicator for the particleboard produced in Pakistan,” Environ. Res. 155, 385-393. DOI: 10.1016/j.envres.2017.02.024
Indira, D., and Srividya, G. (2012). “Reducing the livestock related green house gases emission,” Veterinary World 5(4), 244-247. DOI: 10.5455/vetworld.2012.244-247
IPCC (2013). Climate Change 2013: The Physical Science Basis. Contribution of Working Group I to the Fifth Assessment Report of the Intergovernmental Panel on Climate Change, Ch.8, p. 711–714, Table 8.7.
ISO 14067:2013: “Greenhouse gases – Carbon footprint of products – Requirements and guidelines for quantification and communication”.
Janoušková, S., Moldan, B., and Hák, T. (2017). “Five key sustainable development indicators: A tool for public education and awareness raising,” Envigogika 12(1). DOI: 10.14712/18023061.536
Jaworowski, Z. (1994). “Ancient atmosphere – Validity of ice records,” Environ. Sci. Pollut. R. 1(3), 161-171. DOI: 10.1007/BF02986939
Joos, F., and Spahni, R. (2008). “Rates of change in natural and anthropogenic radiative forcing over the past 20,000 years,” P. Natl. Acad. Sci. USA 105(5), 1425-1430. DOI: 10.1073/pnas.0707386105
Kampen, J. K. (2011). “A methodological note on the making of causal statements in the debate on anthropogenic global warming,” Theor. Appl. Climatol. 104(3-4), 423-427. DOI: 10.1007/s00704-010-0355-y
Kapitulčinová, D. (2017). “Environmetal footprint calculators for food in education and an introduction of nutritional footprint as a tool for supporting sustainable food consumption,” Envigogika 12(2). DOI: 10.14712/18023061.553
Kärhä, K. (2011). “Industrial supply chains and production machinery of forest chips in Finland,” Biomass Bioenerg. 35(8), 3404-3413. DOI: 10.1016/j.biombioe.2010.11.016
Klaus, V. (2007). Blue, Not Green Planet: What’s at Risk: Climate, or Freedom? [Modrá, Nikoli Zelená Planeta: Co je Ohroženo: Klima, nebo Svoboda?], Dokořán, Prague, Czech Republic.
Kräuchi, N. (1993). “Potential impacts of a climate change on forest ecosystems,” Forest Pathol. 23(1), 28-50. DOI: 10.1111/j.1439-0329.1993.tb00804.x
Kutnar, A., and Hill, C. (2014). “Assessment of carbon footprinting in the wood industry,” in: Assessment of Carbon Footprint in Different Industrial Sectors Volume 2, S. S. Muthu (ed.), Springer Singapore, Singapore, Singapore, pp. 135-172.
Logan, T. J. (1997). Economics of Carbon Sequestration in Forestry(Vol. 26), CRC Press, Boca Raton, FL.
Lupač, M., Novák, J., and Třebický, V. (2012). The Town of Chrudim – Case Study. Cities and Climate Change – Carbon Footprint of Towns as a Tool of Climate Protection Policy at the Local Level of the Czech Republic [Město Chrudim – Případová Studie. Města a Klimatická Změna – Uhlíková Stopa Měst Jako Nástroj Politiky Ochrany Klimatu na Místní Úrovni ČR], TIMUR, Prague, Czech Republic.
Mancini, M. S., Galli, A., Niccolucci, V., Lin, D., Bastianoni, S., Wackernagel, M., and Marchettini, N. (2016). “Ecological footprint: Refining the carbon footprint calculation,” Ecol. Indic. 61, 390-403. DOI: 10.1016/j.ecolind.2015.09.040
Marek, M. V. (2011). Carbon in Ecosystems of the Czech Republic in a Changing Climate [Uhlík v Ekosystémech České Republiky v Měnícím se Klimatu], Academia, Prague, Czech Republic.
Matondo, J. I., Peter, G., and Msibi, K. M. (2004). “Evaluation of the impact of climate change on hydrology and water resources in Swaziland: Part I,” Phys. Chem. Earth, Parts A/B/C 29(15-18), 1181-1191. DOI: 10.1016/j.pce.2004.09.033
McKitrick, R. (2005). “Is the climate really changing abnormally?,” Fraser Forum.
Michaels, P. J. (2008). “Global warming: Correcting the data,” Regulation 31(3), 46-52.
Mirasgedis, S., Hontou, V., Georgopoulou, E., Sarafidis, Y., Gakis, N., Lalas, D. P., Loukatos, A., Gargoulas, N., Mentzis, A., Economidis, D., et al. (2008). “Environmental damage costs from airborne pollution of industrial activities in the greater Athens, Greece area and the resulting benefits from the introduction of BAT,” Environ. Impact Asses. 28(1), 39-56. DOI: 10.1016/j.eiar.2007.03.006
Mondal, S., Panda, D., Anyatullah, and Bose, B. (2014). “Experimental strategies presenting a holistic view regarding heat stress in plants,” International Journal of Bio-Resource and Stress Management 5(3), 444-460. DOI: 10.5958/0976-4038.2014.00596.X
National Oceanic and Atmospheric Administration (2017). “CarbonTracker CT2016,” Earth System Research Laboratory, (https://www.esrl.noaa.gov/gmd/ccgg/carbontracker/), Accessed 29 January 2018.
Nave, L. E., Vance, E. D., Swanston, C. W., and Curtis, P. S. (2010). “Harvest impacts on soil carbon storage in temperate forests,” Forest Ecol. Manag. 259(5), 857-866. DOI: 10.1016/j.foreco.2009.12.009
Nepstad, D., Carvalho, G., Barros, A. C., Alencar, A., Capobianco, J. P., Bishop, J., Moutinho, P, Lefebvre, P, Silva Jr., U. L., and Prins, E. (2001). “Road paving, fire regime feedbacks, and the future of Amazon forests,” Forest Ecol. Manag. 154(3), 395-407. DOI: 10.1016/S0378-1127(01)00511-4
Onat, N. C., Kucukvar, M., and Tatari, O. (2014). “Scope-based carbon footprint analysis of U.S. residential and commercial buildings: An input–output hybrid life cycle assessment approach,” Build. Environ. 72, 53-62. DOI: 10.1016/j.buildenv.2013.10.009
Pandey, D., Agrawal, M., and Pandey, J. S. (2011). “Carbon footprint: Current methods of estimation,” Environ. Monit. Assess. 178(1-4), 135-160. DOI: 10.1007/s10661-010-1678-y
Pielke Sr., R., Nielsen-Gammon, J., Davey, C., Angel, J., Bliss, O., Doesken, N., Cai, M., Fall, S., Niyogi, D., Gallo, K., et al. (2007). “Documentation of uncertainties and biases associated with surface temperature measurement sites for climate change assessment,” B. Am. Meteorol. Soc. 88(6), 913-928. DOI: 10.1175/BAMS-88-6-913
Plummer, S., Lecomte, P., and Doherty, M. (2017). “The ESA Climate Change Initiative (CCI): A European contribution to the generation of the Global Climate Observing System,” Remote Sens. Environ. 203, 2-8. DOI: 10.1016/j.rse.2017.07.014
Rázgová, E., Třebický, V., and Novák, J. (2007). Ecological Footprint – Can You Treat Your Steps? [Ekologická Stopa – Unese Země Vaše Kroky?], Ústav pro Ekopolitiku, o.p.s., Prague, Czech Republic.
Samarakoon, S. M. K., and Gudmestad, O. T. (2011). “The IPPC directive and technique qualification at offshore oil and gas installations,” J. Clean. Prod. 19(1), 13-20. DOI: 10.1016/j.jclepro.2010.08.014
Sampson, R. N., and Sedjo, R. A. (1997). “Economics of carbon sequestration in forestry: An overview,” Crit. Rev. Env. Sci. Tec.27(S1), 1-8. DOI: 10.1080/10643389709388506
Sathre, R., and O’Connor, J. (2010). “Meta-analysis of greenhouse gas displacement factors of wood product substitution,” Environ. Sci. Policy 13(2), 104-114. DOI: 10.1016/j.envsci.2009.12.005
Schramm, W. (1998). “Possibilities and limitations of a comparative assessment of process technologies from a cleaner production point of view,” J. Clean. Prod. 6(3-4), 227-235. DOI: 10.1016/S0959-6526(98)00017-1
Shirley, R., Jones, C., and Kammen, D. (2012). “A household carbon footprint calculator for islands: Case study of the United States Virgin Islands,” Ecol. Econ. 80, 8-14. DOI: 10.1016/j.ecolecon.2012.04.027
Smith, T. M., Cramer, W. P., Dixon, R. K., Leemans, R., Neilson, R. P., and Solomon, A. M. (1993). “The global terrestrial carbon cycle,” Water Air Soil Poll. 70(1-4), 19-37. DOI: 10.1007/BF01104986
Soon, W. W.-H., Legates, D. R., and Baliunas, S. L. (2004). “Estimation and representation of long-term (>40 year) trends of Northern-Hemisphere-gridded surface temperature: A note of caution,” Geophys. Res. Lett. 31(3). DOI: 10.1029/2003GL019141
Stocker, T. F., Qin, D., Plattner, G.-K., Tignor, M. M. B., Allen, S. K., Boschung, J., Nauels, A., Xia, Y., Bex., V., and Midgley, P. M. (2013). Climate Change 2013: The Physical Science Basis (Fifth Assessment Report), Intergovernmental Panel on Climate Change, Geneva, Switzerland.
Thomas, R. Q., Canham, C. D., Weathers, K. C., and Goodale, C. L. (2010). “Increased tree carbon storage in response to nitrogen deposition in the US,” Nat. Geosci. 3, 13-17. DOI: 10.1038/ngeo721
Tjandra, T. B., Ng, R., Yeo, Z., and Song, B. (2016). “Framework and methods to quantify carbon footprint based on an office environment in Singapore,” J. Clean. Prod. 112, 4183-4195. DOI: 10.1016/j.jclepro.2015.06.067
Van Belle, J.-F. (2006). “A model to estimate fossil CO2 emissions during the harvesting of forest residues for energy—with an application on the case of chipping,” Biomass Bioenerg. 30(12), 1067-1075. DOI: 10.1016/j.biombioe.2005.12.019
Vusić, D., Šušnjar, M., Marchi, E., Spina, R., Zečić, Ž., and Picchio, R. (2013). “Skidding operations in thinning and shelterwood cut of mixed stands – Work productivity, energy inputs and emissions,” Ecol. Eng. 61, 216-223. DOI: 10.1016/j.ecoleng.2013.09.052
Wang, Q. F., Wang, C. K., and Tan, L. H. (2008). “Vernal soil respiration of Larix gmelinii Rupr. forests transplanted from a latitudinal transect,” Acta Ecologica Sinica, 28(5), 1883-1892.
Wiedmann, T., and Minx, J. (2007). A Definition of ‘Carbon Footprint’ (Research Report 07-01), ISAUK Research & Consulting, Durham, UK.
WRI. (2006). “The Land Use, Land-Use Change, and Forestry Guidance for GHG Project Accounting,” (http://www.ghgprotocol.org/sites/default/files/ghgp/standards_supporting/LULUCF%20Guidance_1.pdf), Accessed 10 March 2018.
Article submitted: February 2, 2018; Peer review completed: March 11, 2018. Revisions accepted: April 9, 2018; Published: May 1, 2018.
DOI: 10.15376/biores.13.2.4521-4535