
Abstract
Catalytic fast pyrolysis of Alcell lignin with various additive ratios (5%, 10%, and 15%, mass ratio) of nano-NiO was investigated using a horizontal pyrolyzer. Characterization methods, including Fourier transform infrared spectroscopy (FTIR), gas chromatography (GC), gas chromatography coupled with mass spectrometry (GC/MS), and elemental analysis, were utilized to identify the catalytic fast pyrolysis products. The results indicated that the nano-NiO catalyst had remarkable effects on the yield and quality of these products. The formation of gases, especially CO, CO2, and CH4, were greatly promoted when the additive ratio increased, while the formation of bio-char was clearly inhibited. However, when the additive ratio was 10%, the maximum yield of bio-oil (53.09 wt.%) was obtained, and the corresponding maximum higher heating value (HHV) was 25.33 MJ/kg. Furthermore, nano-NiO caused a large variation in the species of the compounds in bio-oil. Operating with the optimal nano-NiO additive ratio (10%), the carbon conversion rate was 65.50%, and the energy conversion rate was 74.53%.
Download PDF
Full Article
Catalytic Fast Pyrolysis of Alcell Lignin with Nano-NiO
Jiao Chen, Chao Liu, and Shu-bin Wu*
Catalytic fast pyrolysis of Alcell lignin with various additive ratios (5%, 10%, and 15%, mass ratio) of nano-NiO was investigated using a horizontal pyrolyzer. Characterization methods, including Fourier transform infrared spectroscopy (FTIR), gas chromatography (GC), gas chromatography coupled with mass spectrometry (GC/MS), and elemental analysis, were utilized to identify the catalytic fast pyrolysis products. The results indicated that the nano-NiO catalyst had remarkable effects on the yield and quality of these products. The formation of gases, especially CO, CO2, and CH4, were greatly promoted when the additive ratio increased, while the formation of bio-char was clearly inhibited. However, when the additive ratio was 10%, the maximum yield of bio-oil (53.09 wt.%) was obtained, and the corresponding maximum higher heating value (HHV) was 25.33 MJ/kg. Furthermore, nano-NiO caused a large variation in the species of the compounds in bio-oil. Operating with the optimal nano-NiO additive ratio (10%), the carbon conversion rate was 65.50%, and the energy conversion rate was 74.53%.
Keywords: Alcell lignin; Catalytic fast pyrolysis; Nano-NiO; Bio-oil
Contact information: State Key Laboratory of Pulp and Paper Engineering, South China University of Technology, Guangzhou, Guangdong 510640, PR China; *Corresponding author: shubinwu@scut.edu.cn
INTRODUCTION
Lignin is one of the main components in lignocellulosic biomass and represents a substantial product stream within pulp mills (Mukkamala et al. 2012). The amount of lignin separated from the pulp and paper industry is up to 50 million tons per year (Gandini and Belgacem 1998). However, more than 95% of the industrial lignin is used as heat energy for combustion, while only a small amount, approximately 5%, is used in chemical production because of the complicated chemical structure (Jin et al. 2009). Lignin primarily consists of guaiacyl propane units, syringyl propane units, and p-hydroxyphenyl propane units, and it has a three-dimensional network structure (Huijgen et al. 2014). A number of active functional groups, such as phenolic hydroxyl, alcoholic hydroxyl, methoxy, and carboxyl groups, leads to the high reactivity of lignin, which can be transported and converted to renewable fuels and valuable products (Lu et al. 2010; Dickerson and Soria 2013).
Pyrolysis, as an efficient method for lignin utilization, can transform lignin into small molecules with aromatic rings. However, the pyrolysis process is extremely complicated because of the complexity of the lignin structure, which is rather difficult to degrade completely. Moreover, the composition of pyrolysis products is multiple and chaotic. Methods for overcoming these defects include pyrolysis reactor modifications (Beis et al. 2010), as well as pyrolysis in the presence of cracking catalysts (Ericsson 1985). In recent decades, metal catalysts have been widely applied to lignin catalytic pyrolysis. The popularity of these metal catalysts arises from their special properties, such as activity, selectivity, and stability (Dickerson and Soria 2013). Via catalysis, the liquid final products can be regarded as a promising replacement of petroleum fuels for energy generation, heat, and the extraction of valuable chemicals (Dong et al. 2003; Xiu and Shahbazi 2012). The activity of nano-NiO used for biomass pyrolysis has been investigated by thermogravimetric analyzer. Nano-NiO was found to have a more effective catalytic effect on biomass pyrolysis than micro-NiO. However, the process of biomass pyrolysis with the addition of nano-NiO was only briefly discussed. In addition, the yield of organic liquid products was not investigated systematically (Li and Pawłowski 2007).
In this study, nano-NiO was implemented into the catalytic fast pyrolysis of Alcell lignin with additive ratios of 5%, 10%, and 15%. The yield and components of catalytic products were comprehensively analyzed to reveal the catalytic capabilities of the various additive ratios of nano-NiO.
EXPERIMENTAL
Materials
Pyrolysis material used in this study was Alcell lignin (abbreviated AL), which was isolated from the Alcell pulping process of triploid poplar (Populus tomentosa Carr.). Moreover, the crude AL was further purified with a mild acidolysis method. According to our previous study (Liu et al. 2015), after purification, the AL achieved the high purity by hydrolysis residual glycans, and the formula of purified AL is C505.87H560.00O158.34N1.01.
The pyrolysis catalyst was nano-NiO, which was purchased from Aladdin Industrial Inc. (Shanghai, China) and used directly without further treatment. Before catalytic fast pyrolysis, the catalyst and AL were dry-mixed with additive mass ratios of 5%, 10%, and 15%. The corresponding samples were denoted AL-5%, AL-10%, and AL-15%.
Apparatus and Procedures
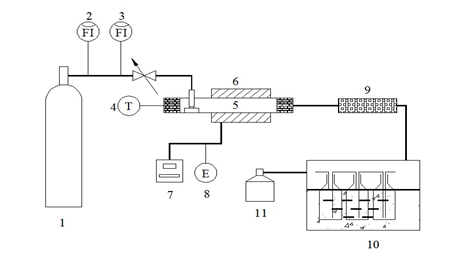
Fig. 1. Schematic diagram of horizontal pyrolyzer: (1) nitrogen bottle, (2) rotameter, (3) rotameter, (4) thermocouple and porcelain, (5) quartz tube, (6)tubular furnace, (7) thermocouple and porcelain boat, (8) power supply, (9) cotton filter, (10) cooling system, (11) gas collection system
Catalytic fast pyrolysis was conducted in a lab-made horizontal pyrolyzer, a schematic diagram of which is shown in Fig. 1. In this pyrolysis system, nitrogen (flow rate of 0.04 m3/h) was used as the carrier gas, as well as the shielding gas. When the pyrolyzer was heated to the setting temperature (550 °C, which was selected by consulting various reports (Wu et al. 2009; Chen et al. 2014)), the mixed sample (0.5 g) was pushed into the center of the furnace and reacted for 5 min. Pyrolysis products were collected with a cold collecting method. Produced volatiles, including gas and steam of bio-oil, passed through scrubbers placed in an ice-salt bath, with isopropanol (100 mL) following as an absorbing solvent. After this process, bio-oil was absorbed by isopropanol, and gas obtained by a drainage collection process was collected ultimately with gas bags for further analysis. Pyrolysis solid residue, as well as bio-char, was cooled down to room temperature, weighed, and then moved to a silica gel dryer for further analysis and detection. The yields of the three-phase products were calculated according to Lv et al. (2013).
Analytical Methods
Elemental analysis
The C, H, N, and S elements contained in bio-oil and bio-char were detected using a Vario-EL CUBE elemental analyzer (ELEMENTAR, Germany). The content of elemental oxygen was calculated by the difference method.
FTIR analysis
Infrared spectra of bio-oil and bio-char were obtained using a Fourier transform infrared spectrometer (FTIR) (Nexus Thermo Nicolet, USA). Samples were pressed into a KBr pellet with a mass ratio of 1:50. The spectra were scanned within the range from 500 to 4000 cm-1 with a resolution of 4 cm-1.
GC analysis
Qualitative and quantitative analyses of gaseous components were carried out on a GC-7890A gas chromatograph with a TCD detector (TECHCOMP, Shanghai, China). A gas mixture that contained H2 (8.93%), O2 (1.07%), N2 (71.94%), CH4 (2.04%), CO (9.71%), CO2 (1.09%), C2H2 (3.22%), C2H4 (0.98%), and C2H6 (1.02%) was used as the external standard gas. A double-column system, equipped with GDX104 and 5A molecular sieve packed column (TECHCOMP, Shanghai, China), separately detected the single components of pyrolysis gas. When testing, the injector and the oven were kept at 50 °C, the detector was set at 100 °C, and the current was set at 70 mA.
GC/MS analysis
Absorbed bio-oil solution was analyzed on a 7890A gas chromatograph coupled with a 5975C mass spectrometer (Agilent Technologies, USA). The injection volume was 1 μL. Helium was used as the carrier gas, and the flow rate was 1.20 mL/min. The injector, detector, and interface temperatures were all set at 250 °C. The capillary column HP-5MS (30 m × 0.25 mm × 0.25 μm) was selected as the separation column. The separation temperature was programmed from 50 °C (3 min) to 90 °C with a heating rate of 10 °C/min, to 170 °C with a heating rate of 3 °C/min, and to 250 °C (5 min) with a heating rate of 15 °C/min. The mass spectrometer was set at an ionizing voltage of 70 eV, and the mass range from m/z 30 to 500 was scanned with a speed of 1.0 s/decade. Data processing was performed using Perkin Elmer NIST Spectral Version 5 software (USA).
RESULTS AND DISCUSSION
Distribution of Pyrolysis Products
During the catalytic fast pyrolysis process, lignin can be degraded into bio-oil (liquid product, containing water (Azadi et al. 2013)), gas (gaseous product), and bio-char (solid product). The yields of products from catalytic fast pyrolysis of AL with various additive ratios of nano-NiO catalyst in the horizontal pyrolyzer are listed in Table 1. Among these values, the external standard gas quantitatively detected the yield of gaseous products; the yield of bio-char was obtained by weighing the product directly; and the yield of bio-oil was calculated as the difference.
As can be seen in Table 1, the influence of the additive ratio of nano-NiO varied with respect to the formation of the three products. When the ratio increased from 5% to 15%, the yield of gas increased from 8.31% to 12.84% while the yield of bio-char decreased from 38.71% to 35.01%. Nevertheless, the changing trend of bio-oil yield was different from those of gas and bio-char. With increasing additive ratio, the yield of bio-oil increased slightly, from 52.98% to 53.09%, and then decreased to 52.12%, and the maximum yield was obtained at the additive ratio of 10%. Through further analysis of Table 1, it is clear that, with increasing additive ratio of nano-NiO catalyst, the formation of volatiles, including bio-oil and gas, was promoted, while that of bio-char was restricted correspondingly. These results suggest that nano-NiO can catalyze the fast pyrolysis of AL well, producing much more useful and volatile products. Moreover, the optimal additive ratio of nano-NiO for bio-oil formation was 10%. Detailed properties of gas, bio-oil, and bio-char influenced by nano-NiO catalyst will be further investigated in the following sections.
Table 1. Yields of Products from AL Pyrolysis Catalyzed by Nano-NiO (wt.%)

Properties of Gas
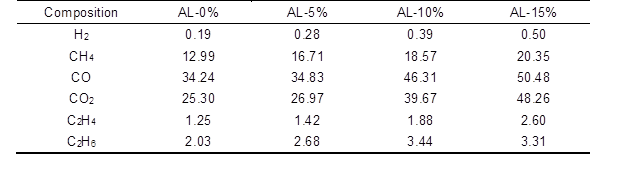
During catalytic fast pyrolysis of AL with nano-NiO at 550 °C, the generated gas products are mostly H2, CO, CO2, and hydrocarbons (CH4, C2H4, and C2H6). The composition of these gases and their yields catalyzed by various additive ratios of nano-NiO are presented in Table 2. Among these obtained gases, CH4, CO, and CO2 were the three major compositions. Previous researchers have shown that the formation of CH4, CO, and CO2 during the pyrolysis process benefits from the thermal degradation of the O-CH3 group, the C-O-C group, and the C=O group (Zheng 2008; Guo et al. 2011), respectively. However, CO and CO2 should be also released from the gasification process of AL and generated coke, especially in the presence of the nano-NiO catalyst.
Apart from C2H4, the yields of these gases all improved greatly as the amount of catalyst increased. Increases in the yields of CH4, CO, and CO2 should not be overlooked. When the additive ratio of nano-NiO was increased from 0% to 15%, the yield of CO2 relatively increased by 90.75%. Meanwhile, the increased percentage for CO was 47.43%, and that for CH4 was 56.66%. These three values demonstrate that, compared with CH4, the nano-NiO catalyst tended to facilitate the formation of CO and CO2. The releasing of CO and CO2 was the major deoxygenation mechanism (another form was transfer of oxygen into water, which was also detected in bio-oil and will be discussed later), which would decrease the oxygen content in bio-oil and upgrade its quality (Imran et al. 2014). Furthermore, literature studies have reported possible reasons for the loss of the oxygen (Ferdous et al. 2001; Liu et al. 2015). According to the above analysis, an initial conclusion could be drawn that the nano-NiO catalyst had positive effects on the oxygen removal during AL fast pyrolysis.
Table 2. Composition and Yields of Gases from AL pyrolysis Catalyzed by Nano-NiO (mg/g)
Properties of Bio-oil
Elemental composition and HHV
The elemental content, the atomic ratios of O/C and H/C, and the calculated higher heating value (HHV) of bio-oil with various additive ratios of nano-NiO, after rotary evaporation at 30 °C, are displayed in Table 3. Because of the catalytic fast pyrolysis with nano-NiO, the content of carbon retained in bio-oil rose from 64.80% to 70.42% with increasing catalyst additive ratio. Meanwhile, the oxygen content decreased from 29.02% to 25.41%. Correspondingly, the O/C ratio decreased from 0.34 to 0.27. These changes indicated that the nano-NiO catalyst could remove the oxygen in the way of volatile oxygenates and water, fix the carbon, and realize the upgrading of bio-oil.
Table 3. Elemental Analysis and Higher Heating Value of Bio-oil and Bio-char from AL Pyrolysis Catalyzed by Nano-NiO
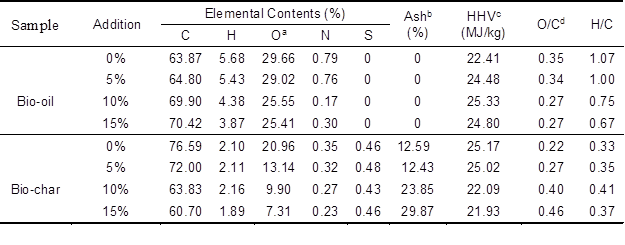
a Determined by difference. b Remaining catalyst. c Calculated from Dulong formula (Ferdinand et al. 2012). d Atomic ratio
At the same time, the hydrogen content in bio-oil decreased from 5.43% to 3.87% and the H/C ratio dropped from 1.00 to 0.67 as the additive ratio increased from 5% to 15%. This phenomenon could be explained by the increase in hydrocarbons formed with the higher additive ratio of nano-NiO as shown in Table 2. It also could be verified by the following FTIR analysis of bio-oil. Nevertheless, the variation trend of HHV influenced with various catalytic ratios was consistent with the yield of bio-oil. A highest value of 25.33 MJ/kg was measured for the bio-oil with a 10% nano-NiO addition, which suggests that the HHV value reaches the maximum value when 10% nano-NiO is added. All of these properties are extremely crucial for bio-oil used as a replacement for demanding petrochemical applications (French and Czernik 2010).
Functional groups determined by FTIR
To make the properties of bio-oil more clearly, FTIR was carried out to determine the functional groups in those compounds, and the corresponding FTIR spectra are shown in Fig. 2(a). Band 1 (3749 cm-1) was the absorption of water; band 2 (3428 cm-1) was the typical signal of the O-H stretching vibration; band 3 (2931 cm-1) was the absorption of the C-H stretching vibration; and band 4 (1696 to 1686 cm-1) was the C=O stretching vibration in unconjugated carbonyls (Bassilakis 2001; Ferdous et al. 2001). Band 5 (1607 cm-1) was the aromatic ring vibration.
With increasing nano-NiO ratio (from bio-oil-5% to bio-oil-15%), the absorption intensity of peak 1 was enhanced, indicating that more water was generated. The formation of water was the other route for oxygen removal from AL, as mentioned above, reflecting the beneficial effect of nano-NiO catalyst that can remove the oxygen in the form of water. Meanwhile, the absorption signal of peak 3 in bio-oil-15% was stronger than that in bio-oil-5%, which suggested more alkylated compounds in bio-oil-15%. Furthermore, the absorption signal of peak 4 in bio-oil-10% almost disappeared, showing that there were fewer unconjugated carbonyl groups in bio-oil-10%, which was consistent with the varying O/C ratio of bio-oil with increasing nano-NiO additive ratio.
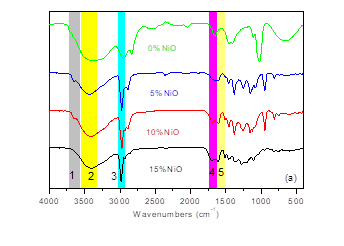
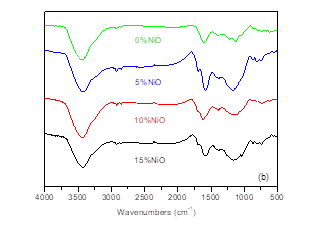
Fig. 2. FTIR spectra of (a) bio-oil and (b) bio-char from AL pyrolysis catalyzed by nano-NiO
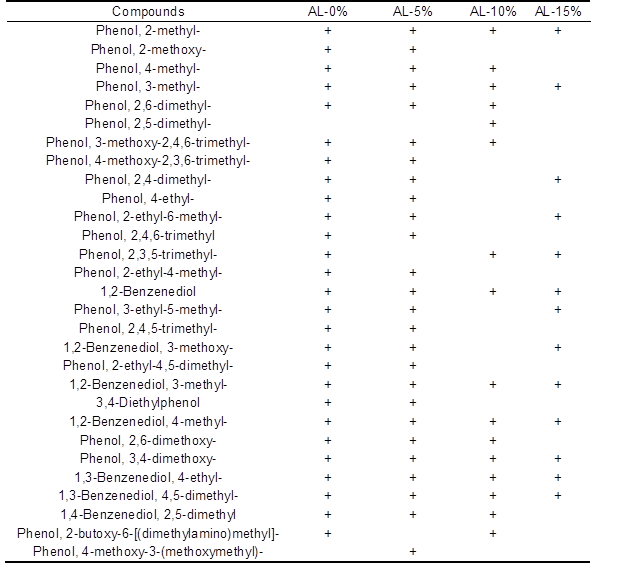
Components determined by GC/MS
GC/MS analysis of bio-oil produced from AL catalytic pyrolysis with nano-NiO at 550 °C is given in Table 4, and the components primarily contain quantities of phenols. The identified compounds were altered noticeably when increasing the additive ratio of catalyst. Species of phenolic compounds decreased from 26 with 5% addition down to 13 with 15% addition, which indicated that more oxygen was removed in the presence of the nano-NiO catalyst and meant that the increased proportion of nano-NiO facilitated the accumulation of crucial components of bio-oil.
Table 4. Components of Bio-oil from AL Pyrolysis Catalyzed by Nano-NiO+, detected in the catalytic product
Properties of Bio-Char
As shown in Table 3, the elemental content, the HHV, and the ratios of H/C and O/C in bio-char were characterized. With increasing additive ratio of nano-NiO from 5% to 15%, the carbon, hydrogen, and oxygen contents all decreased rapidly, from 72.00% to 60.70%, from 2.11% to 1.89%, and from 13.14% to 7.31%, respectively. These results suggested that nano-NiO catalyst had a remarkable impact on the organic composition in bio-char and led to the production of more volatile products, consistent with the results presented above. Additionally, the decreases in the carbon, hydrogen, and oxygen contents resulted in the HHV decreasing from 25.02 MJ/kg to 21.93 MJ/kg. The bio-char contained relatively higher energy and ash content, which could be burned to produce heat and recover the catalyst, or could be used to prepare value-added NiO/C catalyst. Furthermore, the highest value of H/C occurred at 10% catalyst addition. This suggests that the conversion of carbon and hydrogen was the highest with 10% nano-NiO. The FTIR spectra of bio-char are shown in Fig. 2(b), wherein the remaining organic structures in bio-char could be confirmed. They were the O-H group (3420 cm-1, peak 1), the C=O group (1691 cm-1, peak 2), and the C-H group (1165 cm-1, peak 3). While the additive ratio of nano-NiO catalyst increased, the absorption intensities of the three groups all weakened. The remarkable change in the FTIR of bio-char is another piece of powerful evidence that proves the effective catalysis of nano-NiO.
Carbon and Energy Conversion
To evaluate the catalytic effect of nano-NiO and to determine the properties of the three pyrolysis products further, carbon and energy conversion were introduced (Lou and Wu 2011) . The formula employed was as follows:
 (1)
(1)
 (2)
(2)
In Eq. 1, Cbio-char represents the carbon weight in bio-char, Cfeedstock represents the carbon weight in feedstock. And In Eq. 2, the HHVbio-char represents the HHV of bio-char, whereas HHVfeedstock represents the HHV of feedstock.
To focus on the target products proportion in the available components, carbon and energy yield were proposed and described as follows:
![]() (3)
(3)
![]() (4)
(4)
Fig. 3. (a) Carbon flow, (b) carbon conversion, and (c) energy conversion of AL pyrolysis catalyzed by nano-NiO
As can be seen from Fig. 3(a), the carbon was primarily distributed in bio-oil and bio-char, but less so in gas. The distribution laws of carbon converted to bio-oil, gas, and bio-char with increasing nano-NiO ratio were in accordance with those of their yields drawn from Table 1. Meanwhile, Fig. 3 demonstrated the influence of nano-NiO on the carbon and energy conversion to pyrolysis products. The conversion trend of energy was the same as that of carbon, and the selective conditions of carbon and energy conversion were both obtained with 10% nano-NiO addition.
When increasing the nano-NiO ratio, more carbon and energy were converted to volatiles (bio-oil and gas), and less to bio-char, proving the good catalytic effect of nano-NiO. Meanwhile, at the optimal additive ratio of nano-NiO (10%), the carbon conversion rate and the carbon yield (to bio-oil) were calculated as 65.50% and 85.69%, respectively, and the energy conversion rate and the energy yields obtained were 74.53% and 68.92%, respectively. Besides, the energy conversion to gas as fuel gas was attractive to industrial production, because the gas can be applied directly to the boiler as combustion energy required for pyrolysis (Yassin et al. 2007).
CONCLUSIONS
- The ability of the nano-NiO catalyst to promote the formation of gas and restrict the formation of bio-char increased with increasing additive ratio. CO and CO2 were the two main components in gas, and their release was the major form of oxygen removal catalyzed by nano-NiO.
- Nano-NiO also influenced the yield and quality of bio-oil selectively. The maximum yield of bio-oil (53.09 wt.%) and higher heating value (25.33 MJ/kg) were both obtained when the additive ratio of nano-NiO was 10%. Moreover, nano-NiO could upgrade the bio-oil by reducing oxygen contents and lowering the species of the oxygenated phenolic compounds.
- The selective catalytic effect of nano-NiO was also reflected in the carbon and energy conversion from feedstock to products. Under the optimal additive ratio (10%), the carbon conversion rate was 65.50% and the energy conversion rate was 74.53%. These indicated that nano-NiO was fit for the catalytic fast pyrolysis of Alcell lignin and was conducive to condense the carbon and energy.
ACKNOWLEDGEMENTS
This work was supported by the National Major Fundamental Research Program of China (973 program, NO.2013CB228101) and the State Natural Sciences Foundation (NO.31270635 and NO.21176095).
REFERENCES CITED
Azadi, P., Inderwildi, O. R., Farnood, R., and King, D. A. (2013). “Liquid fuels, hydrogen and chemicals from lignin: A critical review,” Renewable & Sustainable Energy Reviews 21(5), 506-523. DOI: 10.1016/j.rser.2012.12.022
Bassilakis, R. (2001). “TG-FTIR analysis of biomass pyrolysis,” Fuel 80(12), 1765-1786. DOI: 10.1016/S0016-2361(01)00061-8
Beis, S. H., Mukkamala, S., Hill, N., Joseph, J., Baker, C., Jensen, B., Stemmler, E. A., Wheeler, M. C., Frederick, B. G., and Van Heiningen, A. (2010). “Fast pyrolysis of lignins,” BioResources 5(3), 1408-1424. DOI: 10.15376/biores.5.3.1408-1424
Chen, Q., Yang, R., Zhao, B., Li, Y., Wang, S., Wu, H., Zhuo, Y., and Chen, C. (2014). “Investigation of heat of biomass pyrolysis and secondary reactions by simultaneous thermogravimetry and differential scanning calorimetry,” Fuel 134, 467-476. DOI: 10.1016/j.fuel.2014.05.092
Dickerson, T., and Soria, J. (2013). “Catalytic fast pyrolysis: A review,” Energies 6(1), 514-538. DOI: 10.3390/en6010514
Dong, Z. X., Song, Z. J., Yang, L. Z., Jiang, N. M., and Zhu, W. T. (2003). “Influence of pyrolysis parameters on tar content in the gas,” Journal of Combustion Science & Technology 9(4), 329-334. DOI: 10.3321/j.issn:1006-8740.2003.04.008
Ericsson, I. (1985). “Influence of pyrolysis parameters on results in pyrolysis-gas chromatography,” Journal of Analytical & Applied Pyrolysis 8(1-4), 73-86. DOI: 10.1016/0165-2370(85)80016-4
Ferdinand, F. W., Steene, L. V. D., Blaise, K. K., and Siaka, T. (2012). “Prediction of pyrolysis oils higher heating value with gas chromatography–mass spectrometry,” Fuel 96(1), 141-145. DOI: 10.1016/j.fuel.2012.01.007
Ferdous, D., Dalai, A. K., Bej, S. K., Thring, R. W., and Bakhshi, N. N. (2001). “Production of H2 and medium Btu gas via pyrolysis of lignins in a fixed-bed reactor,” Fuel Processing Technology 70(1), 9-26. DOI: 10.1016/S0378-3820(00)00147-8
French, R., and Czernik, S. (2010). “Catalytic pyrolysis of biomass for biofuels production,” Fuel Processing Technology 91(1), 25-32. DOI: 10.1016/j.fuproc.2009.08.011
Gandini, A., and Belgacem, N. M. (1998). “Recent advances in the elaboration of polymeric materials derived from biomass components,” Polymer International 47(3), 267-276. DOI: 10.1002/(SICI)1097
Lv, G. J.,Wu, S. B., and Yang, G. (2013). “Comparative study of pyrolysis behaviors of corn stalk and its three compoents,” Journal of Analytical and Applied Pyrolysis 104,185-193. DOI: 10.1016/j.jaap.2013.08.005
Guo, D. L., Wu, S. B., Lou, R., Yin, X. l., and Yang, Q. (2011). “Effect of organic bound Na groups on pyrolysis and CO2-gasification of alkali lignin,” BioResources 6(4), 4145-4157. DOI: 10.15376/biores.6.4.4145-4157
Huijgen, W. J. J., Telysheva, G., Arshanitsa, A., Gosselink, R. J. A., and de Wild, P. J. (2014). “Characteristics of wheat straw lignins from ethanol-based organosolv treatment,” Industrial Crops and Products 59, 85-95. DOI: 10.1016/j.indcrop.2014.05.003
Imran, A., Bramer, E. A., Seshan, K., and Brem, G. (2014). “High quality bio-oil from catalytic flash pyrolysis of lignocellulosic biomass over alumina-supported sodium carbonate,” Fuel Processing Technology 127, 72-79. DOI: 10.1016/j.fuproc.2014.06.011
Jin, J., Nishiyama, N., Egashira, Y., and Ueyama, K. (2009). “Pore structure and pore size controls of ordered mesoporous carbons prepared from resorcinol/formaldehyde/ triblock polymers,” Microporous & Mesoporous Materials 118(1), 218-223. DOI: 10.1016/j.micromeso.2008.08.030
Li, J., and Pawłowski, A. (2007). “Preparation of nano-NiO particles and evaluation of their catalytic activity in pyrolyzing biomass components,” Energy and Fuels 16(3), 1657-1665. DOI: 10.1021/ef700283j
Liu, C., Liang, J. J., Wu, S. B., and Deng, Y. B. (2015). “Effect of chemical structure on pyrolysis behavior of Alcell mild acidolysis lignin,” BioResources 10(1), 1073-1084. DOI: 10.15376/biores.10.1.1073-1084
Lou, R., and Wu, S. B. (2011). “Products properties from fast pyrolysis of enzymatic/mild acidolysis lignin,” Applied Energy 88(1), 316-322. DOI: 10.1016/j.apenergy.2010.06.028
Lu, Q., Zhang, Z. F., Dong, C. Q., and Zhu, X. F. (2010). “Catalytic upgrading of biomass fast pyrolysis vapors with nano metal oxides: An analytical Py-GC/MS study,” Energies 3(11), 1805-1820. DOI: 10.3390/en3111805
Mukkamala, S., Wheeler, M. C., van Heiningen, A. R. P., and DeSisto, W. J. (2012). “Formate-assisted fast pyrolysis of lignin,” Energy & Fuels 26(2), 1380-1384. DOI: 10.1021/ef201756a
Wu, Y., Zhao, Z. L., Li, H. B., and He, F. (2009). “Low temperature pyrolysis characteristics of major components of biomass,” Journal of Fuel Chemistry & Technology 37(4), 427-432. DOI: 10.3969/j.issn.0253-2409.2009.04.008
Xiu, S., and Shahbazi, A. (2012). “Bio-oil production and upgrading research: A review,” Renewable & Sustainable Energy Reviews 16(7), 4406-4414. DOI: 10.1016/j.rser.2012.04.028
Yassin, L., Lettieri, P., Simons, S. J. R., and Germana, A. (2007). “Study of the process design and flue gas treatment of an industrial-scale energy-from-waste combustion plant,” Industrial & Engineering Chemistry Research 46(8), 2648-2656. DOI: 10.1021/ie060929d
Zheng, Y. (2008). “Mechanism study of wood lignin pyrolysis by using TG–FTIR analysis,” Journal of Analytical & Applied Pyrolysis 82(1), 170-177. DOI: 10.1016/j.jaap.2008.03.007
Article submitted: July 23, 2015; Peer review completed: September 13, 2015; Revised version received: October 13, 2015; Accepted: October 14, 2015; Published: November 25, 2015.
DOI: 10.15376/biores.11.1.663-673