
Abstract
This paper describes a simple rapid staining microcolorimetric method for analytical fibre material identification using colour vectors of stained fibre material photography. The number of morphological characteristics (nM), number of stains (nS), colour information dimensionality (nDC), and picture elementary points number (npx) can play a key role in distinguishing fibre materials, correct identification, discriminatory power dP (%), and efficacy. Experiments were performed to achieve the most accurate results with a minimum volume of data; the dimensionality reduction was made experimentally by setting nM = 0, nS = 1, nDC <1, 3>, and the effect of number of pixels on the dP (%) was measured. The correct identification was achieved by less than 100 pixels when using 2 colour vectors, and by less than 50 pixels when using 3 colour vectors: R, G, and B. The real area of the pixels used for correct identification was less than 0.1 mm2 in the used model system of the cellulose fibre materials.
Download PDF
Full Article
Cellulose Materials Identification: The Effect of Dimensionality of Colour Photography Data
Lenka Dubinyová,a Michal Jablonský,a,* Štefan Varga,b Miroslav Fikar,b and Svetozár Katuščák a
This paper describes a simple rapid staining microcolorimetric method for analytical fibre material identification using colour vectors of stained fibre material photography. The number of morphological characteristics (nM), number of stains (nS), colour information dimensionality (nDC), and picture elementary points number (npx) can play a key role in distinguishing fibre materials, correct identification, discriminatory power dP (%), and efficacy. Experiments were performed to achieve the most accurate results with a minimum volume of data; the dimensionality reduction was made experimentally by setting nM = 0, nS = 1, nDC <1, 3>, and the effect of number of pixels on the dP (%) was measured. The correct identification was achieved by less than 100 pixels when using 2 colour vectors, and by less than 50 pixels when using 3 colour vectors: R, G, and B. The real area of the pixels used for correct identification was less than 0.1 mm2 in the used model system of the cellulose fibre materials.
Keywords: Lignocellulosic; Fibre material identification; Materials analysis; Staining, Scanning; Colorimetry; RGB; Discriminatory analysis; Dimensionality reduction; Optical microscopy
Contact information: a: Slovak University of Technology, Faculty of Chemical and Food Technology, Institute of Natural and Synthetic Polymers, Department of Wood, Pulp and Paper, Radlinského 9, Bratislava, 812 37, Slovak Republic; b: Institute of Information Engineering, Automation, and Mathematics, Radlinského 9, Bratislava, 812 37, Slovak Republic;
* Corresponding author: michal.jablonsky@stuba.sk
INTRODUCTION
The cell and cell group type of natural plant fibres types can differ in terms of their morphological, chemical, and physical properties. These differences in fibre types can be observed in many ways and could be used for their identification. The most commonly used fibre identification methods are:
- Scanning electron microscopy (SEM) (IWTO-58 2000; Bergfjord and Holst 2010; Khalil et al. 2010; Fiore et al. 2014),
- A combination of SEM and optical microscopy often referred to as the “light microscopy” (Petraco and Kubic 2004; Khalil et al. 2010; Chen et al. 2015; Liu et al. 2015),
- Energy dispersive x-ray spectroscopy (EDS), SEM, and Fourier transform infrared spectroscopy (FTIR) (Chen et al. 1996; Rezič et al. 2010),
- FTIR (Khalil et al. 2010; Kavkler et al. 2011; Centeno et al. 2014; Fiore et al. 2014),
- Infrared spectroscopy (IR) microspectroscopy (Durán and Angelo 1998),
- Raman spectroscopy (Chen et al. 1996; Fiore et al. 2014),
- Raman spectroscopy combined with staining by stains such as Herzberg solution (Shi and Li 2013),
- X-ray fluorescence (XRF) spectroscopy (Chen et al. 1996),
- Wavelet texture analysis (Zhang et al. 2010),
- Fluorescence analysis (Serterl et al. 2011; Yang et al. 2013),
- Fibre density (Indran and Raj 2015),
- Gas chromatography (GC) and gas chromatography–mass spectrometry (GC/MS) (Lattuati-Derieux et al. 2010),
- Liquid chromatography (LC) or liquid chromatography coupled with electrospray mass spectrometry (LC/ESI-MS) analysis (Paolella et al. 2013),
- Thermogravimetric analysis (TGA) (Mulinari et al. 2010; Fiore et al. 2014; Indran and Raj 2015),
- Thermomechanical analysis, burning test, thermal analysis (TA), differential thermal analysis, fibre melting point (Humphries 2008), twist test (Goodway 1987),
- Solubility or chemical test mainly used for synthetic fibre identification (Liu et al. 2011),
- Microscopic examination of morphological or form information (features) (ASTM 1993; Müller et al. 2004; Ainsworth and Zhang 2005; Chaabouni et al. 2006; AATCC 2008; Liu et al. 2011),
- Polarized light microscopy (PLM) (Whittaker and Przyklenk 2009; Rezič et al. 2010; Oldenbourg 2013),
- Image analysis (Legland and Beaugrand 2013),
- and staining analytical methods with visual colour assessment (Jablonský et al. 2015).
Staining
Staining analytical methods are simple, rapid, low-cost, available, and are the most frequently used in fibre identification. However, they face problems including subjective error and low accuracy. Four fibre types were stained according to standards with zinc chloride-iodine stain (Herzberg stain) (Fig. 1 to Fig. 4). The colors of the fibres used for the Herzberg stain were as follows: groundwood, brilliant yellow; pulp (Whatman and sulphate), dark purplish gray to deep reddish purple; and rag, brilliant purplish pink to vivid red purple.
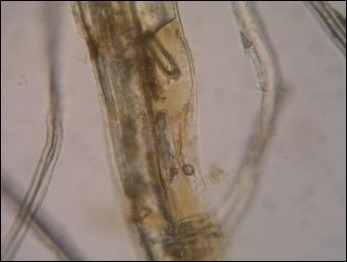
Fig. 1. Groundwood (F1) stained by Herzberg stain
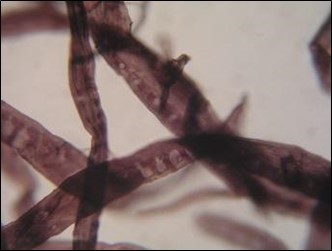
Fig. 2. Sulphite pulp (F2) stained by Herzberg stain
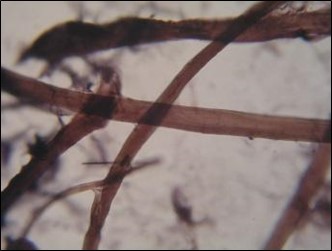
Fig. 3. Whatman paper (F3) stained by Herzberg stain
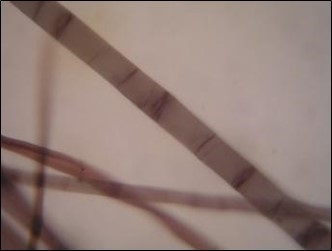
Fig. 4. Rag (F4) stained by Herzberg stain
The subjective verbal color description has some drawbacks: it is fuzzy; it does not provide quantitative data, and the verbal information does not provide any information on colour. It is necessary to use at least 2 stains for subjective visual assessment without use of morphological information.
For fibre identification, often two or more stains are recommended (AATCC 1990; STN ISO 1993; TAPPI 2008). If the identification is more complex, masked by different times, aging, decay, lignification, or differences between normal and abnormal fibres, such as pressure wood fibres (Kutscha and Gray 1971), more stain use is highly recommended. These analytical methods can produce many dimensions of information, which can be either mutually non-correlating or have a positive or negative correlation. Correlation coefficients can also be used as characteristic parameters for fibre material identification (Katuscak and Hruz 1986). It is relatively simple to increase the number of methods, scientific apparati, variables, and dimensionality; however the volume (data) increases with dimensionality (Farooque et al. 2014; Gajamannage et al. 2015; Nazarpour and Adibi 2015), resulting in increasing time, complexity of data and interpretation, and costs, as well as impairing availability, efficacy, and practical use of the respective method.
Real-world data, such as signals from the methods of material analysis and identification, digital photographs, scans, smells, or sounds usually have a high dimensionality. This dimensionality needs to be reduced in order to handle such real-world data adequately.
Both the increase and decrease of the dimensionality depends first of all on the number of methods and their variables used for the fibre identification. Therefore, the first step can be the empirical (experimental) one: minimizing the number of experimental methods and measured variables used for material identification. The second direction of the dimensionality reduction (DR) (Gracia et al. 2014; Sakthivel et al. 2014) is mathematical transformation of high-dimensional data into a meaningful representation of reduced dimensionality. This is done either by linear techniques such as Principal Components Analysis (PCA) (Shawe-Taylor and Cristianini 2004), factor analysis, classical scaling, or nonlinear techniques (Kim and Lee 2014; Yan and Roy 2015). As a result, dimensionality reduction facilitates identification, classification, and visualization.
This work investigates the objectivization of subjective visual identification of stained fibre materials. RGB data of photographs of the stained fibres was used. The key challenge in this work was improving the correctness in identification of unknown fibre materials using a minimum volume of colour data, without any morphology information. The aim was to estimate the minimum (critical) dimensionality and minimum number of pixels.
EXPERIMENTAL
Materials
Stained tissue preparation
The model set of fibres studied were: F1 (groundwood), F2 (bleached sulphate pulp), F3 (Whatman paper), and F4 (rag fibres). Each kind of fibrous material, F1 to F4, was prepared according to standards by defibrating (AATCC 1990; STN 1993). The zinc chloro-iodide stain (Herzberg stain) was prepared and stored according to (AATCC 1990; STN 1993). The fibres (groundwood, sulphate pulp, Whatman paper, and rag) of the defibrated kind of fibre (soaked in water) were taken by a micropipette and plated on slide glasses; fibres were evenly distributed by preparation needle. The microscopic slide and fibres was heated and dried.
Methods
Taking a microphotographic image and scans
To track the microscopic slides, an optical microscope MIC 456 with Olympus Camedia Digital Camera C-5050 ZOOM with 1/1.8″ (7.18 x 5.32 mm) 5 megapixel CCD sensor was used. Microphotographic images were taken at 40x magnification. The stained cellulose fibres were scanned as follows: one fibre was selected from the microphotograph of the sample, and the area of one scan (As) was marked perpendicular to the fibre length measured using a cursor; the width of each scan was 7 picture elements (pixels, px), and the area As = 7 x wf (px), where wf is the fibre width.
The area of the scans of the cellulose fibre microphotograph used in this work corresponded to the given 40-fold magnification to the area of real sample As, r (mm2) <0.04, 0.15>. The scanned data (R, G, and B) from each picture element (pixel) were transferred to a reference database so that the tristimulus R, G, and B measured data and any derived data for each pixel corresponded to 1 line in the database.
Identification of unknown fibre kind sample.
An unknown sample delivered for identification could be either a physical sample or an image of stained fibres prepared from an analysed fibre material. Physical unknown sample should be defibrated, stained, and scanned as described above. Three microscopic images were prepared (selected) from each unknown sample; 1 scan (As = 7*wf) was taken from each image as described above
Estimation of discriminatory power (dp) of the 1-P, 2-P and 3-P colour vectors R, G, B
The information value of RGB vectors for the fibre identification was measured experimentally and expressed as the percentage of the correctly identified unknown fibre samples as follows: the number of unknown samples for one measurement of the dP (%) was 20, and the number of unknown samples from one kind of fibres F1-F4 were 5; 3 images and scans (1 scan of a selected fibre per each image) were made from each sample. Various numbers of pixels from 1 to 1000 px were taken from each 1 sample (3 images, 3 scans) by statistical random selection. Six parallel measuring experiments were performed (Table 2).
Empirical dimensionality and data volume reduction.
The preliminary tests show that it was possible to reduce the number of stains by using RGB parameters of the stained fibres, so only one stain was used instead of 2 to 3. The goal of the present experiments was to analyse the effect of the number of colour vector dimensions and number of pixels of a scanned image of a stained fibre on the percent of correctly identified fibre samples, and critical number of pixels and area detected needed for just 100% recognisable unknown fibre samples, in a selected set of fibre types. The objective identification based on the dimensionality and data volume of a fibre is influenced first of all by number of stains (nS), methods, and the resulting number of morphological (nm), chemical (nc), spectral (ns), and physical (np) parameters used for the identification. The dimension reductions used in this paper were as follows: nS = 1, nm = 0, nc = 0, ns = 0, np = 0, and the effect of the number of color dimensions nDC <1, 3> and number of pixels npx. <1, 1000> on % of correctly identified unknown samples (dP (%)) were examined. The critical number of pixels (npx, crit) and minimal detection area (Ad, cr) needed (necessary) for just 100% correct detection was estimated.
RESULTS AND DISCUSSION
Figure 5 shows the 3-P and 2-P orthogonal visualization of the overlapping R, G, and B data clouds of all the four fibre types F1 to F4. The first graph on the left represents 14,000 picture elements, or 4 x 3 500 px for each type of the cellulose fibre; the other 3-P and 2-P clouds represents 100 px per each type of the cellulose fibre.
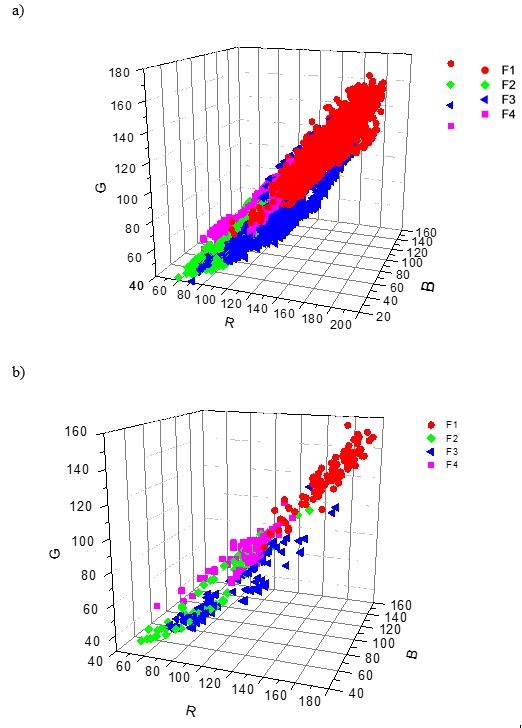
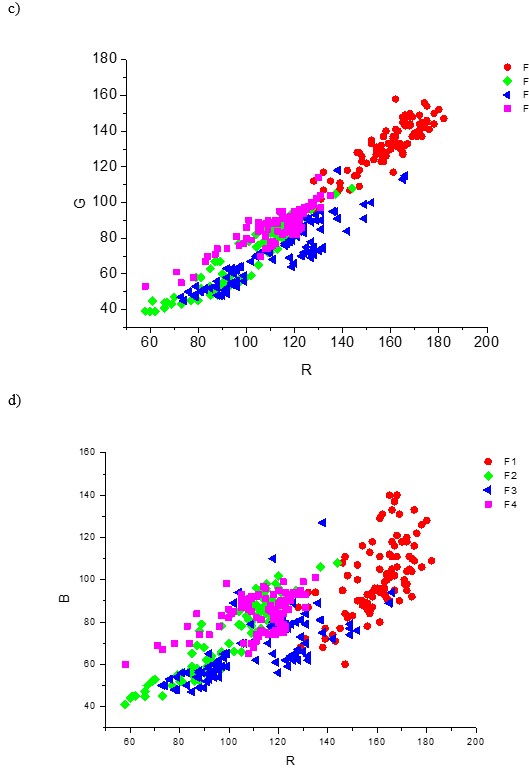
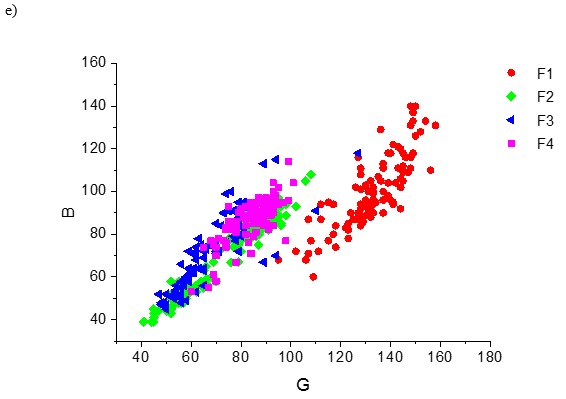
Fig. 5. 3-P visualization and 2-P projections of the data clouds of the fibre types F1, F2, F3, and F4 stained by the zinc chloro-iodide stain. a) – 3500 px per 1 kind of fibre; b) – 100 px per 1 fibre type; c), d), e) – 2-P; G-R, B-R and B-G projections of the 100 px data clouds
The model system comprising the 4 types of cellulose fibre materials, F1 to F4, is complex in terms of both objective and subjective identification (Fig. 5). Both the overlapping volume of the data clouds and overlapping area of the probability density functions of all individual colour dimensions was high, resulting in a low index of distinguishability. This indicates that the individual colour pixel data were hard to distinguish and identify. In other words, identification of the fibre type with the model studied is a complex task both visually and objectively, especially if using 1 stain only. Using 2 or more stains would cause a rapid increase of data volume, time, and cost of fibre identification.
The key question here was whether it is possible to increase the discriminatory power and achieve a high enough percentage of correctly identified unknown samples to be satisfactory for praxis (e.g., between 90 to 100%) by sampling, using only one chemical stain, the zinc chloro-iodide (Herzberg) stain.
To better understand the relationships in the model of the 4 cellulose fibres, and to solve the problem of low distinguishability of the RGB colour data of individual pixels and the low index of distinguishability, the following factors, hypothetically allowing for increasing the discriminatory power (dP) and efficacy and parameters, were studied: sampling, dimensionality (nDC), number of picture elementary points per the average input used in the discriminatory analysis (npx), colorimetric data volume, specific information power of 1 px and 1 px sample area (Apx in mm2), and the change of dP (%) added value of 1 px data with increasing number of pixels used for the identification.
Table 1. Effect of the Colour Vector Dimensionality and Number of Pixels on the Average Discriminatory Power Estimated Empirically by the Percentage of Correctly Identified Unknown Samples
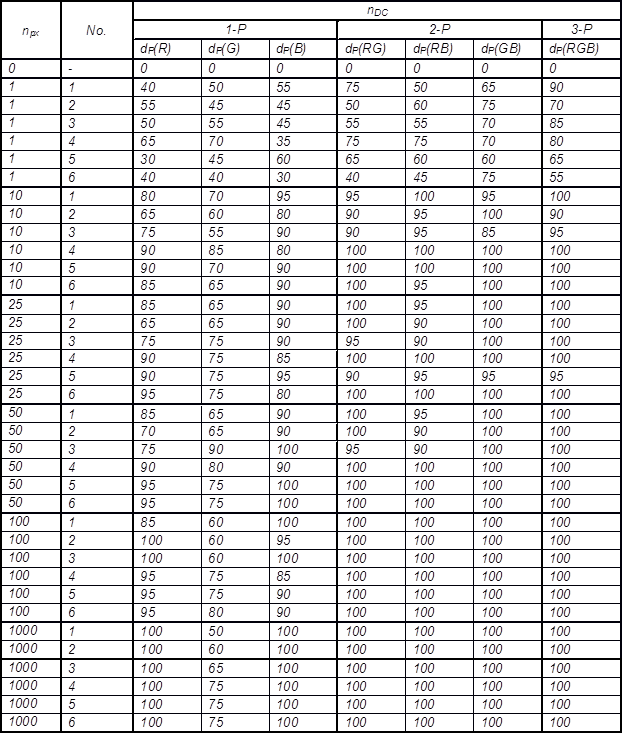
Symbols: No.: unknown sample number; 1-P, 2-P, and 3-P: number of parameters at identification; nDC – dimensionality; npx – number of pixel; dP (%): discriminatory power expressed as the percentage of correctly identified fibre samples; µdp: average discriminatory power; Ϭdp: standard deviation
The types of fibres in the model experiment nfk = 4; The 4 types of fibres in the model set F1 (groundwood), F2 (sulphate pulp), F3 (Whatman paper), and F4 (rag fibres). The fibres were stained by zinc chloro-iodide solution (Herzberg stain). The number of unknown fibre kind samples nufk was 220 (nufk = 120 (6×20) at npx = 1; nufk = 100 (5×20) at npx > 1). The total number of analyses/fibre identifications was 1540 (220×7).
After preliminary testing of various ways of sampling, the following sampling was used: the average values of the R, G, and B vectors of 1 scan, each containing 103 px, was taken of each unknown fibre sample, and the effect of dimensionality (nDC) and number of pixels (npx) were used as the input for the identification using the Quadratic discriminant analysis (McLachlan 1992). Each line in the Table 1 represents identification of 20 unknown samples, with 5 samples of each fibre types (F1 to F4). Each dP value in the line represents the % of correctly identified samples of the 20 unknown samples using various colour dimensions and pixel number in 6 parallel experiments (with the exception for the npx=1, where 12 parallel measurements were made, because of the naturally higher variability).
Averages of parallel experimental measurements, their standard deviations, and coefficients of variation are shown in Table 2 for the range from 1 to 1000 px and equivalent pixels area Apx <0.0018 to 1.75> mm2. Apx is the calculated theoretical detected area on the real sample corresponding to the pixels taken into discriminatory analysis for the particular fibre identification provided that 1 px = 2.646*10-4 m, and the square area of 1 px = 1.8*10-3 mm2. The Apx could be used in communication on sampling for the various objective methods according to this study using higher than critical, or recommended nDC, npx, and (or) detected area Apx (see also Table 2).
Table 2. Effect of Dimensionality, Number of Pixels, and Detected area of the Pixels Used for the Particular Identification of each Sample on the Average Discriminatory Power
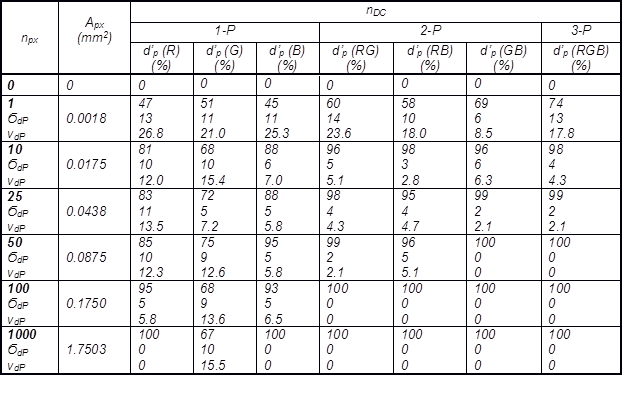
Symbols: nDC – dimensionality; dP (%) – discriminatory power measured as the percentage of correctly identified unknown fibre samples in an experiment; d’P (%) – average discriminatory power of a colour vector or a combination their; nE (nE = 6) – number of parallel experiments each containing a set of 20 unknown samples, 5 unknown samples from each type F1 – F4; npx – number of pixels; Apx – detected area (1.8*10-3 mm2 for 1 px); nDC – colour vector dimensionality (1-P, 2-P, 3-P); Ϭdp – standard deviation; vdP – coefficient of variations
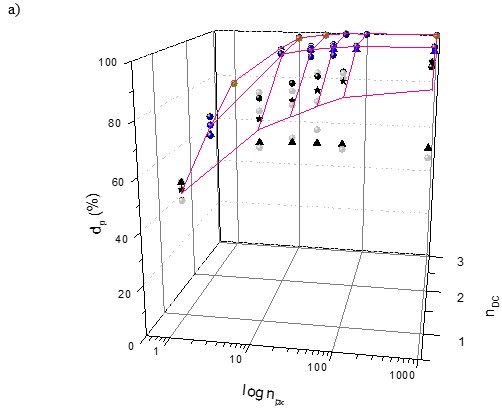
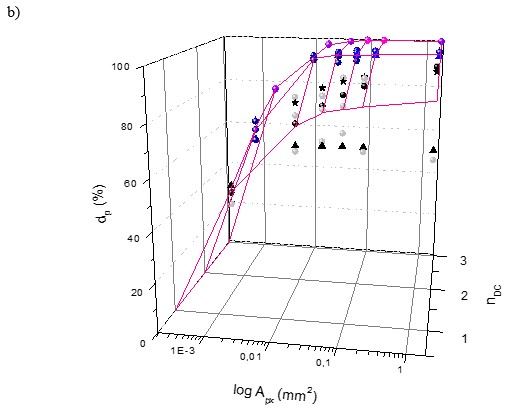
Fig. 6. The effect of number of pixels (npx) and dimensionality (nDC) on the average discriminatory power (d’p); its variability (vdP) and information added value
As can be seen from Table 2, the average as the percentage of the correctly identified unknown fibre samples (d’p) increases both with the dimensionality of the colour information used (nDC) and the number of pixels. It can be seen that 100% correct fibre sample identification was achieved in the model system when using 50 px or more. The variance and coefficient of variation decreased to zero ϬdP2 = ϬdP = vdP = 0.
The effect of the dimensionality (nDC), number of pixels (npx), and detected area on the discriminatory power (dP) measured by the % of correctly identified fibre samples can be seen in Fig. 6. The dP expresses the correctness of fibre material identification as well.
Figure 6a shows the 3-P visualization of relationships between the discriminatory power dP of the R, G, and B vectors and their 2-P and 3-P combinations and colour dimensionality and the number of pixels. Figure 6b shows the effect of detected pixels area (Apx) recalculated to the size of real pulp or paper samples of the 4 fibre materials groundwood (F1), sulphate pulp (F2), Whatman paper (F3), and rag fibres (F4). The zero point Apx = npx = nCD = 0 in equations in Table 1 and Table 2 is physically valid; this expresses the fact that if the area detected and the number of pixels used is 0, the number of colour dimensions used of each pixel is zero, and the % of identified samples dP = 0%.
The percentage of correctly identified fibres depends on the number of pixels (npx) by following general equation,
where a, b, and c are constants. The least (critical) number of pixels (npx, cr) as well as the critical sample area detected (Apx, cr) necessary to correctly identify unknown samples were estimated, and can be seen in Fig. 6 for all 3 colour dimensions.
CONCLUSIONS
- Problems of subjective visual evaluation, such as low accuracy, missing quantitative data for storage, databases creation, and mathematical and graphical evaluation, were solved here. The 1-P, 2-P, and 3-P colour vector information from photography of fibre material stained by zinc chloro-iodide stain was used for objectivisation of the fibre material identification in a model system of 4 types of fibrous lignocellulosic materials. The main advantages of this method of lignocellulose materials identification are as follows (1) no morphology information on form of fibres is necessary, (2) the number of stains could be minimised to one stain in comparison with more stains used according to standard procedures for visual determination up till now, and (3) objective data could be measured, stored and statistically evaluated, compared and continually improved, g., in knowledge databases.
- The objective micro-colorimetric method of unknown fibre identification using the RGB vectors of stained fibre was successfully tested.
- The percentage of correctly identified fibre materials (dP) increases with increasing the number of pixels and with the sample area detected, while the variability of correctness of identification (vdP) as well as the average information added value of 1 px decreases simultaneously.
ACKNOWLEDGEMENTS
This work was supported by a grant no. APVV-14-0393.
REFERENCES CITED
AATCC Test Method 20 – 1990. (1990). “Fiber analysis: Qualitative,” American Association of Textile Chemists and Colorists, Research Triangle Park, N.C., USA.
AATCC Test Method 20A – 2000. (2008). “Fiber analysis: Quantitative,” American Association of Textile Chemists and Colorists AATCC Technical Manual, Research Triangle Park, N.C., USA.
Ainsworth, W. D., and Zhang, L. (2005). “Microscope analysis of animal fibre blends training of operatives,” Kashmir. C.C.I.A.A. PRATO 11, 1-14.
ASTM (1993). “Standard methods for quantitative analysis of textiles, method D629-88 vol. 07.01,” American Society for Testing and Materials, West Conshohocken, PA.
Bergfjord, C., and Holst, B. (2010). “A procedure for identifying textile bast fibres using microscopy: Flax, nettle/ramie, hemp and jute,” Ultramicroscopy 110(9), 1192-1197. DOI:10.1016/j.ultramic.2010.04.014.
Centeno, S.A., Vila, A., and Barro, L. (2014). “Characterization of unprocessed historic platinum photographic papers by Raman, FTIR, and XRF,” Microchem. J. 114, 8-15. DOI:10.1016/j.microc.2013.11.016.
Chaabouni, Y., Drean, J-Y., Msahli, S., and Sakli, F. (2006). “Morphological characterization of individual fiber of Agave americana L.,” Text. Res. J. 76(5), 367-374. DOI: 10.1177/0040517506061965.
Chen, H. L., Jakes, K. A., and Foreman, D. W. (1996). “SEM, EDS, and FTIR examination of archaeological mineralized plant fibers,” Text. Res. J. 66(4), 219-224. DOI: 10.1177/004051759606600406.
Chen, Y., Wan, J., Ma, Y., Dong, X., Wang, Y., and Huang, M. (2015). “Fiber properties of de-inked old newspaper pulp after bleaching with hydrogen peroxide,” BioResources 10(1), 1857-1868. DOI: 10.15376/biores.10.1.1857-1868
ČSN ISO 9184-1-5 (1993). “Paper, board and pulps – Fibre furnish analysis,” Czech Standards Institute, Praha, Czech Republic. [in Czech]
Durán, N., and Angelo, R. (1998). “Infrared microspectroscopy in the pulp and paper-making industry,” Applied Spectroscopy Reviews 33(3), 219-236. DOI:10.1080/05704929808006778.
Farooque, T. M., Camp Jr., C. H., Tison, C. K., Kumar, G., Parekh, S. H., and Simon Jr., C. G. (2014). “Measuring stem cell dimensionality in tissue scaffolds,” Biomaterials 35(9), 2558-2567. DOI: 10.1016/j. biomaterials.2013.12.092.
Fiore, V., Scalici, T., and Valenza, A. (2014). “Characterization of a new natural fiber from Arundo donax L. as potential reinforcement of polymer composites,” Carbohyd. Polym. 106, 77-83. DOI:10.2026/j.carbpol.2014.02.016.
Gajamannage, K., Butail, S., Porfiri, M., and Bollt, E. M. (2015). “Dimensionality reduction of collective motion by principal manifolds,” Physica D 291, 62-73. DOI: 10.1016/j. physd-2014.09.009.
Goodway, M. (1987). “Fiber identification in practice,” JAIC 26(1), 27-44.
Gracia, A., González, S., Robles, V., and Menasalvas, E. (2014). “A methodology to compare dimensionality reduction algorithms in terms of loss of quality,” Inform Sciences 270(20), 1-27. DOI: 10.1016/j.ins.2014.02.068.
Humphries, M. (2008). Fabric Reference, (4th Ed.), Prentice Hall, pp. 14-26, 91-102, ISBN-13: 978-0131588226.
Indran, S., and Raj, R. E. (2015). “Characterization of new natural cellulosic fiber from Cissus quadrangularis stem,” Carbohyd. Polym. 117, 392-399. DOI: 10.1016/j.carbpol.2014.09.072.
IWTO-58. (2000). “Scanning electron microscopic analysis of speciality fibres and sheep’s wool and their blends,” Standard Test Method of the International Wool Textile Organisation, Ilkley, UK.
Jablonský, M., Dubinyová, L., Varga, S., Vizárová, K., Šima, J., and Katuščák, S. (2015). “Cellulose fibre identification through color vectors of stained fibre,” BioResources 10(3), 5845-5862. DOI: 10.15376/biores.10.3.5845-5862.
Katuscak, S., and Hruz, B. (1986). “Possibility of use of image analysis in wood research and industry,” Drevo 41, 131-133.
Kavkler, K., Gunde-Cimerman, N., Zalar, P., and Demšar, A. (2011). “FTIR spectroscopy of biodegraded historical textiles,” Polym. Degrad. Stabil. 96(4), 574-580. DOI:10.1016/j.polymdegradstab.2010.12.016.
Khalil, H. P. S. A., Yusra, A. F. I., Bhat, A. H., and Jawaid, M. (2010). “Cell wall ultrastructure, anatomy, lignin distribution, and chemical composition of Malaysian cultivated kenaf fiber,” Ind. Crop. Prod. 31(1), 113-121. DOI: 10.1016/j.indcrop.2009.09.008.
Kim, K., and Lee, J. (2014). “Sentiment visualization and classification via semi-supervised nonlinear dimensionality reduction,” Pattern Recogn. 47(2), 758-768. DOI: 10.1016/j. patcog.2013.07.022.
Kutscha, N., and Gray, J. (1972). “The suitability of certain stains for studying lignification in balsam fir, Abies balsamea (L.) Mill,” Technical Bulletin 53 (March), Life Sciences and Agriculture Experiment Station, University of Maine.
Lattuati-Derieux, A., Echard, J-P., Thao-Heu, S., and Lavédrine, B. (2010). “Analysis of a varnish applied by Nicéphore Niépce to make a print used for photographic purpose transparent,” J. Cult. Herit. 11(4), 477-481. DOI: 10.1016/j.culher.2010.01.003.
Legland, D., and Beaugrand, J. (2013) “Automated clustering of lignocellulosic fibres based on morphometric features and using clustering of variables,” Ind. Crop. Prod. 45, 253-261, DOI:10.1016/j.indcrop.2012.12.021.
Liu, Z., Cao, Y., Wang, Z., Ren, H., Amidon, T. E., and Lai, Y. (2015). “The utilization of soybean straw. I. Fiber morphology and chemical characteristics,” BioResources 10(2), 2266-2280. DOI: 10.15.376/biores.10.2.2266-2280
Liu, J., Guo, D., Zhou, Y., Wu, Z., Li, W., Zhao, F., and Zheng, X. (2011) “Identification of ancient textile from Yingpan, Xinjiang, by multiple analytical techniques,” J. Archaeol. Sci. 38(7), 1763-1770. DOI:10.1016/j.jas.2011.03.017.
McLachlan, G. J. (1992). Discriminant analysis and Statistical Pattern Recognition, New York, John Wiley and Sons.
Mulinari, D. R., Cruz, T. G., Cioffi, M. O. H., Voorwald, H. J. C., Da Silva, M. L. C. P., and Rocha, G. J. M. (2010). “Image analysis of modified cellulose fibers form sugarcane bagasse by zirconium oxychloride,” Carbohyd. Res. 345(13), 1865-1871. DOI:10.1016/j.carres.2010.05.011.
Müller, M., Murphy, B., Burghammer, M., Riekel, C., Roberts, M., Papiz, M., Clarke, D., Gunneweg, J., and Pantos, E. (2004). “Identification of ancient textile fibres form Khirbet Qumran caves using synchroon radiation microbeam diffraction,” Spectrochimica Acta Part B 59(10-11), 1669-1674. DOI:10.1016/j.sab.2004.07.018
Nazarpour, A., and Adibi, P. (2015) “Two-stage multiple kernel learning for supervised dimensionality reduction,” Pattern Recogn. 48(5), 1854-1862, DOI:10.1016/j.patcog.2014.12.001.
Oldenbourg, R. (2013). “Chapter 15 – Polarization Microscopy,” in: Biomedical Optical Phase Microscopy and Nanoscopy, Satterwhite, L.L. (ed.), Marine Biological Laboratory, Brown University, Providence, RI, pp. 311-338. DOI: 10.1016/B978-0-12-415871-9.0015-6.
Paolella, S., Bencivenni, M., Lambertini, F., Prandi, B., Faccini, A., Tonetti, C., Vineis, C., and Sforza, S. (2013). “Identification and quantification of different species in animal fibres by LC/ESI-MS analysis of keratin-derived proteolytic peptides,” J. Mass Spectrom. 48(8), 919-26. DOI: 10.1002/jms.3222.
Petraco, N., and Kubic, T. (2004). Color Atlas and Manual of Microscopy for Criminalists, Chemists, and Conservators, CRC Press, Boca Raton, FL.
Rezič, I., Čurkovič, L., and Ujevič, M. (2010). “Simple methods for characterization of metals in historical textile threads,” Talanta 82(01), 237-244. DOI: 10.1016/j.talanta.2010.04.028.
Sakthivel, N. R., Nair, B. B., Elangovan, M., Sugumanran, V., and Saravanmurugan, S. (2014). “Comparison of dimensionality reduction techniques for the fault diagnosis of mono block centrifugal pump using vibration signals,” Engineering Science and Technology, an International Journal 17(1), 30-38. DOI: 10.1016/j.jestch.2014.02.005.
Serterl, O., Dogdas, B., Chiu, C. S., and Gurcan, M. N. (2011). “Microscopic image analysis for quantitative characterization of muscle fiber type composition,” Computerized Medical Imaging and Graphics 35(7-8), 616-628. DOI: 10.1016/j.compmedimag.2011.01.009.
Shawe-Taylor, J., and Cristianini, N. (2004). Kernel Methods for Pattern Analysis, Cambridge University Press New York, NY, USA.
Shi, J. L., and Li, T. (2013). “Technical investigation of 15th and 19th century Chinese paper currencies: Fiber use and pigment identification,” J. Raman Spectrosc. 44(6), 892–898. DOI:10.1002/jrs.4297.
STN ISO 9184-1-5 (500370). (1993). “Paper, board and pulps – Fibre furnish analysis”.
TAPPI Standard T 401 om-08. (2008). “Fibre analysis of paper and paperboard,” TAPPI Standards, Atlanta, GA.
Whittaker, P., and Przyklenk, K. (2009). “Fibrin architecture in clots: A quantitative polarized light microscopy analysis,” Blood Cell Mol. Dis. 42(1), 51-56. DOI: 10.1016/j. bcmd.2008.10.014.
Yan, L., and Roy, D. P. (2015). “Improved time series land cover classification by missing-observation-adaptive nonlinear dimensionality reduction,” Remote Sens. Environ. 158, 478-491, DOI: 10.1016/j.rse.2014.11.024.
Yang, W., Li, D., Wang, S., Lu, S., and Yang, J. (2013). “Saliency-based color image segmentation in foreign fiber detection,” Mathematical and Computer Modelling 58(3-4), 852-858. DOI:10.1016/j.mcm.2012.12.016.
Zhang, J., Palmer, S., and Wang, X. (2010). “Identification of animal fibers with wavelet texture analysis,” Proceedings of the World Congress on Engineering, Vol I WCE 2010, June 30 – July 2, 2010, London.
Article submitted: June 10, 2015; Peer review completed: September 12, 2015; Revised version received and accepted: October 21, 2015; Published: November 6, 2015.
DOI: 10.15376/biores.11.1.71-86