
Abstract
The reliability analysis method and the allowable stress method were both applied in this study to determine design values of ultimate compression strength (UCS) of visually-graded 40 x 65 mm dimension Chinese larch lumber. A total of 784 lumber samples were tested on the static full-size compression strength, according to Chinese National Standards. The goodness-of-fit for the UCS distribution of four visual grades of lumber were analyzed, and first-order, second-moment reliability analyses under different load cases were performed based on all of the test data. The log-normal distribution was found to optimize the fitted distribution of the ultimate compression strength of Chinese larch dimension lumber. Design values of the compression strength of grades Ic, IIc, IIIc, and IVc were suggested to have the minimum reliability index of 3.2 for the reliability analysis method, and the reduction factor of 1/1.9 for the allowable stress method. The results showed that the design values in the Chinese Code were the most conservative for high visual grade dimension lumber compared to the reliability analysis and allowable stress methods. The reliability analysis method was more suitable for developing design values of lower visually-graded lumber.
Download PDF
Full Article
Comparison between Allowable Properties Method and Reliability Analysis Method to Determine Design Values of Visually Graded Chinese Larch 40 x 65 mm Lumber
Liuyang Han,a Xiu Zhao,b Haibin Zhou,a,* and Xiuqin Luo a
The reliability analysis method and the allowable stress method were both applied in this study to determine design values of ultimate compression strength (UCS) of visually-graded 40 x 65 mm dimension Chinese larch lumber. A total of 784 lumber samples were tested on the static full-size compression strength, according to Chinese National Standards. The goodness-of-fit for the UCS distribution of four visual grades of lumber were analyzed, and first-order, second-moment reliability analyses under different load cases were performed based on all of the test data. The log-normal distribution was found to optimize the fitted distribution of the ultimate compression strength of Chinese larch dimension lumber. Design values of the compression strength of grades Ic, IIc, IIIc, and IVc were suggested to have the minimum reliability index of 3.2 for the reliability analysis method, and the reduction factor of 1/1.9 for the allowable stress method. The results showed that the design values in the Chinese Code were the most conservative for high visual grade dimension lumber compared to the reliability analysis and allowable stress methods. The reliability analysis method was more suitable for developing design values of lower visually-graded lumber.
Keywords: Reliability analysis; Allowable stress; Compress strength; Chinese larch; Dimension lumber; Design value
Contact information: a: Research Institute of Wood Industry, Chinese Academy of Forestry, Dong xiaofu NO 1, Xiangshan Road, Haidian District, Beijing 100091 China; b: Heilongjiang Institute of Wood Science, No. 134 , Haping Road, Nangang District, Harbin 150081 China;
* Corresponding author: zhouhb@caf.ac.cn
INTRODUCTION
Dimension lumber is a building material with standardized sizes designed for a variety of applications. In China, it is commonly imported from many countries including the United States, Canada, and Russia (Yuan et al. 2011; Zhou 2012) to meet market demands. Chinese larch has many advantages for the development of dimension lumber because of its large plantation area and good strength properties (Zhou et al. 2015).
In the field of structural application, design value of a material property should be determined before the materials, such as lumber, steel and engineering plastics, are used in building structures (MOHURD 2005). Design values are important for any structural applications, such that design values of Chinese larch should be quantified to develop Chinese larch as a local timber crop. Two methods are typically used to develop design values for the mechanical properties of structural wood (Zhong and Ren 2014). One is the analysis method of allowable properties, which is popular in North America (ASTM 2007). The other is the reliability analysis method, which is used primarily in China (MOHURD 2001, 2008).
Where specified in GB50005-03 (MOHURD 2003), the design values for the strength properties of Chinese larch originate from the reliability analysis method, which is based on data from small clear specimens. However, Chinese larch wood was designated for only one strength grade in the 2003 edition of the design code. Thus, to expand its miscellaneous utilizations and heighten building security, more strength grades should be assigned to the lumber of Chinese larch and other tree species.
Since 2002, Chinese research institutes have been building a grade system for these prospective species, under the guidance of Forintek Corp. (Canada). In the grade system, visual grading is a stress grading method, which is based on the premise that the mechanical properties of lumber differ from the mechanical properties of clear wood. This is because many growth characteristics affect the properties and these characteristics can be easily visualized. For example, knots are categorized into one of several classes primarily to provide a means for assigning their limits to various grades of lumber. Knots have a major influence on the mechanical properties of wood by way of distorting grain in the vicinity of the knot, causing material discontinuity by checking in the knots as well as in the surrounding material, etc. (Liu and Zhao 2003). Four visual grading rules were included in the new edition of Chinese design code of timber construction (MOHURD 2005). The grading rules were derived from the National Lumber Grades Authority (NLGA) standard of Canadian-based grading rules (2005). In GB50005-03 (MOHURD 2005), the visual grade, Ic, is equivalent to NLGA SS; the visual grade, IIc, is equivalent to NLGA No. 1; the visual grade, IIIc, is equivalent to NLGA No. 2; and visual grade, IVc, is equivalent to NLGA No. 3. Each visual grade denotes a different degree of strength reducing characteristics existing in the lumber. It should be noted that Ic is the highest grade and IVc is the lowest grade. However, the design values were not given for each visual grade. The characteristic values for the visual grades of Chinese larch dimension lumber were determined according to the ASTM D1990 (2007) of North America. Different design values may be assigned because of the differences in the developing methods used to calculate design values between China and North American. Therefore, it is of interest whether the allowable stress method or the reliability analysis method is more accurate for Chinese larch dimension lumber in developing the design value.
For this example, the compression strength of 40 x 65 mm Chinese larch dimension lumber was developed and compared with the design values of the ultimate compression strength of each of the visual grades, based on full-size in-grade tests in accordance with the reliability analysis method (MOHURD 2001, 2008) and the allowable stress method (ASTM 2003).
EXPERIMENTAL
Sampling
Because there is currently no commercial production of Chinese larch dimension lumber, the sampling of dimension lumber cannot be conducted in sawmills. The material used in this study was collected from two regional forestry centers, Cuigang and Pangu, in the Daxing’anling region in Northeast China. In these forestry centers, Chinese larch logs, with diameters at breast heights (DBH) above 240 mm, were sawn from secondary forests and cut into logs measuring 4,000 mm in length. The sampling plan focused on collecting representative logs with small-end diameters ranging from 160 to 340 mm. The number of selected logs was roughly in proportion with the annual cut of each forestry center, in order to provide a sample group that was representative of the entire plantation. A total of 454 m3 Chinese larch logs were sampled: 286 m3 from Cuigang and 168 m3 from Pangu.
Lumber was sawn from the logs following a cant sawing pattern typically used in China, and then kiln-dried to a target moisture content of approximately 12%. After being kiln-dried, all sawn lumbers were planed to a standard size of 4000 mm (Length) by 40 mm (Height) by 65 mm (Width).
Grading
Lumber was visually graded according to the grading rules provided in the Chinese timber design code, GB50005-03 (MOHURD 2005). During grading, the grade controlling defects and maximum strength reducing defects (MSRD) were identified and recorded for each specimen. All samples were stored in a conditioning chamber maintained at 20 °C, and 65% relative humidity before testing.
Testing
Compression tests were conducted according to GB/T28993 (SAC 2012) for the compression group using a compression testing machine (Universal Testing Machine, We-1000B, Jinan Kaien Testing Machine Company, Jinan, China) to evaluate the compression strength parallel to the grain for each specimen. The test procedures can be summarized as: short column method (without lateral support), 250 mm test spans, and tests conducted at a loading rate to cause failure within 10 min. Because the short column method was employed, several samples needed to be cut from the lumber in length. One of the samples was selected as the representative of the lumber according to its strength properties. Two samples were sawn from each Ic grade specimen: one containing MSRD and the other with no clear defects. The compression strength values of each Ic grade specimen were derived from the lower strength value of the two samples. For the IIc, IIIc, and IVc grades, three samples were taken from each of the specimens: one containing MSRD, the second with minor defects, and the third without defects. The compression strength value was determined from the lowest strength value of the three samples.
The annual ring width (ARW) and density for each specimen was measured near the rupture location according to the national standards GB/T1930-2009 (SAC 2009a) and GB/T1933-2009 (SAC 2009b). The numbers and basic physical properties of the samples are shown in Table 1.
Table 1. The Numbers and Basic Physical Properties of the Samples
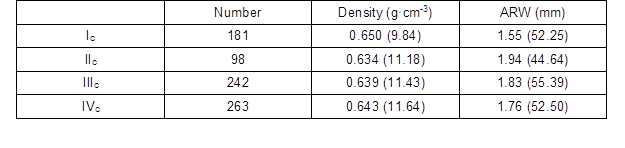
Note: Density is air dried density. Values in parentheses are coefficients of variation (%); ARW is average to annual ring width.
Statistical Analysis
The statistical analysis and the associated graphics were performed using Matlab 7 (MathWorks, USA), Origin 9.0 (OriginLab, USA), and Microsoft Office 2013 (Microsoft, USA) software. UCS between each grades were compared using analysis of variance (ANOVA). The ultimate compression strength (UCS) distribution of each grade was fitted to normal, log-normal, and 2P-Weibull distributions (Bodig and Jayne 1982; Zhong and Ren 2014), respectively. The mean values, standard deviations (SD), and the coefficient of variations (CV) were determined for each UCS. The design value of the UCS strength was calculated using the estimated best-fit distribution, based on the first-order second-moment reliability analysis method, and the allowable stress method.
Reliability Analysis
To determine the UCS design value, resistance stress (R) of the 40 x 65 mm Chinese larch lumber, based on full size test results, was calculated using Eq. 1. The mean value and the CV of R were calculated using Eqs. 2 and 3 (MOHURD 2005; Wang 2002),
![]() (1)
(1)
![]() (2)
(2)
![]() (3)
(3)
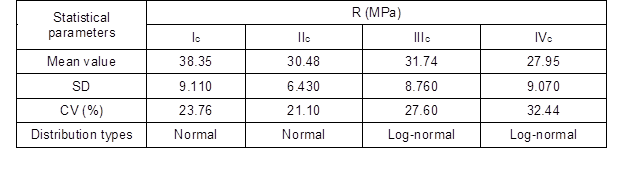
where, K1, K2, and K3 are the adjusting factors for the equation’s precision, geometric character, and effects of long-term load, respectively (Table 2), and ƒ0 is the experimental UCS value for 40 x 65 mm Chinese larch lumber (Table 4 and 5). According to the statistical theory, the R value is also distributed log-normally.
Table 2. Statistical Parameters of Adjusting Factors

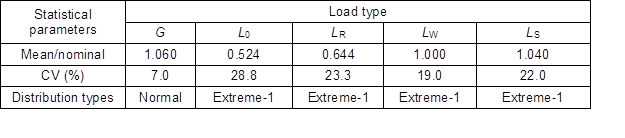
The loads that were applied to the timber structures were divided into two groups: dead load (G) and live load (L). The former included the self-weight of the structural members and other materials, while the latter included the office occupancy load (LO), the residential occupancy load (LR), the wind load (LW), and the snow load (LS). According to GB50009 (MOHURD 2012), normal distribution was used to express the randomness of G, and extreme type-I (Extreme-1) distribution, commonly used to represent the distribution of different live loads, expressed the randomness of LO, LR, LW, and LS. Statistical parameters of the loads are shown in Table 3.
Table 3. Statistical Parameters of Load Types
Next, the two-load combinations: G + LO, G + LR, G + LW, and G + LS underwent reliability analysis testing (MOHURD 2005). The limit state design equation for compressive resistance can be expressed as,
![]() (4)
(4)
where ƒ is the design value, aD and aL are the dead load factor (1.2) and live load factor (1.4), respectively, DK and LK are the nominal dead load and the nominal live load, respectively, and KS is an adjusting factor for the service life, defined as 1.0 for 50 years (MOHURD 2012).
The performance function, developed for relative compressive resistance and the effect of loads under first-order second-moment reliability analysis, is as follows (Zhuang 2004; Li 2011),
Z=R-(D+L) (5)
where, R, D, and L are the random variables representing the compressive resistance, dead load (G), and live load (LO, LR, LW, or LS), respectively. The random variable, R, was assumed to be log-normally distributed according to the analysis above.
By substituting Eq. (4) into Eq. (5), the performance function can be rewritten as,
![]() (6)
(6)
where, ρ, g, and l are the equivalent of LK/DK, D/DK, and L/LK, respectively.
RESULTS AND DISCUSSION
Results for the specimen number, the mean value, SD, and CV of the UCS of the lumber samples are shown in Table 4.
Table 4. Statistics for the Ultimate Compression Strength of the Samples
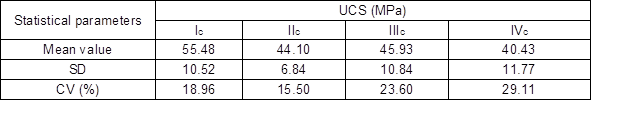
It was found that the Ic lumber exhibited the highest compression strength. The mean value of UCS for grade Ic was 55.48 MPa, with a CV of 18.96%. Although grade IIc exhibited a lower mean UCS (44.10 MPa) than grade IIIc, its CV (15.50%) was lower than that of other three grades. In some cases, IIIc lumber was stronger than IIc lumber, even though the latter should have smaller knot sizes, according to grading rules in the GB50005-03 (MOHURD 2005). This was also confirmed in the test result of the mechanical properties of Canadian coastal Douglas-fir and Hem-fir (Chen et al. 2009; Zhong and Ren 2014).
The UCS mean values exhibited significant (p<0.05, F-test ANOVA) differences between each grade of the dimension lumber. This was consistent with the research of Jiang et al. (2012). Notably, Guo et al. (2011) reported that the bending strength, ultimate tension strength, and compression strength of Chinese fir also exhibited statistically significant differences between the three different grades of lumber at the p < 0.01 significance level.
The normal, log-normal, and 2P-Weibull distributions were fit to the mechanical properties of wood. The optimal distribution in describing UCS should be found to determine reliability index and then to calculate the design values of the 40 x 65 mm lumber. The basic fitted parameters were important in determining the corresponding distributions. The basic fitted parameters of each distribution are shown in Table 5. For the four grades of lumber, these fitted models of UCS were based on the basic fitted parameters and experimental histograms for Chinese larch lumber, as shown in Fig. 1. Differences between the normal and log-normal distributions existed in UCS, where the normal distribution fits grade Ic and IIc better, while the log-normal distribution fits the other two grades better. The log-normal distribution was slightly better than the 2P-Weibull distribution in fitting the data of UCS. This was particularly evident in the left tail region for both grades, where the log-normal distribution followed the actual strength data more accurately. In consideration for the numbers of different grade samples, grades Ic and IIc had much fewer samples than grades IIIc and IVc (Table 1), and the log-normal distribution was more suitable for the distribution of grades IIIc and IVc. Also, Anderson-Darling goodness of fit test has been done and the results in Table 6 indicate that the normal distribution fits grade Ic better, while the log-normal distribution fits the other three grades better. In conclusion, the log-normal distribution for UCS was selected for final reliability analysis in this study.
Table 5. The Basic Fitted Parameters of Each Distribution
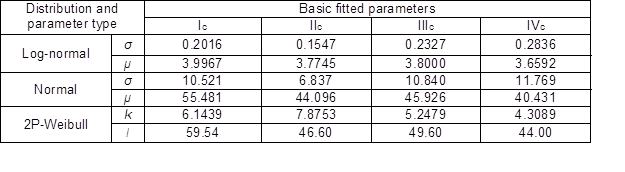
Note: μ is the location parameter and σ is the scale parameter for log-normal distribution (Kleiber and Kotz 2003); μ is the mean or expectation and σ is its standard deviation in normal distribution; k is the shape parameter and l is the scale parameter for 2-P Weibull distribution
Table 6. Results of Anderson-Darling Goodness of Fit Test
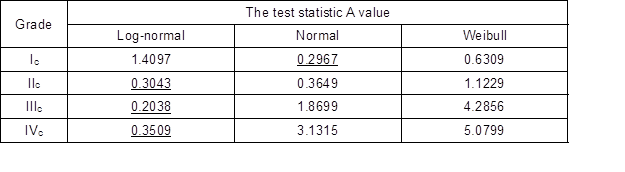
Note: A is the test statistic of Anderson-Darling goodness of fit Test. And the best-fitted distribution has the smallest value of A.
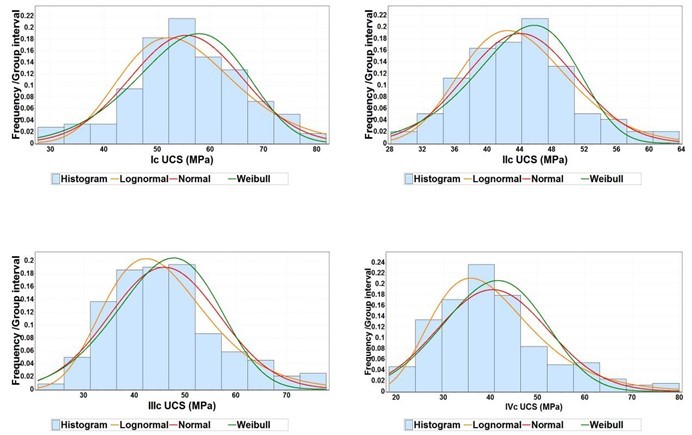
Fig. 1. Normal, log-normal, and 2P-Weibull best fit modulus for the UCS of the samples
Results of Reliability Analysis
Calculated mean value and the CVs for all lumber grades are presented in Table 7.
Table 7. Summary of Statistics for R of 40 x 65 mm Chinese Larch Lumber
The reliability level, which must meet the target level (β0=3.2), was used to determine the UCS design value (MOHURD 2001). This was acquired by taking an average of the reliability index under the combinations of two loads: ρ = 0.25, 0.5, 1.0, and 2.0 (Fig. 2) according to the survey of the timber structure in China (MOHURD 2005; MOHURD 2012).
In order to determine the UCS design value of 40 x 65 mm Chinese larch dimension lumber, a first-order, second-moment reliability analysis was performed on all the data cells and simulation load cases, G + LO, G + LR, G + LW, and G + LS. For instance, the relationship between the reliability index (β) and the design value of UCS (ƒ) of 40 x 65 mm Chinese larch lumber, for both LO and G, are shown in Fig. 2.
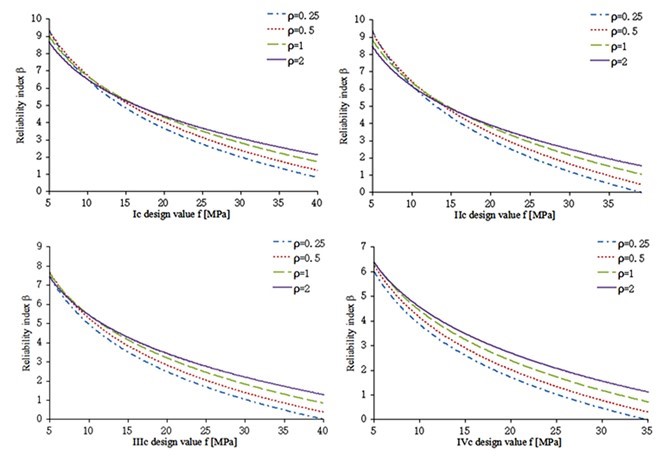
Fig. 2. Relationship between the reliability index (β) and the design value (ƒ) for G + LO
Reliability analysis results indicated that the β value decreased non-linearly with the increase in the design value for all simulation load cases. Similar results were obtained in previous studies (Folz and Foschi 1989; Zhuang 2004; Li 2011). A calculation program for β was developed in Matlab 7.0 software. Reliability results of the 40 x 65 mm Chinese larch lumber for different load combinations are shown in Table 8.
Table 8. Reliability Index β of 40 x 65 mm Chinese Larch Lumber for Different Load Combinations
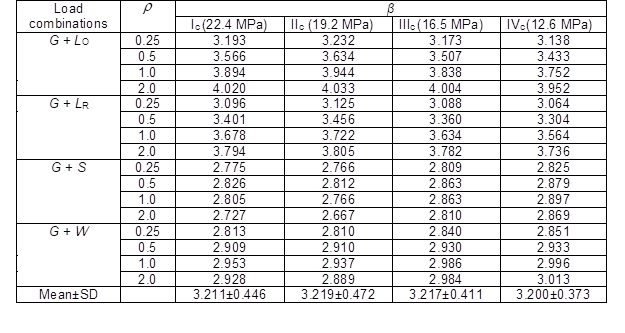
Note: Values in parentheses are design values
According to the reliability analysis and the requirements for the minimum reliability indexes (β ≧ β0 ) (MOHURD 2001), the mean β for all load combinations was 3.211 for grade Ic, 3.219 for grade IIc, 3.217 for grade IIIc, and 3.200 for grade IVc. Additionally, it was found that the simulation load case for the maximum and minimum β were the load combinations G+L0 and G+Ls, for the same ρ value, respectively (Zhuang 2004; Li 2011). For example, the value of β for grade Ic lumber was 3.150 under G + L0, and 2.855 under G + Ls, when ρ was 0.25.
Results of Allowable Stress Analysis
In order to determine the UCS design values according to the allowable stress analysis method, characteristic values of the 40 x 65 mm Chinese larch dimension lumber were calculated. The characteristic value was determined using the 5.0% fractile of the probability distribution (MOHURD 2001). A summary of log-normal statistics for the compression strength of the 40 x 65 mm Chinese larch dimension lumber is shown in Table 9. The characteristic value ƒk and design value ƒ were calculated using Eqs. (7-8) (MOHURD 2008),
![]() (7)
(7)
ƒ =Kfƒk (8)
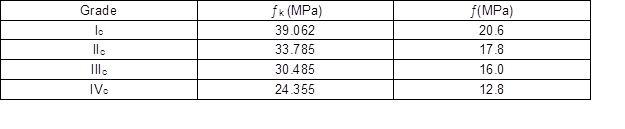
where, μƒ is the mean value of the logarithmic UCS, δƒ is the CV (%) (Table 9), and Kf is the reduction factor of UCS, defined as 1/1.9, according to ASTM D2915 (2003). The characteristic values of Chinese larch visually-graded dimension lumber and the design values were calculated according to United States Code as shown in Table 10.
Table 9. Summary of Log-Normal Statistics of the Compression Strength of the Samples
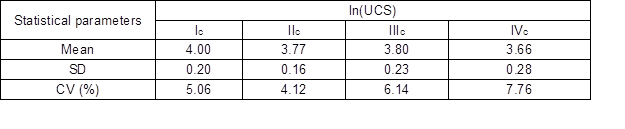
Table 10. The ƒk and ƒ of the Compression Strength of the Samples
Comparison
A comparison among the design value results among Chinese Code, the reliability analysis method based on Chinese National Standards, and the allowable stress method of North America are shown in Table 11. The design value of the compression strength for ungraded Chinese larch lumber is 15 MPa according to GB50005-03 (MOHURD 2005). However, the values were 22.4 MPa for grade Ic, 19.2 MPa for grade IIc, 16.5 MPa for grade IIIc, and 12.6 MPa for grade IVc, on the basis of the reliability analysis method (Table 8). The design values were 20.6 MPa for grade Ic, 17.8 MPa for grade IIc, 16.0 MPa for grade IIIc, and 12.8 MPa for grade IVc, based on the allowable stress method. The strength value of Chinese larch originating from GB50005-03 (2005) was lower than all values of grade Ic, IIc, and IIIc originating from the reliability analysis method based on full-size in-grade test and the allowable stress method. However, the design value originating from GB50005-03 (2005) was higher than those two values of grade IVc respectively by the reliability analysis method and the allowable property method. The design values obtained from GB50005-03 (2005) could be further recommended according to the visual grades of the dimension lumber instead of the tree species. The design values of grades Ic, IIc, and IIIc that were developed using the reliability analysis method, according to Chinese national codes, were slightly higher than those values originating from the allowable stress method of North America. For the determination of the design value, higher visually-graded dimension lumber may be more applicable for the allowable stress method, while the reliability analysis method may be more appropriate for lower grade lumber. The results indicated that it is unreasonable for the design value of the UCS for Chinese larch to equal 15 MPa for all grades of lumber in the Chinese National Standard GB50005-03 (MOHURD 2005), and the value may be unsafe for timber structure design for low visually-graded lumber. The design value of dimension lumber should therefore be calculated carefully before practical applications to ensure the safety of Chinese larch building construction.
Table 11. Comparison of the Design Values Determined by Different Methods
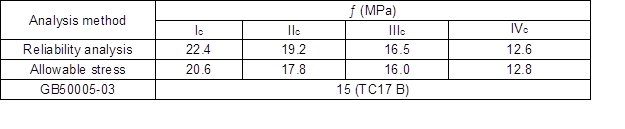
Note: TC17 B is the grade of Chinese larch wood
CONCLUSIONS
- The optimized, fitted distribution of UCS for 40 x 65 mm Chinese larch visually-graded dimension lumber was the log-normal distribution.
- The visual grades of the dimension lumber exhibited significant effects on the design values of the UCS. The design values of the grades Ic and IVc represented the maximum and the minimum, respectively.
- For grades Ic, IIc, and IIIc, the design values developed using the allowable stress method were much more conservative than those obtained using the reliability analysis method.
- For grade IVc, the reliability analysis method is an appropriate method to quantify design values of 40 x 64 mm Chinese larch lumber.
- The influence of appearance quality on strength should be taken into consideration when using the recommended design value in GB50005.
ACKNOWLEDGMENTS
Technical guide for this project was provided by the Forintek Corp. in Canada and the Forest Product Lab in America. Great appreciation was given to Professors, Conroy Lum and Chun Ni in Forintek Canada.
REFERENCES CITED
ASTM D1990-07. (2007). “Standard practice for establishing allowable properties for
visually-graded dimension lumber from in-grade tests of full-size specimens,” American Society for Testing and Materials International, West Conshohocken, PA, US.
ASTM D2915-03. (2003). “Standard practice for evaluating allowable properties for grades of structural lumber,” American Society for Testing and Materials International, West Conshohocken, PA, USA.
Bodig, J. and Jayne, B. A. (1982). “Mechanics of wood and wood composites, Part 9: determination of mechanical properties,” Van Nostrand Reinhold Company, New York, USA.
Chen, Y., Barrett, J. D., and Lam, F. (2009). “Mechanical properties of Canadian coastal Douglas-fir and Hem-Fir,” Forest Products Journal 59(6), 44-54.
Folz, B., and Foschi, R. O. (1989). “Reliability-based design of wood structural systems,” Journal of Structural Engineering 115(7), 1666-1680. DOI: 10.1061/(ASCE)0733-9445(1989)115:7(1666)
Guo, W., Ren, H. Q., Fei, B. H., and Lu. J. X. (2011). “Mechanical properties of three grades of Chinese fir dimension lumber,” Scientia Silvae Sinicae 47(11), 139-143.
DOI: 10.11707/j.1001-7488.20111122
Jiang, J. H., Lu, J. X., Ren, H. Q., and Long, C. (2012). “Effect of growth ring width, pith and visual grade on bending properties of Chinese fir plantation dimension lumber,” European Journal of Wood & Wood Products 70(1-3), 119-123.
DOI: 10.1007/s00107-011-0529-z
Kleiber, C., and Kotz, S. (2003). “Lognormal distributions,” Statistical Size Distributions in Economics and Actuarial Sciences, John Wiley & Sons, Inc., Hoboken, NJ. DOI: 10.1002/0471457175.ch4
Li, T. E. (2011). Determining the Strength Design Values of Wood Based on the Reliability Requirements, Ph.D. Thesis, Harbin Institute of Technology, Harbin, China.
Liu, Y., and Zhao, G. (2003). “Wood materials science, Part 9: defects in timber,” China Forestry Publishing House, Xicheng District, Beijing, China.
MOHURD GB50068. (2001). “Unified standard for reliability design of building structures,” Ministry of Housing and Urban-Rural Construction of the People’s Republic of China, Haidian District, Beijing, China.
MOHURD GB50005-03. (2003). “Code for design of timber structures,” Ministry of Housing and Urban-Rural Construction of the People’s Republic of China, Haidian District, Beijing, China.
MOHURD GB50005-03. (2005). “Code for design of timber structures,” Ministry of Housing and Urban-Rural Construction of the People’s Republic of China, Haidian District, Beijing, China.
MOHURD GB50153. (2008). “Unified standard for reliability design of engineering structures,” Ministry of Housing and Urban-Rural Construction of the People’s Republic of China, Haidian District, Beijing, China.
MOHURD GB50009. (2012). “Load code for the design of building structures,” Ministry of Housing and Urban-Rural Construction of the People’s Republic of China, Haidian District, Beijing, China.
NLGA (2005). “NLGA standard grading rules for Canadian lumber,” National Lumber Grades Authority, Burnaby, British Columbia.
SAC GB/T28993-2012. (2012). “Standard test method for mechanical properties of structural lumber,” Standardization Administration of the People’s Republic of China, Haidian District, Beijing, China.
SAC GB/T1930-2009. (2009a). “Test method for ring width of small clear wood,” Standardization Administration of the People’s Republic of China, Haidian District, Beijing, China.
SAC GB/T1933-2009. (2009b). “Test method for density of small clear wood,”
Standardization Administration of the People’s Republic of China, Haidian District, Beijing, China.
Wang, Y. W. (2002). “Reliability analysis on timber structure,” Building Science Research of Sichuan 28(2), 1-2. DOI: 10.3969/j.issn.1008-1933.2002.02.001
Yuan, D., Wang, X. H., Fei, B. H., and Du, M. (2011). “Status and advantage analysis of developing modern wood construction in China,” Forestry Economics 10, 61-63, 67.
Zhong, Y., and Ren, H. (2014). “Reliability analysis for the bending strength of larch 2×4 lumber,” BioResources 9(4), 6914-6923. DOI: 10.15376/biores.9.4.6914-6923.
Zhou, H. B. (2012). “Current and future status of wood structure in China: Part I,” China Wood Industry 26(1), 7-10. DOI: 10.3969/j.issn.1001-8654.2012.01.002
Zhou, H. B., Han, L. Y., Ren, H., and Lu. J. (2015). “Size effect on strength properties of Chinese larch dimension lumber,” BioResources 10(2), 3790-3797.
DOI: 10.15376/biores.10.2.3790-3797
Zhuang, X. (2004). Reliability Study of North American Dimension Lumber in the Chinese Timber Structures Design Code, Ph.D. Thesis, Shanghai University, Shanghai, China.
Article submitted: July 27, 2015; Peer review completed: October 4, 2105; Revised version received: October 30, 2015; Accepted: October 31, 2015; Published: November 24, 2015.
DOI: 10.15376/biores.11.1.651-662