
Abstract
Crack growth that takes place in natural fibre polymer composite formations is dependent on several factors, whereby primary crack size is a key aspect that influences uncertainty of the crack growth. The nucleation stage is strongly affected by the fracture collapse of structures, unavoidably affecting the accuracy of the estimation of total fatigue life. In this research, fatigue crack was examined using rice husk/polypropylene composite specimens across stress loads ranging from 80 to 90% for ultimate tensile strength at the stress ratios R=0.1, 0.3, and 0.5. Consequently, the propagation rate of the crack was dependent on the stress ratio. Crack resistance showed a drop in the propagation rate of the crack rate with an increase in the R value. This effect produced more fibres/matrix fracture at high stress ratio, in comparison to the low stress ratio, which was verified further through scanning electron microscopy. Moreover, the S-N curve method was proposed, as it facilitates the deterministic total fatigue life discovery in a highly favorable manner via equivalent crack size approach. A strong consensus was observed between the model of prediction and the outcomes of the experiment.
Download PDF
Full Article
Crack Growth Analysis for Rice Husk Reinforced Polypropylene Composite Using Equivalent Initial Flaw Size Concept
Sity Ainy Nor Mohamed,a Edi Syams Zainudin,a,b,* S. M. Sapuan,a,b Mohd Azaman Md. Deros,c and Ahmad Mubarak Tajul Arifin d
Crack growth that takes place in natural fibre polymer composite formations is dependent on several factors, whereby primary crack size is a key aspect that influences uncertainty of the crack growth. The nucleation stage is strongly affected by the fracture collapse of structures, unavoidably affecting the accuracy of the estimation of total fatigue life. In this research, fatigue crack was examined using rice husk/polypropylene composite specimens across stress loads ranging from 80 to 90% for ultimate tensile strength at the stress ratios R=0.1, 0.3, and 0.5. Consequently, the propagation rate of the crack was dependent on the stress ratio. Crack resistance showed a drop in the propagation rate of the crack rate with an increase in the R value. This effect produced more fibres/matrix fracture at high stress ratio, in comparison to the low stress ratio, which was verified further through scanning electron microscopy. Moreover, the S-N curve method was proposed, as it facilitates the deterministic total fatigue life discovery in a highly favorable manner via equivalent crack size approach. A strong consensus was observed between the model of prediction and the outcomes of the experiment.
Keywords: Crack growth; Fatigue; Fiber-reinforced composite; Fracture; Life prediction
Contact information: a: Department of Mechanical and Manufacturing Engineering, Faculty of Engineering, Universiti Putra Malaysia, 43400 UPM Serdang, Selangor Darul Ehsan, Malaysia; b: Laboratory of Biocomposite Technology, Institute of Tropical Forestry and Forest Products (INTROP), Universiti Putra Malaysia, 43400 UPM Serdang, Selangor, Malaysia; c: School of Manufacturing Engineering, Universiti Malaysia Perlis, Kampus Alam Pauh Putra, 02600 Arau, Perlis, Malaysia; d: Department of Materials and Design Engineering, Faculty of Mechanical and Manufacturing Engineering, Universiti Tun Hussein Onn Malaysia, 86400 Batu Pahat, Johor, Malaysia;
* Corresponding author: edisyam@upm.edu.my
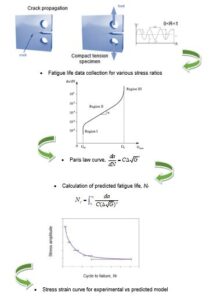
GRAPHICAL ABSTRACT
INTRODUCTION
Fibre-reinforced polymer composites (FRPs) are generally selected because of their highly useful properties across different engineering applications, especially the attributes of extremely precise stiffness and strength (Srinivasa and Bharath 2011). These composites are tested in different types of variable or constant-amplitude fatigue loads during their functional life-cycle in a majority of the cases. For structural applications, these materials need to display exceptional static mechanical attributes in combination with excellent fatigue and fracture resistances. Compared with a single crack noted in the metals, these composite materials fracture due to several failures across multiple modes. This effect is observed via sample volume with failure including matrix cracks, fibre breakage, and interfacial de-bonding (Abo-Elkhier et al. 2014).
In composite materials, fibres are regularly surrounded by matrix materials. The external loads (force) applied to the material composites are partly borne by the matrix and partly by the reinforcement. In general, the external loads are directly charged to the matrix. Under cyclic loading conditions, some loads are transferred to the fibres, while some are transferred to fibres through their end surface (Fragoudakis 2017). The fatigue damage mechanism of fibre-reinforced composites is more complex. Fatigue failure depends on the resilience and strength of the matrix in holding the fibres to create strong interfacial bonding as well as being a barrier in the propagation of fatigue cracks. In the study of Liang et al. (2014), a comparison of fatigue behavior for tension-tension loads on flax/epoxy and glass epoxy composites, the results showed that the higher static strength of composite led to a high resistance to fatigue load. The bonding of the interface between the fibre and matrix helps to maintain its chemical and mechanical properties.
Metals usually display crack growth that steadily increases under fatigue load, whereas polymer composites show crack multiplication that slow down over time (Jollivet et al. 2013). Therefore, fatigue crack growth (FCG) is a stochastic failure method, which makes it practically unachievable to forecast the final fracture in polymer composites. Thus, composite specimens are put through extensive experimental evaluations to find their fatigue strength. Several structural elements are essential, rendering life estimation and reliability predictions as significant for their design and maintenance planning. Such evaluations remain a challenge, although there have been several efforts made in the previous few decades. Above all, the reliable design can be classified into a group of approaches of estimating life cycle, whereby the method is dependent on material stress life which depends on stress life (S–N) (or based on strain life, e–N) attributes; representing a damage accumulation rule (Shah et al. 2013). Such samples are put through testing for failure to describe fracture or crack initiation observed in samples, hence yielding the subsequent cyclic life. Consequently, the cyclic life across various alternating stresses work as the fundamental for designing a part against fatigue failure.
The reliable design concept is important in the creation of damage tolerance methodology. Before the introduction of damage tolerance, reliable designs were used primarily for aircraft structure (Zhou and Fleury 2016). The failure or partial failure of structure element should not have an impact on the overall structural reliability (De Castro et al. 2010). Fundamentally, safety and health monitoring in structure is meant to protect against any unforeseeable failure from fatigue cracks and primary flaws, whereby damage-resilient models that can be used to resolve the behavior of these damages have still not been developed. Even though the fail-safe approach does not require rigorous and costly examination techniques, the protective impact enables the structure to maintain proper residual strength before defect or damage is detected via examination during routine service maintenance. Nonetheless, the problem related to fail-safe design is the way in which redundant structural systems introduce additional weight penalties. Therefore, the damage tolerance technique (Tomasi et al. 2019) is essential to shift from a design based on redundancy to one based on crack tolerance.
In such an approach, fracture mechanics serves as the physical basis for damage tolerance assessment based on crack growth measurement. Nonetheless, fracture mechanics-based life estimation is hampered by the issue of determining the primary crack size in order to analyze the crack growth. In effect, recent adoption of LEFM (linear elastic fracture mechanics) and its standards enables one to: (1) assure adequate material toughness at the initial life cycle, and (2) allocate flaw assessment processes for any defect occurred during service. The principles for flaw acceptability and unit operation without restoration can thus be developed. Nonetheless, the LEFM methodology is not a typical alternative for the S-N methods, as it requires a crack to exist even initially. The S-N method remains implementable in situations where crack commencement takes up a large portion of the element lifetime; this is specifically crucial when considering the cycles towards commencement (contrasted with failure).
The literature explains various techniques to estimate the fatigue life of structural elements. In spite of its wide application to represent rate of FCG in metals (Chowdhury and Sehitoglu 2016), the Paris equation is restricted to fortified fibre composites. This equation concentrates on the minimum and maximum stress changes in the fatigue cycle. Therefore, the effect of stress on crack propagation and growth of fibre/matrix is ignored for isotropy material. Estimation based on the crack growth assessment has been placed to measure the residual fatigue life of the elements, thus requiring an initial flaw to be outlined (Xiang et al. 2010). In contrast, the crack growth and fracture mechanics-based fatigue estimations may be appropriate for an all-inclusive fatigue life simulation of the structural parts, assuming that initial faults are steadily present on the materials and act as the equivalent primary cracks.
In traditional approach, the weaker part of total life forecast is the estimated time the crack initiation where the initiation is a size that can only be detected by nondestructive inspection technique (NDT). The idea of equivalent initial flaw size (EIFS) is an approach that assumes there is a small crack present from day one and it grows from day one. The EIFS is then be used as a starting point for use on other similar structures to estimation the process of crack initiation and progression.
Various methods that derive from this approach to predicting fatigue life have been implemented by many researchers. Correia et al. (2016) accomplished EIFS calculations in accordance with a double-plate fatigue test, using a finite-element model in order to compensate for the stress R-ratio. The strategy illustrates maximum fatigue life in the approximation of initial flaw size. In evaluating equivalent crack size, the recommended strategy involves only limited sets of experimental data and discards the need to measure for original crack size. In accordance with a comparative study performed by Al-Mukhtar et al. (2010), the computational precision of the probabilistic total-fatigue life assumptions, which derive from the recommended approach to calculating respective crack sizes, seemed to be acceptable.
This particular strategy was applied to a rice husk-reinforced polypropylene composite, which was evaluated through its FCG data with use of compact tension specimens that feature a range of stress R-ratios. The evaluation suggests estimated EIFS by applying the back-extrapolation computation. The crack propagation model operates by integrating LEFM from the initially-observed crack until total failure is recognized within the model. The benefit of this strategy is that a range of crack growth assumptions will be produced with various initial flaw sizes without computational intricacy. The highest correlation between the set of prediction data and experimental analysis was established via this technique. The performance of each prediction was subsequently analyzed, confirmed, and then discussed as a result.
THEORETICAL BACKGROUND
Crack Propagation Life Prediction in Equivalent İnitial Flaw Size Concept
The absence of initial material flaws in any system is difficult to detect; therefore the initial flaw size resolution is converted into a measurement based on experimental findings, such as S-N data or fractographic images. Applying experimental S-N data on its own enables determination of critical-flaw size at the onset of failure (Liu and Mahadevan 2009). Observed flaws do not always propagate from the original defect with comparable sizes. Accordingly, Rudd and Gray (1978) (Liu and Mahadevan 2009) introduced the EIFS model, which was further developed by Yang and Manning (1980) (Molent 2010) as an approach for analysing and characterising the initial quality of a material’s structural information through durability analyses.
Fatigue quality assessments of critical components are commonly characterised through the EIFS approach, which was devised to establish initial crack sizes and thereby enable fracture mechanics-based materials life prediction by accounting for their initial qualities. Such qualities may stem from both the manufacturing as well as bulk material characteristics of specimen structural details. Such EIFS computation is generally carried out via the back-extrapolation approach, which applies FCG analysis by yielding an extrapolated initial crack size and geometry that complements failure data for the material (stress-life). By itself, the technique is termed EIFS due to its methodical realisation of initial crack sizes via trial and error. It serves functionally as the initial crack length when estimating crack growth (Kim et al. 2011), which provides the EIFS with a simulated crack length that yields the equivalent modelled fatigue life as acquired in standard fatigue testing.
The three commonly utilised techniques for generating EIFS estimations comprise the: (1) Back-extrapolation, (2) Kitagawa-Takahashi (KT) diagram, and (3) Time-to-Crack initiation (TTCI) methods (Shahani and Kashani 2013). The back-extrapolation method seeks the initial crack size exhibiting life similar to the experimental fatigue life of the specimen under investigation, via simulations of crack growth. The KT diagram technique joins the concept of fatigue failure not arising at the fatigue limit of the S-N strategy, with that of the non-growth of the crack being lower than the stress intensity factor (SIF) analytical threshold of LEFM. In the meantime, the TTCI technique approximates the initial size of the crack according to a fitting curve that denotes the association between crack cycle and size, based on the measurement history of the crack size.
Predicting the rate of crack growth based on the initial defect size and establishing the initial defect size in highly-filled polymeric substances has been comprehensively studied. Therefore, the goal of the EIFS technique is to examine the concept of crack growth rate prediction based on the initial defect size (Zhang et al. 2018), besides determining the initial defect size present in a granular composite material. Thus, different crack growth prediction models can be employed to describe the crack growth behaviour. For example, fatigue life can be determined by incorporating the curve of FCG rate, which may be represented in the form of the Paris model. In contrast, the life of a compact tension sample may be determined through Eq. 1,
 (1)
(1)
where da/dN represents the crack growth rate, a represents the crack size, N denotes the fatigue life, and
∆K represents the SIF range (Han et al. 2015). When put through continuous amplitude loading, ∆K represents a function of crack size a, and Y represents the geometry factor of the specimen, whereby the crack growth rate can be represented as (Rana and Sadaphale 2015),
 (2)
(2)
The LEFM has been mostly adopted to assess the breakage of the composites. Particularly, the SERR (strain energy release rate) (Yao et al. 2017a) shown in Eq. 3 is a common and standard parameter for fracture governing upon evaluating fracture strength for composites, as against the SIF for metals. The SERR is as expressed in Eq. 3, where K represents SIF, while E represents elastic modulus,
 (3)
(3)
 (4)
(4)
 (5)
(5)
Alternatively, crack growth rate is expressed by da/dN, where G denotes SERR, whereas C and n represent curve fitting parameters. Fatigue life, denoted by Nf, may be represented by using the initial crack size, denoted by ai, and the critical crack size, denoted by af, at failure (Alderliesten et al. 2018).
EXPERIMENTAL
Specimen Preparation
The study was carried out by using rice husk reinforced polypropylene composites (Fig. 1) that comprised 35 wt% rice husk fibres and 2 wt% Struktol, while the remaining percentage was made up of polypropylene, which functioned as the polymer matrix. In Ghosh et al. (2011), the reinforcement action of fibres is only observed once the fibres volume exceeds the critical volume. In short fibres composite, the value ranges from 33% to 46%, which implicitly illustrates the minimum fibres content. The rice husk size was kept at 100 to 500 µm in size, as there is an increase in the composite density with a decrease in the particle size as filler. Fine-sized particle fillers that are uniformly dispersed in the matrix offer exceptional adhesion to the fibre-matrix interface (Nourbakhsh et al. 2010; Wahyuni and Soeswanto 2019). Polypropylene was 0.90 to 0.91 gm/cm3 in specific gravity. Struktol TR016 was used as a compatibilizing substance to aid the fibre-polypropylene matrix interaction and set at 2% according to a previous study. It is a blend of fatty acid metal soap and an amide. It acts as an efficient blending or dispersing agent in highly filled systems, providing a more uniform and homogenous initial mix between fibres and matrix (Ibrahim et al. 2014). The work examined the effects of compatibilizing agents on the mechanical behaviour and the interface of polypropylene/hemp bast fibre biocomposites, which effectively yielded improved compatibility between the matrix and the reinforcement. Compatibilizer loading facilitates restructuring, penetration, and stratification of the polymer particles interface of the fibre-matrix, and also increases the interfacial bond strength (Arjmandi et al. 2015). The granulate of polymer composite compounding was obtained from SIRIM, Shah Alam, Selangor, Malaysia. The test sample was produced via injection moulding method by using a 60-tonne, MA600 II/130-HAITIAN machine (Absolute Machinery, Worchester, MA, USA) for injection moulding, as shown in Fig. 1.

Fig. 1. 60-Tonne injection molding machine
Fatigue Crack Growth Test
With the purpose of determining the fatigue life distribution, FCG examination was carried out based on constant amplitude cyclic loadings. Figure 2 shows the test specimen of this research in accordance with ASTM E 647 (2014). The lines for crack length crack length show distances of 2 mm along the direction of crack propagation. The lines serve as reference to capture adequate life cycles. During the fatigue examination, the adherence of the fatigue specimen was assessed at the initial phase of the fatigue examination, in which the load was raised in steps before whole load was attained, and in which the specimen was later allowed to cycle between minimum and maximum loads for the life duration (Pach et al. 2012). The examination was repeated 5 times in accordance with ASTM E 647 (2014). The specimens were examined with constant amplitude cyclic loading until rupture occurred. The cyclic examination was carried out under the load control mode using a Servopulser EHF-E (Shimadzu Corporation, Kyoto, Japan), as displayed in Fig. 3. The constant amplitude load included a sinusoidal shape at 3 Hz, and the specimens were evaluated at a minimum of three stress levels (80%, 85%, and 90% of ultimate tensile strength). The number of cycles noted at visible crack was at every crack length of 2 mm (Kim et al. 2013). The crack length was gauged at various stress ratios to detect the crack propagation in compliance to the tension-tension mode (R = 0.5, 0.3, and 0.1 stress ratios).
Fatigue Life Prediction Based on Back Extrapolation Method
The EIFS can be defined as the initial defect size, in which minimising the cyclic loading will cause a stipulated endurance. With the purpose of computing its value, the back-extrapolation method and FCG principles were used. In this research, the back-extrapolation technique was used to predict the EIFS based on experimental results. In contrast, the KT diagram was judged as not appropriate because of the lack of information about the specimen. The TTCI method seemed inappropriate, as no history of crack growth was noted, and it recorded the least precision of the 3 methods (Shahani and Kashani 2013).

(a)

(b)
Fig. 2. Compact tension specimen, (a) Detail dimension for compact tension specimen, (b) specimen for crack growth test mark every 2 mm length

Fig. 3. Fatigue crack test under tension-tension mode

Fig. 4. Determination of EIFS using back-extrapolation and development of life prediction model
The determination of EIFS based on the back-extrapolation technique applied the same process, irrespective of the kind of crack growth approach used (Fig. 4). When information relating to crack growth history or fatigue life was obtained experimentally, propagation of crack growth was performed while varying the initial size of crack as to find the most appropriate initial size of the crack based on the experimental outcomes. The initial crack size was the only variable in the crack growth propagation, while the other variables, namely SIF, geometry, and loading condition, were used as constant values in the experiment. If the material properties were unknown, they were also considered as variables. In this case, distribution of EIFS was achieved instead of producing only one EIFS value, the initial size of crack that is most appropriate for the experimental result among all the outcomes of the prediction. This method used for predicting the initial size of crack is known as the back-extrapolation technique (Liu and Mahadevan 2009).
Once the crack grew to a specific dimension, the stresses found at the crack tip became excessively higher than the material endurance, thus resulting in fracture. As Kmax approached the fracture toughness KIC, the rate of fracture increased, where the crack was unstable, and the upper value of the integral (af) could be evaluated, as specified by Eq. 6. The critical SIF KIC happened when the specimen exhibited massive fracture; the specimen was subjected to constant strain and the value was ascertained through Eq. 7, where Pmax denotes the load range, W is the specimen width, and denotes a/W, which indicates the length of the crack length (Boonyapookana et al. 2011).
 (fracture toughness concept) (6)
 (7)
(7)
 (8)
(8)
After evaluating a fatigue failure mechanism, an analyst specialising in fracture mechanics assumes that the flaw having a starting size of ai can increase to its final size af or ac, due to cyclic loads exerted through its lifetime. Hence, the length of the final crack, af, was determined using KIC. Lastly, specimen life was forecast using Eq. 8.
RESULTS AND DISCUSSION
Characterization of Crack Growth Behavior
In this study, five specimens were subjected to constant-amplitude load using three defined stress ratios (R=0.1, 0.3, and 0.5). Figures 5, 6, and 7 depict the propagation of the fatigue crack. It was ascertained that the results were linear using the log-log representation. Structural fatigue life is specified as the loading cycle count, after which the structure fails due to cracks. The cycle comprised three primary phases: initiation of the crack, growth of the crack, and failure due to overload. This study focused especially on phase II concerning crack growth (Baptista et al. 2012). During crack growth, its correlation with the SERR was mostly linear on a plot using the log scale on both axes. The Paris law, which uses the SERR factor with a higher power, is apparently in direct proportion to the crack growth rate, as specified in Eq. 1 (Kirane and Bažant 2016).

Fig. 5. Crack propagation rate da/dN vs. SERR for R=0.1

Fig. 6. Crack propagation rate da/dN vs. SERR for R=0.3
From Figures 5, 6, and 7, the FCG curve bends leftward when the value of R increases. It is observed that the higher the load ratio the slower is the disbond growth. This is because the cyclic load range experienced at higher load ratio is much smaller. Consequently, this leads to a slower disbond growth rate. Meanwhile, a lower value of R caused rises in amplitude while giving to higher surface damage and impact to shorter fatigue lives. Yao et al. (2017b) noted the effects of load ratio on fibre bridging as being the predominant reason for slowing FCG in composite materials. When crack formation began, crack closure was observed (refer to Fig. 8), with the fibre debris getting pulled across the surface when increased stress amplitude was required to break the fibre in several sections (Androuin et al. 2018). As per the concept of energy, bridging fibres may lead to the absorption and release of strain energy periodically during fibre unloading and loading. This process raises surface fracture resistance. Nevertheless, these fibres may have zero or negligible contributions to the SERR until failure happens. Therefore, fibre bridging could substantially decrease the progression of fatigue cracks and also slow the fibre bridging process. It may be deduced that the FCG rate is significantly affected by stress ratios. Using the Paris law expression, in the context of SERR, a single parameter range of SERR is not capable of explaining such rate across varying stress ratios (Correia et al. 2016). The Paris equation may be used to determine the FCG behaviour at specific values of R (Huang and Moan 2007; Iranpour and Taheri 2013).

Fig. 7. Crack propagation rate da/dN vs. SERR for R=0.5
Figures 5, 6, and 7 depict clearly various Paris constants values, C and n, for stress ratios in a specified range. The data may be used to compute these values to create the best fit (Johnson 2010), while the coefficients indicate the effects of every event on crack growth. Such a scenario indicates that increasing the FCG rate has similar implications as an increase in C and n values for Eq. 4 (Li et al. 2012). The models employed to forecast FCG progression primarily considered the crack growth and its dependence on cycle-based loading. Fracture toughness may be modelled by expressing the crack-resisting capacity for a previously-cracked material. Additionally, this may be worked out using material sensitivity or the tendency of crack when loaded. Hence, SERRs may be compared to variables concerning fracture toughness to determine if the crack could propagate and in ascertaining the crack size before which a material suffers from fracture. A fracture may be predicted if the strain energy on the material is more than or equal to the fracture resistance of the material ( K (IC) ).
During the onset of the fatigue crack, a specimen may be classified based on the extent of fatigue damage in the context of its fatigue life. The failure of a crack initiation period may be described by a crack of a substantial size. Hence, the specimen may be determined to be at a certain level of its fatigue life or otherwise differentiated to be at its remaining useful life. Such damage remains in a material despite not being visible during inspection. Accordingly, the critical size of a crack may be determined by back-extrapolating the EIFS distribution of the fatigue cracks in line with the equation obtained from the linear relation. This method assumes that at the presence of a pre-existing crack displaying a specific initial length, the specimen life can be estimated using these models. The specimen life derived in a laboratory is juxtaposed with one that is predicted. Determination of EIFS using this particular method may be viewed as a material characteristic.

Fig. 8. Fibre debris spread over the surface that increases fibres fracture resistance
Cracks in composites structures are formed when there are interfaces, for instance, between the matrix and fibres. Interfaces allow the stress to be transmitted, thereby allowing multiple cracks to form, which collectively is termed the damage mechanism (Fig. 8). At the start of the cycle, specimen failure happened due to the creation of microcracks in the rice fibre/polypropylene bunch. During a continuous cycle, an increase in load leads to the growth of the microcracks, which propagate in the matrix. Stress is transmitted from one microcrack to the neighbouring fibre, causing multiple fibres to break. Consequently, there is fibre debris present around the bundle (Fig. 8) (Bougherara et al. 2015). Ultimately, the structure failed entirely due to the increase of microcracks in the group.
The properties of the fibre-matrix interface profoundly impact the performance of a composite reinforced with fibre. The fibres reinforce the structure and are crucial in providing strength, while the matrix combines the fibres to form one structure. Similar to most natural lignocellulose fibres, risk husk is also hydrophilic (Bilal et al. 2014) in contrast to the matrix, which is hydrophobic. A combination of the hydrophobic matrix and the hydrophilic fibre usually leads to a strong bond between the two elements, thereby leading to an interfacing area. Physical effects or chemical cross-links are the two types through which polypropylene and rice husk particles interact (Cardona-Uribe et al. 2018). The compatibility between hydrophobic polymers and hydrophilic fibres increase with the used of Struktol TR016 as compatibilizer. Compatibilizers act as adapters between matrices that provide better bonding in addition to increasing the strength and rigidity of composites by increasing fibre wetting. These substances create chemical bonds with the hydrophilic lignocellulosic filler and also allow the wetting of the polymer chain on the other side. Hence, compatibilizers have hydrophobic and hydrophilic characteristics that facilitate them to attach to the polymer matrix and the lignocellulosic fibre (Dittenber and GangaRao 2012). Physical interaction is regulated primarily through the adsorption of free molecules of the polymer onto the porous filler surface. In contrast, the filler molecule surface and its interaction with free polymer molecules determine the chemical interactions.
Surface fibres suffer from localised stress because it develops due to the presence of cellulose and hydroxyl groups in rice husk and lignin, respectively. Stress leads to deformation and controls its form, which is ultimately responsible for breaks in the polymer (Zaaba and Ismail 2019). The interfacial surface has adhesion bonds, which affect the macroscopic mechanical properties of the composite. Hence, the interface leads to a high level of stress transfer between the fibre and the matrix. Weakly held fibres from the matrix lead to crack formation at the matrix (Fig. 9c) in spite of relatively less stress. In contrast, a fibre having a strong bond with the matrix delayed crack formation. The composite structure failed massively when there was fibre fracture during crack formation. Concerning the matrix and the fibres, there are numerous limitations such as fibre pull-out or interfacial slippage, which contributed to the damage (Fig. 9a). Hence, regulating interfacial properties can determine the performance of composite structures. At the same time, unidirectional composites were observed to have de-bonding at the matrix-fibre interface contributing to the weakness of the interface.
Breaks in fibre were responsible for the failure of a composite material reinforced with fibre (Fig. 9b) (Jollivet et al. 2013). A unidirectional composite having tension loaded in line with the fibres, individual fibres started failing at the weak spots leading to a redistribution of stress among the matrix and the fibres. The fibre-matrix interface facilitated the transfer of stress, wherein stress propagated from the damaged fibre to the neighbouring fibre (Fig. 9d) located at a specific distance, thereby causing additional fibres to break. Increasing the load led to stress propagation from a region having high damage to another having relatively less damage. The critical characteristics of the last load-bearing region or element led to structural failure. In fact, breaking of fibres may be understood as a statistical process, wherein the combination of non-uniform strength and redistribution of stress may be modelled.
Fibre size and dispersion determine whether uniform stress transmission happens (Mohamed et al. 2018). When there is less load, the fibres cannot transfer load to other fibres due to relatively low dispersion at the matrix, thereby leading to some points accumulating all the stress, which causes inadequate mechanical characteristics. At moderate load (i.e., 36 vol% (Özturk 2010)), the transmission of stress is uniform. This is because dispersion, and hence fibre distribution, is satisfactory, and strength increases due to reinforcement. At a high level of load, uncertain dispersion leads to improper bonding between the matrix and the fibres, thereby leading to pull-out. Research indicates that loading fibres up to 42% causes a reduction in composite strength due to improper dispersion at the matrix (Özturk 2010). Moreover, fibre size is a crucial determinant of the material load transfer characteristics. Interfacial adhesion can be enhanced if fibre size is relatively small. Additionally, greater contact area facilitates the interacting surfaces to have strong bonds with the matrix (Norhidayah et al. 2015).
Widespread research has been conducted with an intent to have enhanced interfacial bonds in the context of composites using natural fibres. The most widely used technique uses the application of a coupling agent. Coupling agents are employed before processing, and they enhance composite properties while also maintaining compatibility, leading to better interfacial adhesion between the matrix and the fibres. The effects of the compatibilizer may be attributed to the enhanced wettability provided to rice husk fibre through the use of the polypropylene matrix, thereby leading to better dispersion and more uniform orientation, as depicted in Fig. 9d. Previous research (Renner et al. 2010) reported a change in interfacial adhesion when malleated polypropylene (MAPP) was used. A sample using MAPP could inhibit agglomeration, thereby leading to effective fibre dispersion. In the case of specimens without the coupling substance, there were empty spaces between the matrix and the fibres, which is a sign of weak adhesion. There was higher compatibility due to the narrow gaps between the PP matrix and rice husk fibre, which was indicated by enhanced mechanical characteristics.

Fig. 9. Multiple damages for structure failure, (a) fibre pull-out, (b) fibre break, (c) matrix crack, and (d) adjacent broken fibres
Development of Mathematical Models for Fatigue Life Prediction
The EIFS model may be used to determine total life. Accordingly, a comparison between the estimated and measured life may be expressed by using the S-N curve, thereby allowing the association between stress ranges (S) and loading cycle count (Nf), which may subsequently be used to express structural fatigue life. The S-N diagram may use a logarithmic scale, and the association may be described further using a straightforward relation known as the Basquin’s equation (Bandara et al. 2015), which is depicted through Figs. 10, 11, and 12, along with the summary being provided in Table 1. The stress range (y-axis) is expressed as a function of fatigue life (x-axis). Overall, the S-N curve incorporates the influence of material, loading characteristics, and structural geometry. It has been observed that fatigue life is less when stress amplitude is high, while below a specific stress level, there is zero fatigue (Ribeiro et al. 2011). Therefore, factors such as composite microstructural diversity, distinct constituent properties, nature of interfaces, reinforcement direction, and isotropic attributes collectively form the aspects that determine the micro-level geometrical characteristics of the composite material.

Fig. 10. S-N curve prediction using back extrapolation method and EIFS for R=0.1

Fig. 11. S-N curve prediction using back extrapolation method and EIFS for R=0.3

Fig. 12. S-N curve prediction using back extrapolation method and EIFS for R=0.5
Figures 10, 11, and 12 depict the comparison between calculated and experimental fatigue life for the specimens. Blue lines represent the predictions obtained using the EIFS model, while green lines denote the experimental data. The predicted results were in line with the experimental data and had a similar trend. The coefficient of determination (R2) is mentioned in the figures. R2 is a measure of the degree to which the data points fall on the regression line and is used to assess the fitness of the regression model. The coefficient lies between zero and one, and any value higher than 0.85 indicates a powerful model (Sivák and Ostertagová 2012). It is noteworthy that the coefficient of determination was higher than 0.85 for all stress levels, thereby indicating an appropriate and acceptable relationship was determined using the test results.

As specified in Table 1, empirical modelling was used to formulate the models. The approach was derived for the estimation of fatigue life in a typical way that involves crack initiation on a relatively broad scale of undiscovered morphology concerning the fundamental flaws and the SERR. These S-N curve-based models help describe the outcomes of the fatigue test used for predicting the remaining fatigue life in the context of quantification of damage due to fatigue and the effect of stress ratio. Consequently, the S-N curve serves as the basis for recent fatigue life analyses, and there are several constraints. The difference between the types of materials was not observed comprehensively in the S-N curve model, while the growth line due to fatigue damage varied among the specimens. However, S-N curve characteristics should regularly follow similar conditions for application-based use. These criteria include curve fitting ability, data applicability at varying stress ratios, specimen similarity, and compliance with working processes (Burhan and Kim 2018).
Validation of Fatigue Life Prediction Models
To ascertain the relationship of the mathematically predicted life cycle, and the experimentally observed life cycle of the material, correlation graphs were prepared. Figure 7.12 depicts the experimental and predicted fatigue life for the material, where the x-axis measures experimental life. In contrast, the y-axis measures the predicted life, both of which use the logarithmic scale. Additionally, the plot comprised of two bounds, where the inner and outer bounds considered life factors of 1:2 and 2:1, respectively. Figure 13 depicts the results from the model, which are in line with observations from the experiment. Specifically, over 60% of the points (Lu et al. 2010) were considered to be inside the 1:2 and 2:1 life factor range. Therefore, the predicted results may be accepted (Mohammad et al. 2014).

Fig. 13. Comparisons of predicted and experimental fatigue life
For all evaluated stress ratio, the error in development the mathematical model are measured using the root mean square logarithm error in Eq. 9,
 (9)
(9)
where n denotes the total number of measurements, Nexp is the experimental fatigue life, Npre is the calculated fatigue life. When the ERMSLE values obtained are low, the proposed fatigue life prediction model offers a high fit between the fatigue life calculations and the results of the experiments which summarized in Table 2. Thus, the fatigue life prediction model is accepted and can be used to predict the fatigue life of the material at the same stress conditions (Walat and Łagoda 2014). The estimation technique with minimal error can better predict the material’s stress-fatigue relationship than other approaches (Hariharan et al. 2011).

CONCLUSIONS
- The combined technique aims to develop a predictive model, that is, a crack growth model and a damage reliability model, in predicting the process of onset and development of cracks while determining service life. Experimental models and predictive models plotted on the S-N curve graph to show data trends are the same. The experimental models obtained for stress ratios R = 0.1, R = 0.3, and R = 0.5 are S=35.444N^-0.138 , S=38.340N^-0.130 , and S=32.428N^-0.087 , for which the model gives a coefficient of determination, R2 in the range of 0.92 to 0.99. While the prediction model, gives the coefficient of determination, R2 in the range of 0.89 to 0.99 which are respectively expressed in mathematical representations as S=24.436N^-0.058 , S=46.364N^-0.149 , and S=58.687N^-0.147 . The combination of these approaches becomes a quantitative framework in replacing conventional inspection methods. Therefore, under these load conditions, preventive repairs and monitoring are more easily scheduled, through published mathematical representations.
- The prediction model formed can be used to predict the number of material life cycles. The number of fatigue life predictions is obtained for all stress ratio values. The appropriateness of this equation for describing the behaviour of fatigue crack growth is confirmed by a comparison between the number of fatigue life predictions with the number of fatigue life obtained through laboratory test methods. Verification is based on the error scatter band method, where the distribution of all data points is within the acceptance limits of 1:2 and 2:1. The accuracy of the error dispersion path is verified by statistical analysis through the root mean square logarithm error, E (RMSLE) . The values obtained for R = 0.1, R = 0.3, and R = 0.5 are in the range of 1.5% to 2.5%, where the value of this error is very low. Generally, the correlation obtained can be used to predict the fatigue failure of composite materials at an early stage and to predict fatigue life.
- Scanning electronic microscopy provided information specific to the three phases of fatigue, namely, crack propagation, growth, and ultimate fracture. The last phase in the fatigue process indicated the broken material, which was split into two or more parts. The application of load on composites led to a few microscopic cracks, which ultimately led to many cracks. Micro-level heterogeneity of the material may be attributed to this observation, where the matrix and the reinforced area have distinct mechanical characteristics leading to the cracks propagating in various directions
- Scanning electronic microscopy provided information specific to the three phases of fatigue, namely, crack propagation, growth, and ultimate fracture. The last phase in the fatigue process indicated the broken material, which was split into two or more parts. The application of load on composites led to a few microscopic cracks, which ultimately led to many cracks. Micro-level heterogeneity of the material may be attributed to this observation, where the matrix and the reinforced area have distinct mechanical characteristics leading to the cracks propagating in various directions.
ACKNOWLEDGMENTS
The present work is supported by research grant UPM/700-2/1/GP-IPS/2017/9538700 and the Malaysian Ministry of Higher Education (MyBrain15).
REFERENCES CITED
Abo-Elkhier, M., Hamada, A. A., and El-Deen, A. B. (2014). “Prediction of fatigue life of glass fiber reinforced polyester composites using modal testing,” International Journal of Fatigue 69, 28-35. DOI: 10.1016/j.ijfatigue.2012.10.002
Alderliesten, R. C., Brunner, A. J., and Pascoe, J. A. (2018). “Cyclic fatigue fracture of composites: What has testing revealed about the physics of the processes so far?” Engineering Fracture Mechanics 203, 186-196. DOI: 10.1016/j.engfracmech.2018.06.023.
Al-Mukhtar, A. M., Biermann H., Hubner P., and Henkel, S. (2010). “Determination of some parameters for fatigue life in welded joints using fracture mechanics method,” Journal of Materials Engineering and Performance 19(9), 1225-1234. DOI: 10.1007/s11665-010-9621-5
Androuin, G., Michel, L., Maillet, I., and Gong, X. (2018). “Characterization of fatigue delamination growth under mode I and II: Effects of load ratio and load history,” Engineering Fracture Mechanics 203, 172-185. DOI: 10.1016/j.engfracmech.2018.06.030
Arjmandi, R., Hassan, A., Majeed, K., and Zakaria, Z. (2015). “Rice husk filled polymer composites,” International Journal of Polymer Science 2, 1-32. DOI: 10.1155/2015/501471
Bandara, C. S., Siriwardane, S. C., Dissanayake, U. I., and Dissanayake, R. (2015). “Developing a full range S–N curve and estimating cumulative fatigue damage of steel elements,” Computational Materials Science 96, 96-101. DOI: 10.1016/j.commatsci.2014.09.009
Baptista, C. A. R. P., Adib, A. M. L., Torres, M. A. S., and Pastoukhov, V. A. (2012). “Describing fatigue crack growth and load ratio effects in Al 2524 T3 alloy with an enhanced exponential model,” Mechanics of Materials 51, 66-73. DOI: 10.1016/j.mechmat.2012.04.003
Bilal, A., Lin, R. J. T., Jayaraman, K., and Zhang, C. (2014). “Evaluation of mechanical properties on rice husk and expanded rice husk filled polyethylene composites,” International Journal of the Institute of Materials Malaysia 1, 165-170.
Boonyapookana, A., Nagata, K., and Mutoh, Y. (2011). “Fatigue crack growth behaviour of silica particulate reinforced epoxy resin composite,” Composites Science and Technology 71(8), 1124-1131. DOI: 10.1016/j.compscitech.2011.02.015
Bougherara, H., El Sawi, I., Fawaz, Z., and Meraghni, F. (2015). “Investigation and modeling of the fatigue damage in natural fiber composites,” in: Proceedings of the TMS Middle East—Mediterranean Materials Congress on Energy and Infrastructure Systems (MEMA 2015), 35-44. Springer, Cham. DOI: 10.1007/978-3-319-48766-3_4
Burhan, I., and Kim, H. S. (2018). “SN curve models for composite materials characterisation: an evaluative review,” Journal of Composites Science 2(3), 38. DOI: 10.3390/jcs2030038
Cardona-Uribe, N., Arenas-Echeverri, C., Betancur, M., Jaramillo, L., and Martínez, J. (2018). “Possibilities of rice husk ash to be used as reinforcing filler in polymer sector-a review,” Revista UIS Ingenierías 17(1), 127-142. DOI: 10.18273/revuin.v17n1-2018012
Chowdhury, P., and Sehitoglu, H. (2016). “Mechanisms of fatigue crack growth – A critical digest of theoretical developments,” Fatigue & Fracture of Engineering Materials & Structures 39(6), 652-674. DOI: 10.1111/ffe.12392.
Correia, J. A. F. D. O., Blasón, S., De Jesus, A. M. P., Canteli, A. F., Moreira, P. M. G. P., and Tavares, P. J. (2016). “Fatigue life prediction based on an equivalent initial flaw size approach and a new normalized fatigue crack growth model,” Engineering Failure Analysis 69, 15-28. DOI: 10.1016/j.engfailanal.2016.04.003
Correia, J.A., De Jesus, A.M., Moreira, P.M., and Tavares, P.J. (2016). “Crack closure effects on fatigue crack propagation rates: Application of a proposed theoretical model,” Advances in Materials Science and Engineering 1-11. DOI: 10.1155/2016/3026745
De Castro, P. M. S. T., Tavares, S. M. O., Richter-Trummer, V., De Matos, P. F. P., Moreira, P. M. G. P., and Da Silva, L. F. M. (2010). “Damage tolerance of aircraft panels,” Revista da Associação Portuguesa de Análise Experimental de Tensões ISSN 1646-7078, 18, 35-46.
Dittenber, D. B., and GangaRao, H. V. (2012). “Critical review of recent publications on use of natural composites in infrastructure,” Composites Part A: Applied Science and Manufacturing 43(8), 1419-1429. DOI: 10.1016/j.compositesa.2011.11.019.
Fragoudakis, R. (2017). “Failure concepts in fiber reinforced plastics,” Failure Analysis and Prevention 81. DOI: 10.5772/intechopen.71822.
Ghosh, R., Reena, G., Krishna, A. R., and Raju, B. H. L. (2011). “Effect of fibre volume fraction on the tensile strength of banana fibre reinforced vinyl ester resin composites,” International Journal of Advanced Engineering Sciences and Technologies 4(1), 89-91.
Han, Q., Wang, Y., Yin, Y., and Wang, D. (2015). “Determination of stress intensity factor for mode I fatigue crack based on finite element analysis,” Engineering Fracture Mechanics 138, 118-126. DOI: 10.1016/j.engfracmech.2015.02.019
Hariharan, K., Prakash, R. V., and Prasad, M. S. (2011). “Weighted error criterion to evaluate strain–fatigue life prediction methods,” International Journal of Fatigue 33(5), 727-734.
Huang, X., and Moan, T. (2007). “Improved modeling of the effect of R-ratio on crack growth rate,” International Journal of Fatigue 29(4), 591-602. DOI: 10.1016/j.ijfatigue.2006.07.014
Ibrahim, M., Badrishah, N. S., Sa’ude, N., and Ibrahim, M. H. I. (2014). “Sustainable natural bio composite for FDM feedstocks,” Applied Mechanics and Materials 607, 65-69. DOI: 10.4028/www.scientific.net/AMM.607.65
Iranpour, M., and Taheri, F. (2013). “Applicability of equivalent constant amplitude loading for assessing the fatigue life of pipelines and risers and the influence of compressive stress cycles,” Journal of Pressure Vessel Technology 135(2), 1-10. DOI: 10.1115/1.4007647
Johnson, W. S. (2010). “The history, logic and uses of the Equivalent Initial Flaw Size approach to total fatigue life prediction,” Procedia Engineering 2(1), 47-58. DOI: 10.1016/j.proeng.2010.03.005.
Jollivet, T., Peyrac, C., and Lefebvre, F. (2013). “Damage of composite materials,” Procedia Engineering 66, 746-758. DOI: 10.1016/j.proeng.2013.12.128
Kim, J., Zi, G., Van, S. N., Jeong, M., Kong, J., and Kim, M. (2011). “Fatigue life prediction of multiple site damage based on probabilistic equivalent initial flaw model,” Structural Engineering and Mechanics 38(4), 443-457. DOI: 10.12989/sem.2011.38.4.443
Kim, J., Yi, J., Kim, J., Zi, G., and Kong, J. S. (2013). “Fatigue life prediction methodology using entropy index of stress interaction and crack severity index of effective stress,” International Journal of Damage Mechanics 22(3), 375-392. DOI: 10.1177/1056789512448803
Kirane, K., and Bažant, Z. P. (2016). “Size effect in Paris law and fatigue lifetimes for quasi brittle materials: Modified theory, experiments and micro-modeling,” International Journal of Fatigue 83, 209-220. DOI: 10.1016/j.ijfatigue.2015.10.015
Li, Y., Wang, H., and Gong, D. (2012). “The interrelation of the parameters in the Paris equation of fatigue crack growth,” Engineering Fracture Mechanics 96, 500-509. DOI: 10.1016/j.engfracmech.2012.08.016.
Liang, S., Gning, P. B., and Guillaumat, L. (2014). “Properties evolution of flax/epoxy composites under fatigue loading,” International Journal of Fatigue 63, 36-45.
Liu, Y., and Mahadevan, S. (2009). “Probabilistic fatigue life prediction using an equivalent initial flaw size distribution,” International Journal of Fatigue 31(3), 476-487. DOI: 10.1016/j.ijfatigue.2008.06.005
Lu, Z., Xiang, Y., and Liu, Y. (2010). “Crack growth-based fatigue-life prediction using an equivalent initial flaw model. Part II: Multiaxial loading,” Int. Journal of Fatigue, 32(2), 376-381. DOI: 10.1016/j.ijfatigue.2009.07.013
Mohamed, W. Z. W., Baharum, A., Ahmad, I., Abdullah, I., and Zakaria, N. E. (2018). “Effects of fiber size and fiber content on mechanical and physical properties of Mengkuang reinforced thermoplastic natural rubber composites,” BioResources 13(2), 2945-2959. DOI: 10.15376/biores.13.2.2945-2959
Mohammad, M., Abdullah, S., Jamaludin, N., and Innayatullah, O. (2014). “Predicting the fatigue life of the SAE 1045 steel using an empirical Weibull-based model associated to acoustic emission parameters,” Materials & Design 54, 1039-1048. DOI: 10.1016/j.matdes.2013.09.021
Molent, L. (2010). “Fatigue crack growth from flaws in combat aircraft,” International Journal of Fatigue 32(4), 639-649.
Norhidayah, M. H., Hambali, A., and Yuhazri, M. Y. (2015). “The effect of fiber size on the mechanical properties of bertam/unsaturated polyester composites,” In Applied Mechanics and Materials, 761, 52-56. DOI: 10.4028/www.scientific.net/AMM.761.52
Nourbakhsh, A., Karegarfard, A., Ashori, A., and Nourbakhsh, A. (2010). “Effects of particle size and coupling agent concentration on mechanical properties of particulate-filled polymer composites,” Journal of Thermoplastic Composite Materials, 23(2), 169-174. DOI: 10.1177/0892705709340962
Özturk, S. (2010). “Effect of fiber loading on the mechanical properties of kenaf and fiberfrax fiber-reinforced phenol-formaldehyde composites,” Journal of Composite Materials, 44(19), 2265-2288. DOI: 10.1177/0021998310364265
Pach, E., Korin, I., and Ipina, J. P. (2012). “Simple fatigue testing machine for fiber‐reinforced polymer composite,” Experimental Techniques 36(2), 76-82. DOI: 10.1111/j.1747-1567.2011.00713.x
Rana, P., and Sadaphale, D. B. (2015). “Crack analysis of composite laminate,” Inter-national Journal of Engineering Sciences & Research Technology, 4(7), 169-177.
Renner, K., Kenyó, C., Móczó, J., and Pukánszky, B. (2010). “Micromechanical deformation processes in PP/wood composites: Particle characteristics, adhesion, mechanisms,” Composites Part A: Applied Science and Manufacturing, 41(11), 1653-1661. DOI: 10.1016/j.compositesa.2010.08.001
Ribeiro, A. S., Correia, J. A., Silvia, A., and de Jesus, A. (2011). “Evolution of fatigue history,” in: 21st Brazilian Congress of Mechanical, Natal, Brazil. October.
Shah, D. U., Schubel, P. J., Clifford, M. J., and Licence, P. (2013). “Fatigue life evaluation of aligned plant fibre composites through S–N curves and constant-life diagrams,” Composites Science and Technology 74, 139-149. DOI: 10.1016/j.compscitech.2012.10.015
Shahani, A. R., and Kashani, H. M. (2013). “Assessment of equivalent initial flaw size estimation methods in fatigue life prediction using compact tension specimen tests,” Engineering Fracture Mechanics 99, 48-61. DOI: 10.1016/j.engfracmech.2013.01.007
Sivák, P., and Ostertagová, E. (2012). “Evaluation of fatigue tests by means of mathematical statistics,” Procedia Engineering, 48, 636-642. DOI: 10.1016/j.proeng.2012.09.564
Srinivasa, C. V., and Bharath, K. N. (2011). “Impact and hardness properties of areca fiber-epoxy reinforced composites,” Journal Materials Environment Science 2(4), 351-356.
Tomasi, J., Pisani, W. A., Chinkanjanarot, S., Krieg, A. S., Jaszczak, D., Pineda, E. J., Bednarcyk, B. A., Miller, S., King, J. A., Miskioglu, I., and Odegard, G. M. (2019). “Modeling-driven damage tolerant design of graphene nanoplatelet/carbon fiber/epoxy hybrid composite panels for full-scale aerospace structures,” in: AIAA Scitech. Forum, 1273. DOI: 10.2514/6.2019-1273
Wahyuni, N. L. E., and Soeswanto, B. (2019). “The effects of particle size and content on morphology and mechanical properties of rice straw and coal fly ash filled-polypropylene composites,” Int. Journal of Physics: Conference Series, Medan, Indonesia.
Xiang, Y., Lu, Z., and Liu, Y. (2010). “Crack growth-based fatigue life prediction using an equivalent initial flaw model. Part I: Uniaxial loading,” International Journal of Fatigue 32(2), 341-349. DOI: 10.1016/j.ijfatigue.2009.07.011
Yao, L., Sun, Y., Alderliesten, R. C., Benedictus, R., and Zhao, M. (2017a). “Fibre bridging effect on the Paris relation for mode I fatigue delamination growth in composites with consideration of interface configuration,” Composite Structures 159, 471-478. DOI: 10.1016/j.compstruct.2016.09.082
Yao, L., Sun, Y., Zhao, M., Alderliesten, R. C., and Benedictus, R. (2017b). “Stress ratio dependence of fibre bridging significance in mode I fatigue delamination growth of composite laminates,” Composites Part A: Applied Science and Manufacturing 95, 65-74. DOI: 10.1016/j.compositesa.2016.11.030
Zaaba, N. F., and Ismail, H. (2019). “Thermoplastic/natural filler composites: A short review,” Journal of Physical Science 30, 81-99. DOI: 10.21315/jps2019.30.s1.5
Zhang, X., Gao, H., and Huang, H. Z. (2018), “Total fatigue life prediction for welded joints based on initial and equivalent crack size determination,” International Journal of Damage Mechanics 27(7), 1084-1104. DOI: 10.1177/1056789517723171
Zhou, M., and Fleury, R. (2016), “Fail-safe topology optimization,” Structural and Multidisciplinary Optimization 54(5), 1225-1243. DOI: 10.1007/s00158-016-1507-1
Article submitted: January 8, 2021; Peer review completed: March 20, 2021; Revised version received and accepted: May 10, 2021; Published: May 24, 2021.
DOI: 10.15376/biores.16.3.4963-4985