
Abstract
A strain of Bacillus bacteria, which was able to increase the molecular weight (M) of black liquor (BL) lignin through polymerization, enabling the subsequent industrial use of lignin, was isolated and characterized. This study is believed to be the first time that actual bacteria cells, rather than pure laccase, have been used to polymerize BL lignin. Black liquor is a toxic waste product from the pulp and paper industry that contains lignin. However, the M of lignin is too low for commercial use. The bacteria performed two processes. First, the bacteria produced laccase, which degraded lignin into low M aromatic compounds (LMWACs). Second, the laccase transformed the LMWACs into quinone intermediates, which polymerized and became high M lignin. Five bacterial strains were isolated from a pulp mill, and the best strain was selected. The optimum growing conditions and BL concentration were determined. The optimum growth conditions when using pure lignin were 1 g/L lignin, 5 g/L urea, and 35 °C. When using BL instead of pure lignin, the optimum concentration was 2% BL (v/v). This information could help develop effective industrial utilization of BL lignin.
Download PDF
Full Article
Degradation and Polymerization of Black Liquor Lignin using Bacillus sp. Isolated from a Pulp Mill
Nipatcharaporn Sapapporn,a Sirilux Chaijamrus,a Wassana Chatdumrong,b and Tochampa c,*
A strain of Bacillus bacteria, which was able to increase the molecular weight (M) of black liquor (BL) lignin through polymerization, enabling the subsequent industrial use of lignin, was isolated and characterized. This study is believed to be the first time that actual bacteria cells, rather than pure laccase, have been used to polymerize BL lignin. Black liquor is a toxic waste product from the pulp and paper industry that contains lignin. However, the M of lignin is too low for commercial use. The bacteria performed two processes. First, the bacteria produced laccase, which degraded lignin into low M aromatic compounds (LMWACs). Second, the laccase transformed the LMWACs into quinone intermediates, which polymerized and became high M lignin. Five bacterial strains were isolated from a pulp mill, and the best strain was selected. The optimum growing conditions and BL concentration were determined. The optimum growth conditions when using pure lignin were 1 g/L lignin, 5 g/L urea, and 35 °C. When using BL instead of pure lignin, the optimum concentration was 2% BL (v/v). This information could help develop effective industrial utilization of BL lignin.
Keywords: Black liquor treatment; Bacillus sp.; Degradation and polymerization; Pulp mill
Contact information: a: Department of Biology, Faculty of Science, Naresuan University, 65000, Phitsanulok, Thailand; b: Department of Microbiology and Parasitology, Faculty of Medical Science, Naresuan University, 65000, Phitsanulok, Thailand; c: Department of Agro-Industry, Faculty of Agriculture, Natural Resources and Environment, Naresuan University, 65000, Phitsanulok, Thailand;
* Corresponding author: worasitt@nu.ac.th
INTRODUCTION
Black liquor (BL) is produced as a toxic waste product from the pulp and paper industry, and is characterized by a dark brown color, high initial temperature, strong odor, highly alkaline pH, high chemical oxygen demand (COD; 200000 mg/L), and high biochemical oxygen demand (BOD; 40000 mg/L to 50000 mg/L). Manufacturing 1 ton of paper produces approximately 150 m3 of BL (Pokhrel and Viraraghavan 2004). Black liquor contains valuable lignin, but the molecular weight (M) of lignin is too low for commercial use and must first be increased.
Until recently, retrieval of usable lignin has only been accomplished through the use of certain fungi to polymerize the lignin (Brzonova et al. 2017). The bacteria described in this study are the first known alternatives to fungi that can polymerize BL lignin and render it commercially useful. Even though BL is toxic because of its large number of organic compounds, certain microorganisms are able to survive in BL, adapt physiologically, and remain active (Wang et al. 2010). This study isolated and characterized a toxin-tolerant strain of Bacillus bacteria that can be used to increase the M of BL lignin in preparation for subsequent industrial use. Optimum conditions for growing the bacteria were also determined.
This bacterial strain increases the M of lignin with two processes. First, the bacteria degrade the lignin into low M aromatic compounds (LMWACs) by secreting the enzyme laccase. Second, the laccase converts the LMWACs to quinone intermediates, which polymerize and become high M lignin. In biological treatment systems, a wide variety of microorganisms have been utilized for lignin biodegradation. Several bacterial strains have been observed to degrade and assimilate lignin (Chandra et al. 2007), but only a few strains have been isolated based on their toxin tolerance, such as tolerance to furfural, 5-hydroxy methyl furfural (HMF), and acetic acid. These toxins are potential inhibitors to microbial growth. They damage microbes by reducing enzymatic and biological activities, breaking down DNA, and inhibiting protein and RNA synthesis (Okuda et al. 2008). Fungi have also been considered for use as agents to biodegrade lignin, but fungi have shown weaker performances compared with bacteria when exposed to extreme environmental conditions (Chandra and Bharagava 2013). This study therefore used bacteria, rather than fungi, to degrade and polymerize BL lignin.
According to Ghoul and Chebil (2012), the balance between lignin degradation and fragment polymerization depends on the reaction temperature, solvents added, enzyme origin, and lignin structure. This study demonstrated the promise and possibilities of using laccase-producing bacteria to make lignin from BL commercially usable and valuable. The optimum conditions for growth of the isolated strain were evaluated to determine the effects of the lignin concentration, temperature, nitrogen source, and nitrogen source concentration on the degradation and polymerization of lignin. Finally, the optimum BL concentration was determined to make lignin commercially useful.
EXPERIMENTAL
Materials
All of the reagents used were of analytical grade. Lignin (alkali) was purchased from Aldrich (St. Louis, USA).
Sample Collection and Media Composition
To begin isolating toxin-tolerant bacteria, three kinds of samples were collected in sterile containers from the Environment Pulp & Paper, Ltd. (EPPCO) mill in Nakhon Sawan province, Thailand. This mill processes sugarcane bagasse to produce pulp by the soda process. Specifically, the three samples collected from the site were BL-contaminated soil, sediment from activated sludge, and liquid seeping out from the bagasse heap. Two kinds of isolation medium were used and referred to as mMXYP (modified Malt extract, Xylose, Yeast extract, and Peptone) and mPDB (modified Potato & Dextrose Broth). The mMXYP contained 3 g/L malt extract, 20 g/L xylose, 3 g/L yeast extract, and 5 g/L peptone (Yewale et al. 2016). Added to this base were acetic acid, 5-HMF, and furfural at concentrations of 2.1 g/L, 0.25 g/L, and 0.6 mL/L, respectively. The mPDB contained 200 g/L potatoes and 20 g/L glucose. Added to this base was 2 mL/L furfural. The pH of the mPDB was adjusted to 5.5 (Zhang et al. 2013).
Bacterial Isolation, Purification, and Screening
Altogether there were six culture flasks, three for each of the two media (modified MXYP and modified PDB), and within those three, there was one for each sample type (BL-contaminated soil, sediment from activated sludge, and liquid seeping out from the bagasse heap). A 10-g (= 10 mL) aliquot of the sample material was inserted to inoculate each Erlenmeyer flask that contained 90 mL of mMXYP or mPDB broth. After that, the flasks were incubated aerobically in a temperature-controlled shaking incubator (120 rpm) at 40 °C for 36 h. Samples from the flasks were then spread on agar plates, one plate for each flask for a total of six plates, that contained a corresponding, but non-toxic medium (i.e., MXYP agar or PDA agar, no added toxins). The various colonies that grew on the agar plates were then purified using the cross-streak technique. A total of five phenotypically different bacterial colonies were picked out, selected from across all six plates, and designated as 2B2-1ligB, 6B2-Al, MXYP5, mPDA7, and MMX3. These isolated strains were freeze-dried in ampoules and deposited at the Thailand Institute of Scientific and Technological Research (TISTR) Culture Collection.
The most lignin-tolerant bacteria was sought by screening for lignin tolerance using alkali lignin on agar plates of mineral salt medium (MSM) containing 2.4 g/L Na2HPO4, 2.0 g/L K2HPO4, 0.1 g/L NH4NO3, 0.01 g/L MgSO4, and 0.01 g/L CaCl2 (Chandra et al. 2011) amended with six different lignin concentrations (100 mg/L, 200 mg/L, 300 mg/L, 400 mg/L, 500 mg/L, and 600 mg/L) and with or without a combination of 1% glucose and 0.5% peptone (w/v) as additional carbon and nitrogen sources (Chandra et al. 2007). Unfortunately, all five strains were equally tolerant.
A separate test was done to determine which various lignin-related LMWACs the bacteria could tolerate, such as vanillin, ferulic acid, p-hydroxybenzoic acid, t-cinnamic acid, gallic acid, guaiacol, and syringic acid. This second test was performed on MSM agar plates that contained the various LMWACs (50 mg/L) as the sole source of carbon and energy. The plates were incubated at 30 °C and growth was observed for 6 d (Raj et al. 2007c). This experiment was used to identify an effective lignin degrader because these LMWACs are the basic components of lignin moieties, including p-coumaryl alcohol (H units), coniferyl alcohol (S units), and sinapyl alcohol (G units), that build natural lignin polymers (Raj et al. 2007c).
16S rDNA Identification
Whole DNA was prepared from pure cultures of the five bacterial strains. The 16S rRNA gene was amplified using universal eubacterial primers (Narde et al. 2004) and was BLAST searched in the NCBI nucleotide database to identify the strains.
Black Liquor Analysis
Physico-chemical analysis of the black liquor
Fresh BL was collected from the EPPCO mill and analyzed by testing for the pH, BOD, COD, total dissolved solids (TDS), and heavy metals as per the methods described in APHA, AWWA, WEF (2012). The BL-dissolved lignin content was determined by the Pearl-Benson method (Pearl and Benson 1940). The lignin content of the BL was determined by the acid precipitation method. The initial pH of the BL was in the range of 12 to 13, and the final pH values of the BL were adjusted to between 2 and 1 by adding concentrated sulfuric acid, followed by vigorous mechanical stirring for 30 min. Then, the solutions were centrifuged at 5000 rpm for 15 min. The pellets were carefully washed with either distilled water or high-performance liquid chromatography (HPLC)-grade water (using two separate beakers) to eliminate impurities. Finally, either distilled water or HPLC-grade water was added (depending on the beaker) to the precipitate to make a slurry. The slurry was oven-dried overnight at 105 °C to remove the moisture.
Comparing the lignin structures using FTIR
To prepare the Fourier transform infrared (FTIR) spectroscopy samples, KBr crystals were mixed with the precipitated lignin powder and the mixture was mechanically pressed to create transparent discs, according to the method by Minu et al. (2012). Each strong peak in the FTIR spectra was labeled.
Growth Analysis
Bacterial growth in the high black liquor concentration
Cotton-plugged Erlenmeyer flasks (250 mL) containing autoclaved (15 min at 121 °C) 10% BL diluted with MSM media (BL-MSM), without a supplement source or pH adjustment, were used to inoculate pure cultures (1% v/v on NB) of all five isolated strains. These flasks were incubated at 40 °C and 200 rpm for 144 h. A sample from each flask was analyzed for the pH (ST3100 OHAUS, Parsippany, USA) and viable cell count on nutrient agar plates using the serial dilution technique. Final samples from the flasks were collected to analyze the final product for the LMWACs using gas chromatography-mass spectroscopy (GC-MS).
Determining the optimum conditions for lignin degradation
The process of lignin degradation was optimized with different nutritional and environmental parameters, namely the lignin concentration, temperature, nitrogen source, and nitrogen source concentration. To do so, a full factorial design was conducted with Erlenmeyer flasks (250 mL).
Prior to preparing the experimental flasks, one inoculum flask (as a bacteria source) was prepared. That inoculum flask had an initial base medium of 0.5 g/L lignin MSM media, along with 5 g/L glucose and 5 g/L peptone. After sterilization and cooling, the flask was inoculated with a loopful of the isolated 2B2-1ligB strain and then incubated for 24 h in a rotary shaking incubator.
The full factorial design had 16 possible parameter combinations, and there were two identical flasks for each combination. The flasks contained a base of MSM media supplemented with 5 g/L glucose (Raj et al. 2014) and was not pH adjusted. Added to this base were the specific materials for each parameter combination. The various parameters were the lignin concentration (1 g/L and 2 g/L), incubation temperature (35 °C and 40 °C), nitrogen source (sodium nitrate and urea), and nitrogen source concentration (2.5 g/L and 5 g/L). At this point the flasks were sterilized for 20 min at 110 °C, and then cooled to room temperature.
The finished contents of the single inoculum flask were used to inoculate the 32 experimental flasks at a rate of 10% (v/v). The inoculated experimental flasks were then put in an incubator and agitated at 200 rpm for 6 d.
During the 6 d of experimental flask incubation, samples were collected daily at approximately the same time, starting at 24 h (1 d after inoculation) and finishing at 144 h (6 d after inoculation). At each sampling time, two samples were taken from each experimental flask. The first of these two samples was analyzed for cell growth using two separate tests (A620 and CFU/mL). The second sample was centrifuged at 5000 rpm for 15 min. The resulting supernatant was referred to as the base supernatant. A portion of the base supernatant was diluted with phosphate buffer (pH = 7.6) and its absorbance was measured at 465 nm for color and at 280 nm for acid-soluble lignin on an ultraviolet-visible spectrophotometer (7315 Jenway, Bibby Scientific Ltd., Stone, Staffordshire, UK) (Chandra et al. 2007). Because the results of the acid-soluble lignin test were not as expected, an alternative acid-insoluble lignin test was also performed.
A second portion of the base supernatant was used to precipitate the acid-insoluble lignin. To do that, 2.5 mL of the supernatant were brought to a pH between 2.5 and 3.0 with HCl. The lignin was allowed to precipitate overnight and was then centrifuged and resolubilized in 0.5% (w/v) NaOH. After proper dilution, the (acid-insoluble) absorbance at 280 nm was measured (Ulmer et al. 1983).
A third portion of the base supernatant was used for the laccase assay. The assay was performed by adding 1.0 mL of base supernatant to 10 mM guaiacol (prepared in 100 mM phosphate buffer, pH = 7.0) and incubating the mixture for 15 min at 30 °C. The absorbance was measured at 470 nm (Arora and Sandhu 1985). One unit (U/mL) of enzyme activity was defined as the amount of enzyme required to oxidize 1 µmol of substrate per min under assay conditions.
Finally, a fourth portion of the base supernatant was analyzed for the pH. The experiments were conducted in duplicate and the data were presented as the average.
Lignin degradation and polymerization under the optimum conditions
After determining the optimum parameters for lignin degradation in the previous section, the best performing bacterial strain (2B2-1ligB) was introduced to the optimum conditions (i.e., lignin concentration, temperature, nitrogen source, and nitrogen source concentration) and the resulting bio-reaction was observed for 144 h of incubation. During that time, the following types of information were collected at 24-h intervals: cell turbidity, cell viability, acid-insoluble lignin levels, acid-soluble lignin levels, color, laccase levels, and pH.
Black liquor concentration optimization
As will be discussed later, a high BL concentration was not a suitable carbon source for bacterial growth. Therefore, the effects of four low BL concentrations on the bacterial growth were analyzed. Twelve Erlenmeyer flasks (250 mL) containing 150 mL of 1% to 4% BL-MSM medium supplemented with 5 g/L glucose and 5 g/L urea were sterilized for 20 min at 110 °C. The flasks were inoculated with 15 mL of 24-h grown 2B2-1ligB culture (from the same inoculum flask used in the previous procedure), with an inoculum size of 10% (v/v). The inoculated flasks and controls (uninoculated growing medium) were incubated at 35 °C and 200 rpm for 144 h. Samples were taken at 24-h intervals after inoculation and analyzed for growth, acid-soluble lignin, acid-insoluble lignin, color, laccase activity, and pH. The final samples (collected at 144 h after inoculation) were analyzed for LMWACs using GC-MS and lignin M using size exclusion chromatography (SEC). The experiments were conducted in triplicate. Data were presented as the mean.
GC-MS analysis
A GC-MS analysis (GC7890 A MS5973C, Agilent Technologies, Santa Clara, USA) was used to verify BL detoxification. The four final samples (50 mL) and controls from the low BL concentration procedure were centrifuged (5000 rpm for 20 min) to remove suspended solids. The supernatants were acidified to a pH of 1 to 2 with concentrated HCl and thoroughly extracted with three volumes (50 mL) of ethyl acetate. The organic layer was collected, dewatered over anhydrous Na2SO4, and filtered through Whatman no. 54 filter paper. The residues were dried under a stream of nitrogen gas. The ethyl acetate extract residues were analyzed as trimethyl silyl derivatives. Next, dioxane (100 µL) and pyridine (10 µL) were added to the sample, followed by a silylated reagent that contained 50 µL of trimethyl silyl and trimethylchlorosilane (99:1). The mixture was heated at 60 °C for 15 min with periodic shaking to dissolve the residues, and then analyzed by GC-MS as described by Raj et al. (2007b).
SEC analysis
A SEC analysis was used to verify lignin polymerization. Beginning in the same manner as for the GC-MS analysis, the final samples (50 mL) and controls from the low BL concentration procedure were centrifuged (5000 rpm for 20 min) to remove suspended solids. The supernatants were analyzed using Waters Ultrahydrogel columns (Milford, USA) at 40 °C and a NaOH flowrate of 0.6 mL/min. Before injection into the columns, the samples were adjusted to 50 mM NaOH by adding 5 M NaOH. Column calibration was performed with narrow distributed pullulan-standards (Rittstieg et al. 2002).
RESULTS AND DISCUSSION
Isolation and Screening of the Lignin-degrading Bacteria
The five bacterial strains that were isolated from the pulp mill samples were identified with 16S rDNA sequencing, and the results are shown in Table 1. The isolates identified were all in the Bacillus genus. This species is common in the polluted environment of pulp mills and has naturally developed a tolerance against toxins, such as lignin, acetic acid, furfural, and 5-HMF.
Table 1. 16S rDNA Identification of the Isolated Bacterial Strains
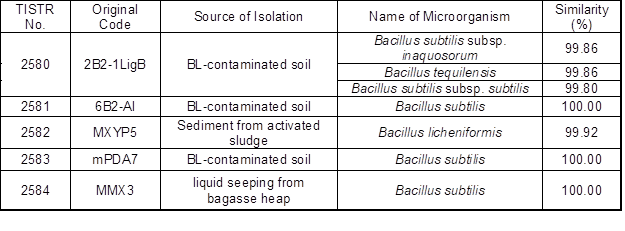
Note: The TISTR number is the ID number of the isolated strains deposited at the Culture Collection of the Thailand Institute of Scientific and Technological Research.
Similar results were previously obtained from both 16S rDNA sequencing and polymerase chain reaction-denaturing gradient gel electrophoresis analysis. Yang et al. (2010) reported a bacterial community that occurred naturally in alkaline BL, all of which belonged to the dominant genera Alkalibacterium, Clostridium, Halomonas, and Bacillus. The Bacillus genus appeared in all four libraries and showed the lowest variations, which suggested that Bacillus was the most stable group in all of the samples. The global problems of how to detoxify BL and make it reusable could be addressed by the use of these microorganisms (Yang et al. 2010).
Similar aerobic lignin-degrading strains were also previously isolated from pulp and paper mills by others. For example, Raj et al. (2007c) isolated eight bacterial strains on kraft lignin mineral salt medium (L-MSM) agar with glucose and peptone from the sludge of pulp and paper mills. The ITRC-S8 strain was selected for identification by 16S rRNA gene sequencing. This isolate shared 95.8% of its identity with the strain B. thuringiensis and 95.2% with the standard ATCC isolates B. thuringiensis and B. cereus. More recently, B. ligniniphilus L1 was isolated from sediment from the South China Sea by Zhu et al. (2017), who used GC-MS and proteomic analysis to confirm the ability of strain L1 to degrade lignin. The toxin tolerance isolation test yielded rather specific results. Only the Bacillus sp. survived the high concentration of toxins.
The isolated bacteria were screened for tolerance of different lignin concentrations (100 mg/L to 600 mg/L), as is shown in Table 2. All of the isolates showed tolerance for growth on the L-MSM agar in the presence and absence of glucose and peptone during the screening procedure. These strains showed fast and luxuriant growth at various lignin concentrations after 24 h (with supplementation) and 72 h (without supplementation) of incubation. However, only slight growth was shown at 600 mg/L lignin without glucose and peptone (Table 2). These findings indicated that a high lignin concentration could inhibit bacterial growth. These bacterial screening results showed greater tolerance than the earlier results from Chandra et al. (2007), who screened for tolerance and observed no growth of different bacterial isolates in L-MSM media without supplementation.
The results of the test done to find out which various lignin-related LMWACs the bacteria could tolerate are shown in Table 3. Those results showed that the five isolated strains were able to grow on all seven versions of the LMWACs medium. Each isolated strain consumed a wide range of the lignin-related LMWACs within 72 h. This suggested that the isolated strains had a great capacity for tolerating toxic LMWACs. That is why these isolates were detected by an earlier toxin tolerance isolation technique. The successful growth on the lignin-related compounds suggested a capacity to degrade lignin.
These screening experiments provided useful information related to lignin degradation by Bacillus sp., which might assist future works.
Black Liquor Analysis
Physico-chemical analysis of the black liquor
The results of the physico-chemical analysis of the BL taken from sugarcane bagasse at the pulp mill (before bacterial treatment) are shown in Table 4. These results indicated that the BL had high levels of COD, BOD, TDS, heavy metals, and lignin. With the high pH of the BL, these compounds all contributed to making the BL toxic to the environment. The BL wastewater sample was determined to be of complex character with a low biodegradability (BOD/COD) of 0.159. The parameters in the BL sample resembled the results of Zheng et al. (2013) for a reed pulp mill. The black color of BL is because of its lignin and lignin derivatives, according to Raj et al. (2007a). Two different methods were used to determine the lignin content in the BL (Pearl-Benson method and H2SO4 precipitation method). The results of the two methods were quite different because the Pearl-Benson method can measure all of the lignin present, but the H2SO4 precipitation method can only measure the lignin that precipitates (Minu et al. 2012).
Table 2. Screening for Tolerance Patterns of Various Bacterial Isolates with and without Glucose and Peptone
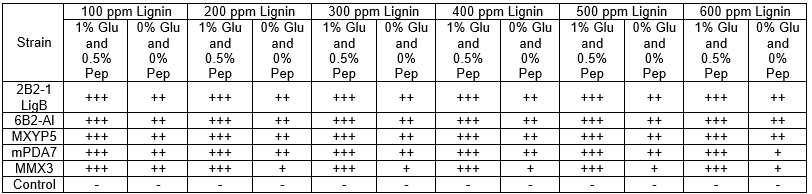
Note: Glu = glucose; Pep = peptone; +++ = fast and luxuriant growth; ++ = moderate growth; + = slow growth; and – = no growth (Chandra et al. 2007)
Table 3. Investigating the Tolerance of the Bacterial Strains to Various Lignin-related LMWACs
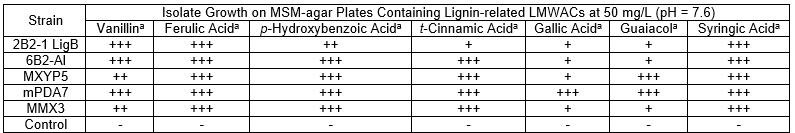
Note: a: analysis within 72 h, with 0% glucose and 0% peptone; +++ = fast and luxuriant growth; ++ = moderate growth; + = slow growth; and – = no growth (Raj et al. 2007c)
Table 4. Physico-chemical Characteristics of the Untreated BL
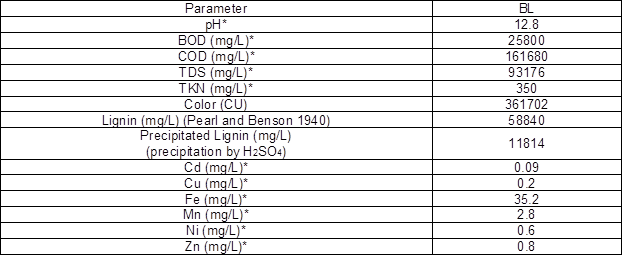
* Detection provided by Project On Environmental Services (Faculty of Environment and Resource Studies, Mahidol University, Thailand
The precipitate from the H2SO4 precipitation method was confirmed to be lignin by FTIR analysis, after comparison with a commercial lignin sample (Aldrich, St. Louis, USA) as a reference (Fig. 1). According to Upton and Kasko (2016), lignin isolated by acid precipitation has a great purity.
The FTIR spectra of the precipitates from the BL were nearly identical with the spectrum of the commercial lignin. For example, the strong and broad peak at 3395 cm-1 to 3399 cm-1 was characteristic of OH groups and phenolic compounds. The two bands at 1598 cm-1 to 1607 cm-1 and 1513 cm-1 were characteristic of aromatic rings. This result showed that the precipitates from the BL were lignin.
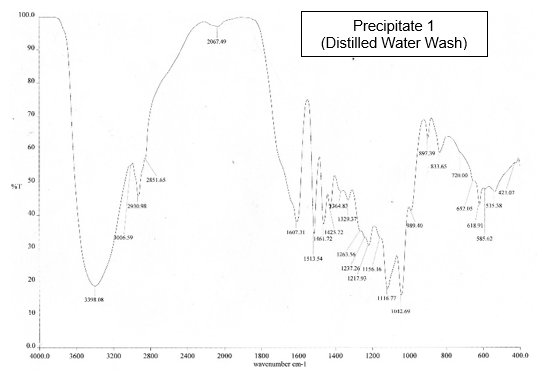
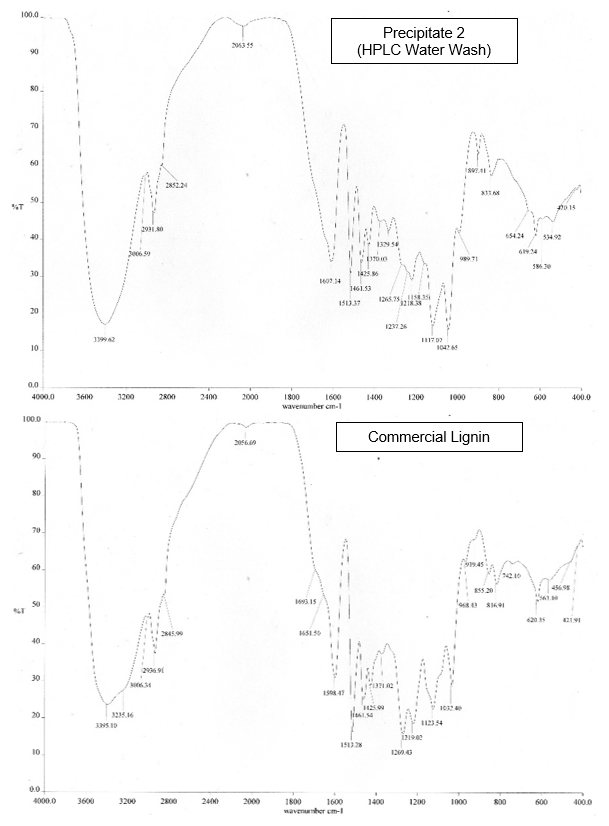
Fig.1. FTIR absorption bands for the BL lignin samples and commercial lignin
Analysis of the Bacterial Growth in the High Black Liquor Concentration
The isolated bacterial growth in a 10% BL medium without supplementation is shown in Fig. 2A. The pH of the same medium is shown in Fig. 2B.
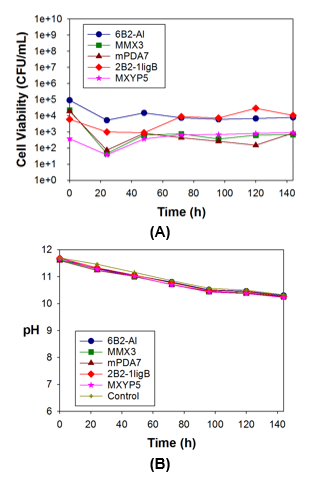
Fig. 2. (A) Growth of strain 2B2-1ligB during 144 h of incubation with 10% BL and without supplementation (no glucose or nitrogen); and (B) pH of the same medium
Cell growth of all of the strains (on the high BL concentration medium without supplementation) decreased during the first 24 h of incubation, followed by a slight increase in the growth. Of the five bacterial strains, the growth of strain 2B2-1ligB stood out from the others and reached maximum cell growth after 120 h of incubation. This demonstrated adaptation of this strain to a harsh medium (Fig. 2A). The ability of strain 2B2-1ligB to grow better than the other strains is important because a bacterial strain that is a robust, stable lignin degrader, even under extreme environmental and substrate conditions, such as a high pH, limited oxygen, and a high lignin concentration, is needed for the detoxification treatment of BL (Bugg et al. 2011).
A slight decrease in the pH was noted in the 10% BL medium (Fig. 2B). This pH change was not caused by the bacterial growth, but rather by the oxidation of the culture medium during agitation. This phenomenon showed that a high BL concentration inhibited the growth of bacteria.
The results of the GC-MS analysis can be seen in Table 5. The ethyl acetate extracts after 144 h of cultivation showed low molecular weight compounds in the BL control. Major peaks detected in the control samples at different retention times (RT) were butanoic acid (5.97), propanoic acid (8.75), hexanoic acid (8.82), acetic acid (8.88), succinic acid (10.97), benzaldehyde (11.44), trimethylsilyl vanillin (12.52), benzoic acid (13.03), trimethylsilyl 3,5-dimethoxy-4-(trimethylsilyloxy) benzoate (14.51), p-coumaric acid (14.78), hexadecanoic acid (15.16), ferulic acid (15.48), and 9,12-octadecadienoic acid (16.02).
Table 5. GC-MS Analysis Identified the Presence of the Following Compounds in the Final Five BL Samples after Treatment
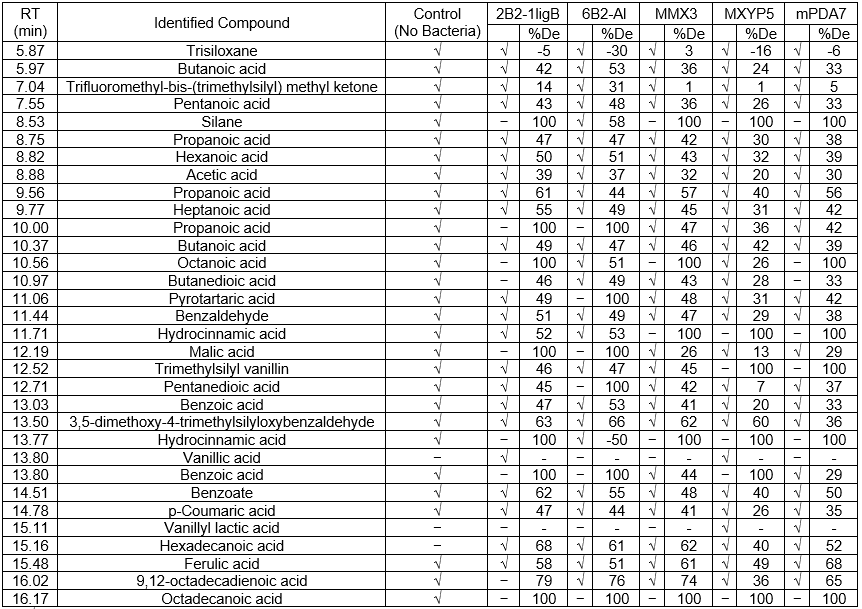
Notes: √ = present; – = absent; %De = degradation of each compound was calculated from the initiation of the absorption peak area minus the inoculation of the absorption peak area; negative degradation numbers indicate an increasing amount of the compound
According to Yan and Qi (2014), acidic compounds, such as those identified in the BL sample, are commonly produced during the degradation of sugarcane, which happens at a pulp mill. Examples of acidic compounds in the GC-MS analysis list include butanoic acid (5.97), pentanoic acid (7.55), propanoic acid (8.75), hexanoic acid (8.82), acetic acid (8.88), heptanoic acid (9.77), and butanedioic acid (10.97).
As can be seen in Table 5, some compounds were degraded by the inoculated bacteria. These included silane (8.53), propanoic acid (10.00), octanoic acid (10.56), malic acid (12.19), hydrocinnamic acid (13.77), benzoic acid (13.80), 9,12-octadecadienoic acid (16.02), and octadecanoic acid (16.17). The bacterial strain 2B2-1ligB was able to degrade these recalcitrant compounds under harsh conditions. These results showed only limited lignin degradation because the inoculated bacteria could not flourish in a high BL concentration without supplementation.
The GC-MS analysis results for the high BL concentration showed that each of the five isolated strains was able to degrade its own particular set of recalcitrant compounds. Of the five strains, 2B2-1ligB was selected for investigating the optimum conditions for lignin degradation because it was able to adapt and survive in high BL concentrations.
To find the optimum BL concentration for bacterial growth, the experiment was performed again using four lower BL concentrations.
Parameter Optimization
Strain 2B2-1ligB was selected to determine the optimum conditions for the efficient degradation of lignin on MSM broth with commercial lignin. Commercial lignin was used because it was pure lignin and avoided contaminants from the BL. The nitrogen sources selected were NaNO3 and urea.
Table 6. Lignin Degradation Percentage of Each Experiment as Calculated from the Acid-insoluble Lignin
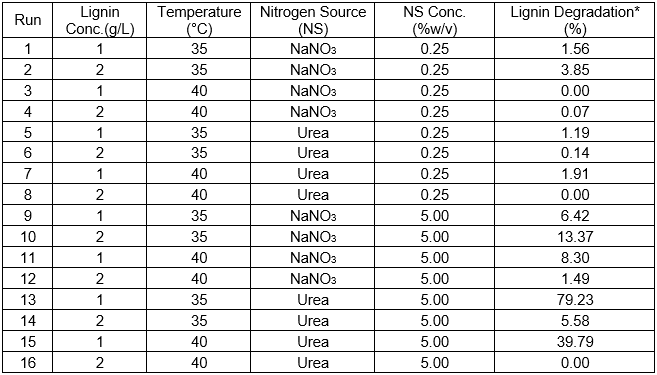
* Lignin degradation percentage was calculated from the acid-insoluble lignin
Determining the optimum conditions for lignin degradation
Table 6 shows the results of the full factorial design experiment to optimize the parameters for lignin degradation.
The results in Table 6 show that lignin degradation varied greatly depending on the situation. The best result was obtained from Run 13 with 1 g/L lignin, a temperature of 35 °C, urea as the nitrogen source, and a 5% (w/v) nitrogen source concentration. The maximum lignin degradation percentage was 79.2%. The second-best result was obtained from Run 15 with 39.8% lignin degradation. The conditions in Run 15 were the same as those of Run 13, except the temperature was higher (40 °C). The percentages of lignin degradation based on acid-insoluble lignin were calculated using the method from Ulmer et al. (1983). The culture media composition, temperature, and nitrogen source concentration affect cell growth and enzymatic production to support lignin degradation. The results of this parameter combination can be seen in Fig. 3. In every experiment, strain 2B2-1ligB produced detectable laccase when it was grown in lignin-added media (lignin as an inducer for laccase production), but only the optimum conditions showed maximum lignin degradation.
Lignin degradation and polymerization under the optimum conditions
Lignin degradation was observed under the optimum conditions. The results provided further insight into lignin degradation and polymerization by strain 2B2-1ligB. These results are shown in Fig. 3.
The lignin concentration, temperature, nitrogen source, and nitrogen source concentration had a great effect on the growth and laccase production of the selected strain. The optimum conditions for strain 2B2-1ligB growth were determined to be a MSM medium with 1 g/L lignin, 5 g/L glucose, 5 g/L urea, and a temperature of 35 °C (incubation for 144 h at an agitation rate of 200 rpm).
Growth of the single bacterial strain 2B2-1ligB was measured by the cell viability (Fig. 3; red line) and cell turbidity (Fig. 3; blue line). Based on the cell viability test, cell growth appeared modest for the first 48 h of incubation and then increased sharply, reaching peak growth at 72 h. However, in reality, the growth probably increased steadily, even during the first 24 h. The first 24 h of growth only appeared flat because, while many cells were reproducing, many were also dying initially because they could not adapt to the culture medium.
In contrast, cell growth based on the turbidity test rose steadily for the first 24 h, and then growth continued at a steady, mostly unchanged rate until 72 h. The fact that cell growth as measured by both methods began to decline after 72 h indicated that the bacteria ran out of nutrients.
During the incubation period, the rate of laccase production (Fig. 3; pink line) rose sharply during the first 24 h, with a mostly unchanged laccase production rate after that until 120 h, at which time the production rate increased again. Laccase only attacks the phenolic subunits of lignin, which leads to Cα oxidation, Cα-Cβ cleavage, and aryl-alkyl cleavage. Laccase is able to reduce one molecule of dioxygen to two molecules of water, while performing one-electron oxidation of a wide range of aromatic compounds. This oxidation results in an oxygen-centered free radical, which can then be converted to quinone via a second enzyme-catalyzed reaction. The quinone and free radicals can then undergo polymerization (Viswanath et al. 2014).
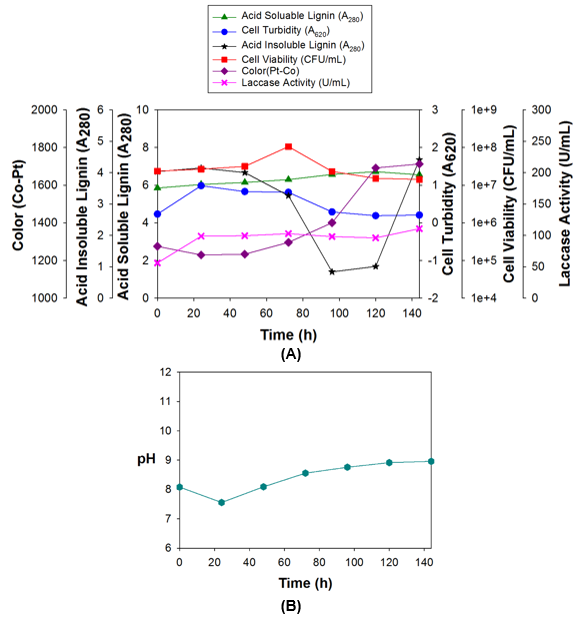
Fig. 3. (A) Strain 2B2-1ligB growth under the optimum conditions for lignin degradation; and (B) pH during growth of strain 2B2-1ligB under the optimum conditions
Kim et al. (2017) successfully prevented quinone methide formation and repolymerization during lignin depolymerization by chemo-selective blocking of the phenolic hydroxyl (Ar-OH) group by methylation. The quinone methide intermediates are partly responsible for repolymerization reactions. In the same way, acid-soluble lignin (Fig. 3; green line) increased from 5.85 to 6.55 (absorbance at 280 nm, A280) during incubation, which was different from the lignin degradation reported by Zhu et al. (2017). Lignin degradation showed that the A280 was reduced from 0.36 to 0.22 during incubation. This meant that approximately 38.9% of the lignin was degraded by B. ligniniphilus L1. As a result, the quinone methide intermediates were possibly formed in the medium by laccase.
The amount of acid-soluble lignin measured by the A280 wavelength absorbance (green line) did not decrease, which was counter to expectations. In fact, it increased by 12.0%. The amount of acid-insoluble lignin (Fig. 3; black line) was measured at the same time, and the acid-insoluble lignin decreased after 48 h of incubation. It reached a minimum level (79%) at 96 h as the lignin degraded. This decrease was similar to the results of Ulmer et al. (1983).
As it degrades, lignin releases LMWACs, also called mediators. Mediators are small enough to penetrate the highly impermeable lignin structure to oxidize non-phenolic aromatic groups because laccase is only able to oxidize phenolic end groups in lignin. This process is called the laccase-mediator system, and a number of naturally-occurring components have been suggested as potential redox mediators in vivo (Areskogh et al. 2010).
The acid-insoluble lignin began to increase because of polymerization after reaching its minimum level at 96 h, increased sharply from 120 h onward, and returned to its initial value (before incubation) at 144 h.
The color units (purple line) increased by 34.3% (measured after 144 h of incubation). This increase in color was similar to the results of Fernaud et al. (2006), who found that laccase produces an early intense functionalization by introducing both chromogene (e.g., C=O) and auxochrome groups (e.g., -OH) into laccase-treated lignin. Furthermore, these groups combined with quinones and contributed to the color change observed in the reaction mixture (Fernaud et al. 2006). In the current study, the initial color units of the culture media were 1275 PtCO. The culture media went through a modest color decrease during the first 24 h, probably because of lignin degradation. After 24 h, the color of the media increased because of polymerization. After the full 144 h, the color units had increased to 1713 PtCO.
The pH of the solution (Fig. 3B) decreased in response to the growth of the bacteria for the first 24 h, and then the pH increased. This pH change was similar to the results of Raj et al. (2007c).
Black Liquor Concentration Optimization
The above results showed the degradation and polymerization of pure lignin (not BL) under optimum conditions. The next procedure determined the best BL concentration for producing high M lignin.
Growth analysis in the 1% to 4% BL
The effects of four low BL concentrations on bacterial growth are shown below. The information collected in each case was the bacterial growth (as cell viability and cell turbidity), lignin (acid-insoluble and acid-soluble lignin), color units, amount of laccase, and pH.
Figure 4 illustrates representative growth of the bacterial strain 2B2-1ligB in four different concentrations of BL. At 1% BL, the bacteria grew quickly during the first 24 h, followed by slower growth from 24 h to 48 h. After 48 h, the bacteria content remained more or less unchanged until 144 h (Fig. 4A; red and blue lines). Because this initial growth was not seen in the control in Fig. 4B, which had no glucose or urea, the bacteria in Fig. 4A probably consumed the glucose and urea in the beginning, and after that it consumed low molecular weight compounds (LMWCs) that were released when laccase degraded the lignin.
In the 1% BL control, which had no glucose or urea (Fig. 4B), the bacterial growth decreased during the first 24 h because this BL concentration had fewer LMWCs to fuel growth. During the 24-h to 72-h period, the bacteria were able to grow and produce laccase by consuming LMWCs, and after that bacterial growth decreased because of dwindling LMWCs (Fig. 4B; red line).
With 2% BL (Fig. 4C), there was less bacterial growth in the first 48 h than with the previous concentration of 1% BL. However, the growth in the first 48 h was more or less stable, unlike the two-step growth in the first 48 h with 1% BL. The 2% flask stopped growing after 48 h, and after that, the bacteria content remained at approximately the same level until 144 h, though still lower than that in the 1% flask. The 2% BL flask produced a bit more laccase than the 1% BL flask (pink line). The acid-insoluble lignin reached its lowest level at 72 h. After that it increased, returning to its original levels. This changing level of acid-insoluble lignin showed that lignin degradation occurred, followed by lignin polymerization (Fig. 4C; black line).
In the 2% BL control, which had no glucose or urea (Fig. 4D), the bacteria took 72 h to adapt to the new environment, and then it was able to grow. Laccase production was first observed at 96 h. The inhibitory effect of the concentrated BL adversely affected metabolism of the bacteria cells (Fig. 4D; red and blue lines). The acid-insoluble lignin increased slightly at 96 h. Polymerization was first observed at 96 h even with no prior degradation of lignin to release LMWCs. That was because BL also contains naturally-occurring LMWCs. After 96 h, these compounds were still available to the bacteria to fuel growth. The increase in acid-insoluble lignin showed that polymerization occurred in the media because of bacterial laccase (Fig. 4D; black line), even though lignin degradation was not detected in the culture medium (no decreasing black line). The decrease in the acid-insoluble lignin showed that supplementation (glucose and urea) was necessary to fuel growth and cause lignin degradation for polymerizing high M lignin.
Growth inhibition of the bacteria by lignin did not appear to occur with either a 1% or 2% supplemented BL concentration. However, with 3% BL (Fig. 4E), the growth was clearly inhibited in the first 24 h because of the higher BL concentration. The bacteria probably took 24 h to adapt to the new environment, and they were able to grow after that, reaching a maximum population at 48 h, which remained unchanged until 144 h. The amount of laccase was inhibited by the higher BL concentration, which reflected the initial inhibition of the bacteria. The fastest production of laccase occurred between 24 h to 48 h. This high amount of laccase degraded the lignin, which lowered the amount of acid-insoluble lignin (black line), but polymerization began at 72 h and the amount of acid-insoluble lignin increased, eventually returning to its original level and even a bit higher. This increase in acid-insoluble lignin clearly showed that polymerization occurred in the reaction. In the 3% BL control without glucose or urea (Fig. 4F), the bacteria grew slowly during 24 h to 48 h of incubation (Fig. 4F; red and blue line). This growth showed that the bacteria consumed small compounds in the BL, which caused the amount of acid-insoluble lignin to decrease (Fig. 4F; black line). The amount of laccase was inhibited by the high BL concentration because the bacteria were not able to grow (Fig. 4F; pink line).
Finally, with 4% BL (Fig. 4G), the bacteria took 48 h to adapt. After that the growth increased sharply, reaching peak growth at 72 h. Then, the growth continually decreased until 144 h because of BL inhibition (Fig. 4G; red and blue lines). This adaptation and subsequent decrease in bacteria clearly showed growth inhibition of the bacteria by the BL. The laccase production was also inhibited by the BL at the start of incubation. The amount of laccase increased at 72 h when bacteria grew (Fig. 4G; pink lines).
In the 4% BL control without glucose or urea (Fig. 4H), the bacterial growth decreased early in the incubation process. Then, the bacteria were able to grow slowly, which was observed first at 48 h of incubation (Fig. 4H; red line). When bacteria grew (from 0 h to 48 h), the amount of acid-insoluble lignin decreased. After that, the amount of acid-insoluble lignin increased. The increase in the amount of acid-insoluble lignin indicated that polymerization occurred (Fig. 4H; black line). Only a small amount of laccase was detected because the bacteria were not able to grow effectively (Fig. 3H; pink line).
The culture media color units basically did not change with any of these BL concentrations, supplemented or not. There were only slight increases. The color results showed that when lignin polymerization occurred in the media, it became darker. This was because the strain 2B2-1ligB was not able to produce cellobiose:quinone oxidoreductase (CBQase) for the reduction of quinone during laccase-catalyzed lignin degradation (Westermark and Eriksson 1974) or quinone dehydrogenase enzyme for decolorization of the BL lignin (Bandounas et al. 2013). The diversity of the Bacillus sp. showed that some strains degraded lignin without decolorization/mineralization, but continued lignin polymerization.
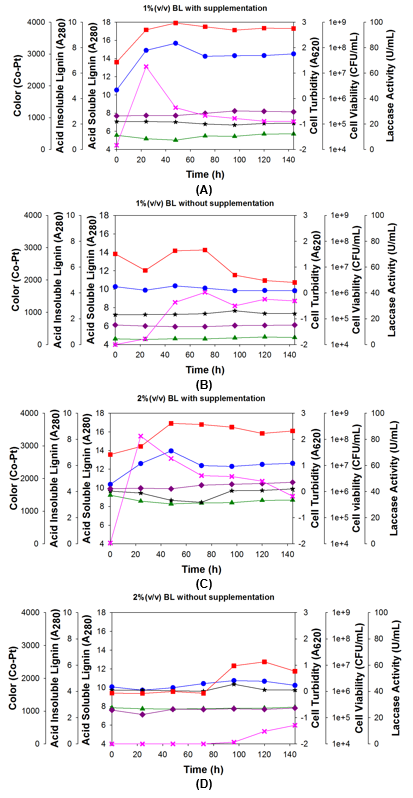
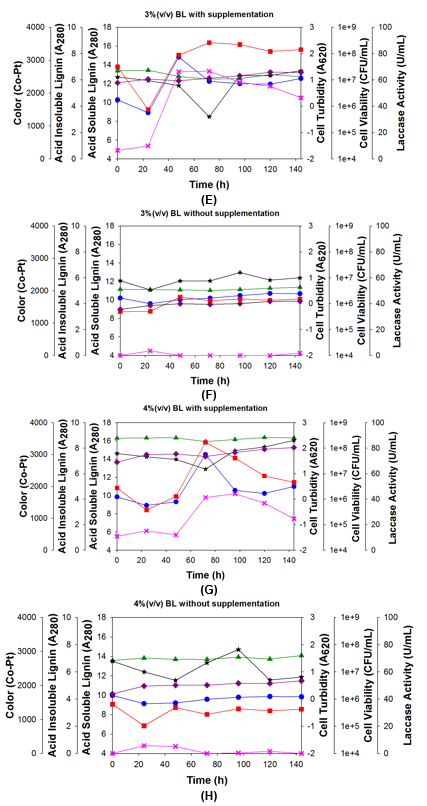
Fig. 4. Growth of bacteria strain 2B2-1ligB during 144 h of incubation with four different concentrations of BL: A and B = 1%; C and D = 2%; E and F = 3%; G and H = 4%; flasks A, C, E, G also contained 5 g/L glucose and 5 g/L urea; flasks B, D, F, and H were controls and contained no glucose or urea; in all of the cases, the temperature was 35 °C and the agitation rate was 200 rpm.
The pH of the media with the four BL concentrations was measured during incubation, as is shown in Fig. 5.
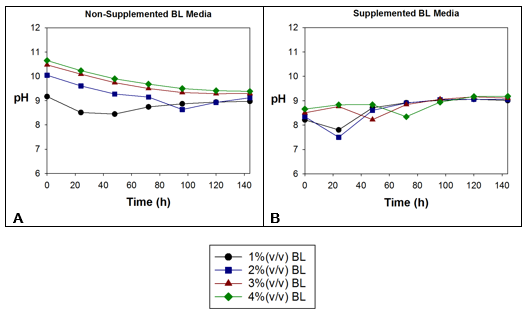
Fig. 5. pH of the (A) non-supplemented BL media and (B) supplemented BL media
The pH of the non-supplemented 1% and 2% BL media (Fig. 5A) decreased in response to the growth of bacteria. With 1% BL, the pH decreased during the first 48 h because the bacteria were able to grow in this BL dilution (black line). With 2% BL, the strain was able to grow for the first 96 h, and so the pH decreased during the same period. The slight decrease in the pH of the non-supplemented 3% and 4% BL media (red and green lines) was not caused by bacteria, but by oxidation of the media during agitation, as was mentioned previously.
The swift decrease in the pH in the 1% and 2% (v/v) BL media supplemented with glucose and urea indicated that these two dilution rates were conducive to bacterial growth because the bacteria took little time to adapt and begin to grow, especially with 2% BL. The pH of the 2% BL media decreased more than the pH of the 1% BL media (Fig. 5B; blue line). In contrast, 3% and 4% BL were not conducive to bacterial growth.
To summarize these various BL concentration trials, less bacterial growth occurred when the BL concentration was higher, regardless of supplementation. Inhibition of the bacteria by the BL affected the degradation and polymerization of lignin because these two processes were dependent upon bacterial growth. The bacteria cells produced laccase, which degraded lignin and released LMWCs (i.e., phenolic compounds and organic compounds) into the media. A large amount of LMWCs was released during lignin degradation, which are called natural mediators, and some turned into quinone intermediates. These natural mediators and quinone intermediates were used during polymerization to produce high M lignin, similar to the experiment by Prasetyo et al. (2010). The mediators, because of their small size, were able to oxidize lignin in a way that was impossible for the large laccase molecule itself to do. This process is referred to as the laccase-mediator system, and it provides new insight into potential biotechnological applications of the bi-functionality of bacteria. Bi-functionality in this case refers to detoxification (i.e., degradation) and bioremediation (i.e., polymerization) (Jeon and Chang 2013) of the BL lignin.
The polymerization of lignin using fungi has been reported in several studies. For example, Lara et al. (2003) has reported that treatment of BL with the fungus Trametes elegans in liquid media caused degradation and polymerization even though no nutrients were added. At the same time, Font et al. (2003) cultured the fungus T. versicolor for BL detoxification. The M distribution of the initial and final effluent (after treatment) profiles suggested a possible polymerization from low to high M compounds. Recently, Brzonova et al. (2017) observed the fungus Coriolus versicolor in liquid media containing 2 g of kraft lignin. The kraft lignin was first solubilized in 2.0% (v/v) dimethyl sulfoxide (DMSO), and then distilled water was added. The M of the kraft lignin increased. Finally, Ramalingam et al. (2017) concluded that laccase-catalyzed polymerization by oxidative coupling dominated over oxidative cleavage (lignin degradation). Although laccase has the potential to cleave lignin in the presence of mediators to phenol-containing monomers or dimers, these phenolic compounds may undergo re-polymerization more readily under similar reaction conditions (Ramalingam et al. 2017).
The next procedures used GC-MS and SEC to verify that degradation and polymerization occurred.
GC-MS analysis
After the above growth experiments using BL, GC-MS was used to confirm that BL lignin degradation occurred. This can be done through GC-MS by checking the lignin degradation products in the final samples and comparing them with the non-incubated samples (Table 7).
The GC-MS detection of propanoic acid (7.68), hexanoic acid (7.76), pentanoic acid (9.13), butanedioic acid (10.04), 1-hexadecene (11.85), and p-coumaric acid (13.79) in the non-autoclaved BL sample were attributed to chemical degradation of lignin because of the pulping process.
The presence of compounds in the non-incubated sample (0 h), such as laevulic acid (8.48), urea (9.65), phosphoric acid (9.80), propanoic acid (10.21), 3-hydroxy glutaric acid (11.16), benzoic acid (12.10), and cinnamic acid (13.00, 13.76), were attributed to the release of thermal degradation products produced under the elevated temperature and pressure of the autoclave. After the media were incubated with the strain 2B2-1ligB for 144 h, the presence of LMWCs was checked through testing, but pentanoic acid (6.33), propanoic acid (7.68), hexanoic acid (7.76), butanedioic acid (10.04), propanoic acid (10.21), malic acid (11.18), cinnamic acid (14.52), and 9,12-octadecadienoic acid (15.00) were not found when compared with the initial culture medium (0 h). This data confirmed that the bacteria could degrade lignin.
Looking at the degradation percentages of the degraded compounds, acetic acid (7.86), propanoic acid (8.44), laevulic acid (8.48), butanedioic acid (10.04), pyrotartaric acid (10.13), 3-hydroxy glutaric acid (11.16), 1-hexadecene (11.85), cinnamic acid (13.76), and hexadecanoic acid (14.24) were considerably degraded during detoxification by the laccase-producing bacteria. The toxicity reduction that was achieved indicated polymerization occurred (Font et al. 2003).
These laccase-producing bacteria have potential for not only producing commercial lignin and detoxifying wastewater, but also for enhancing biogas production by reducing compounds that inhibit biogas production. Schroyen et al. (2017) investigated successful laccase pretreatment of phenolic compounds that inhibit biogas production during anaerobic digestion. A combination of enzymatic detoxification and subsequent biogas production showed that a decrease in the phenolic compounds by laccase treatment could considerably lower the inhibition levels of biogas production.
The negative degradation percentages of benzoic acid indicated the formation of intermediate compounds as a result of lignin degradation. The intermediate compounds underwent de-aromatization through the so-named central pathway, and then different intermediary metabolites, such as acetyl-CoA, succinyl-CoA, and pyruvate, were produced to enter the tricarboxylic acid cycle (Fuchs et al. 2011). Benzoic acid was used as an energy source for cell production. This accumulation of benzoic acid was similar to the results of Sachan et al. (2006).
There were some compounds other than benzoic acid that were also produced as intermediate compounds by 2B2-1ligB growth, namely octamethyl trisiloxane (7.78), unknown (8.03), benzeneacetic acid (9.90), and benzoate (13.59) (Table 8). The small compounds could effectively strengthen the catalysis of laccase to polymerize lignin as natural mediators (2-methoxyphenol, etc.). Laccase oxidized these small molecules, including lignin, to phenoxy radicals with a concomitant reduction in oxygen. Thus, the generated phenoxy radicals are unstable and reactions involving polymerization and depolymerization of lignin can take place (Leonowicz et al. 1985).
The GC-MS results showed that the lignin was degraded by the bacteria. The BL lignin was degraded in three ways: the bacteria degraded some compounds, reduced the amount of some compounds, and produced some intermediate compounds.
Table 7. Compounds Identified from the Four Different Low BL Concentrations and Corresponding Degradation
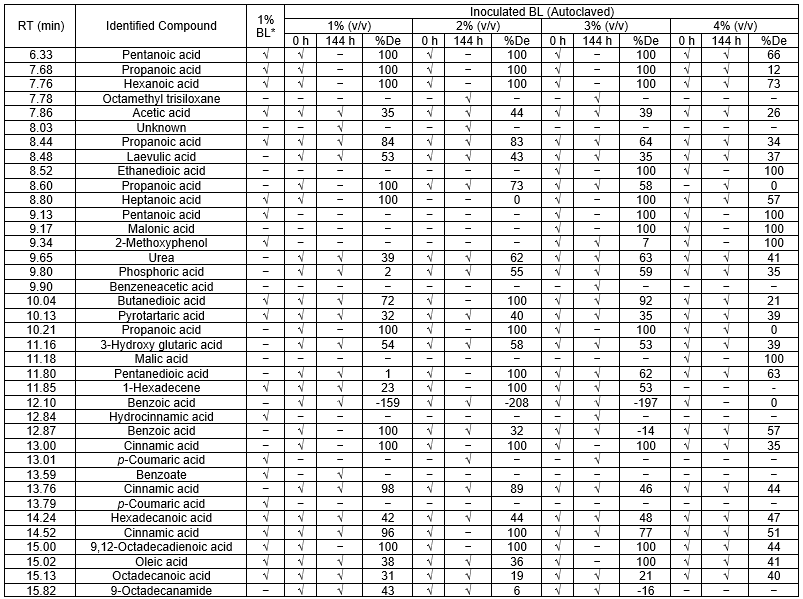
Table 7 notes: √ = present; – = absent; 1% BL* = non-autoclaved BL; %De = degradation percentage of each compound was calculated from the area peak at 0 h and the area peak at 144 h for each BL concentration
SEC analysis
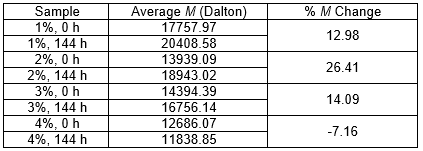
To verify lignin polymerization, SEC analysis was used to determine the M of the lignin in the samples from the four BL concentrations collected after 144 h of cultivation. The M of the lignin in the control samples with the same BL concentrations taken at 0 h was also checked to compare the two weights. If the results showed that the M of the lignin in the final samples was higher than that of the initial samples, then it was indicated that polymerization occurred. After measuring the initial and final Ms in each set, the percent M change (% M) was calculated. The effectiveness of various polymerization methods can be compared by comparing the resulting percent M change. Table 8 shows the initial and final Ms of lignin in four different BL concentrations before and after treatment with the current bacterial strain 2B2-1ligB.
Table 8 shows that the greatest change in the lignin M, which indicated the greatest amount of polymerization, occurred in the 2% BL solution (26.4% M change). Although the 1% and 3% BL solutions were not as hospitable to the bacteria (13.0% and 14.1% M change, respectively), polymerization nevertheless occurred in those two solutions as well (as indicated by their positive percent M changes), albeit to a lesser extent than in the 2% BL solution. The 4% BL solution was too concentrated for the bacteria to tolerate, and so polymerization did not occur (-7.2% M change), and only degradation occurred, which was indicated by the negative percent M change. When BL emerged from the pulping process, it naturally contained pieces of lignin in many different sizes, with some pieces quite broken down. That was the situation in all of the solutions at 0 h. After 144 h of incubation, these different-sized pieces of lignin were merged by the laccase through polymerization into large pieces of high M lignin. The various changes in the percent M showed how polymerization was accelerated by using the optimum BL concentration.
Table 8. M Analysis and Percent M Change of the Samples at Four Different BL Concentrations
When Brzonova et al. (2017) used fungi (C. versicolor) to polymerize kraft lignin, they were able to increase the lignin M from 4690 Da to 28760 Da (61.3% M change) by polymerization in liquid media that contained 2 g of kraft lignin and 2 vol.% DMSO, at a temperature of 29 °C for 6 d. The current study is believed to be the first to utilize bacteria to degrade and polymerize BL lignin. Utilizing bacteria rather than fungi for this purpose had the advantages of taking less preparation time and requiring fewer supplementary ingredients in the medium. Most importantly, fungi research has only been done using pure commercial lignin, not BL. These bacteria have a natural tolerance for extreme environmental conditions, like those found in BL, where the current study showed that the bacteria can operate effectively. Because of the extreme environment of the BL, fungi may not even be able to survive in it.
To summarize the results and discussion of the current study, the toxin tolerance technique isolated a specific spore-forming bacterial strain with the ID 2B2-1ligB, which by producing laccase, caused phenolic removal of BL (lignin degradation) and lignin polymerization. This showed that strain 2B2-1ligB could be used for detoxification and bioremediation of BL. The strain could be useful to treat BL before wastewater treatment. The optimum conditions for growth determined above should apply: a 2% BL concentration, supplementation of 5 g/L glucose and 5 g/L urea, a temperature of 35 °C, and agitation at 200 rpm. Six days after the start of inoculation, high M lignins were harvested by acid precipitation and subsequent filtration or sedimentation. After lignin harvest, the final waste could be sent to the activated sludge process to reduce the color and other contaminants. The high M lignin can serve as a replacement for various petroleum-derived chemicals, including resins, plastics, and fillers (Allen et al. 1980).
CONCLUSIONS
Five Bacillus sp. were isolated from a pulp mill, after which the single strain 2B2-1ligB was selected to determine the optimum conditions for lignin degradation. When the optimum conditions were utilized, a 79.2% lignin degradation was obtained. Those ideal conditions were lignin concentration 1 g/L, temperature of 35 °C, and urea concentration of 5 g/L. The full process demonstrated lignin degradation, followed by polymerization.
The best BL concentration for growth of the strain 2B2-1ligB and enhancement of the M of lignin was 2% (v/v).
Degradation of the BL lignin by the bacteria was demonstrated by the subsequent absence of small recalcitrant compounds, while polymerization of the BL lignin was demonstrated by the increase in the M. In light of these results, the strain 2B2-1ligB showed great potential for application in the bio-refinery process, where it could generate additional income by recovering commercial grade lignin from BL.
The A280 wavelength absorbance of the acid-soluble lignin remained practically unchanged, which was unexpected. However, degradation was subsequently confirmed by GC-MS testing.
ACKNOWLEDGMENTS
This research was made possible in part by a generous grant from the Royal Thai Government and Naresuan University (Grant No. R2561B064).
REFERENCES CITED
Allen, B. R., Cousin, M. J., and Pierce, G. E. (1980). Pretreatment Methods for the Degradation of Lignin, National Technical Information Service, Springfield, VA.
APHA, AWWA, WEF (2012). Standard methods for the examination of water and waste water, 22nd Ed., American Public Health Association, Washington, DC.
Areskogh, D., Li, J., Gellerstedt, G., and Henriksson, G. (2010). “Investigation of the molecular weight increase of commercial lignosulfonates by laccase catalysis,” Biomacromolecules 11(4), 904-910. DOI: 10.1021/bm901258v
Arora, D. S., and Sandhu, D. K. (1985). “Laccase production and wood degradation by a white-rot fungus Daedalea flavida,” Enzyme Microb. Tech. 7(8), 405-408. DOI: 10.1016/0141-0229(85)90131-0
Bandounas, L., Pinkse, M., de Winde, J. H., and Ruijssenaars, H. J. (2013). “Identification of a quinone dehydrogenase from a Bacillus sp. involved in the decolourization of the lignin-model dye, Azure B,” New Biotechnol. 30(2), 196-204. DOI: 10.1016/j.nbt.2012.04.003
Brzonova, I., Kozliak, E. I., Andrianova, A. A., LaVallie, A., Kubátová, A., and Ji, Y. (2017). “Production of lignin based insoluble polymers (anionic hydrogels) by C. versicolor,” Sci. Rep.-UK 7, 1-13. DOI: 10.1038/s41598-017-17696-1
Bugg, T. D. H., Ahmad, M., Hardiman, E. M., and Singh, R. (2011). “The emerging role for bacteria in lignin degradation and bio-product formation,” Curr. Opin. Biotech. 22(3), 394-400. DOI: 10.1016/j.copbio.2010.10.009
Chandra, R., Abhishek, A., and Sankhwar, M. (2011). “Bacterial decolorization and detoxification of black liquor from rayon grade pulp manufacturing paper industry and detection of their metabolic products,” Bioresour. Technol. 102(11), 6429-6436. DOI: 10.1016/j.biortech.2011.03.048
Chandra, R., and Bharagava, R. N. (2013). “Bacterial degradation of synthetic and kraft lignin by axenic and mixed culture and their metabolic products,” J. Environ. Biol. 34(6), 991-999.
Chandra, R., Raj, A., Purohit, H. J., and Kapley, A. (2007). “Characterisation and optimisation of three potential aerobic bacterial strains for kraft lignin degradation from pulp paper waste,” Chemosphere 67(4), 839-846. DOI: 10.1016/j.chemosphere.2006.10.011
Fernaud, J. R. H., Carnicero, A., Perestelo, F., Cutuli, M. H., Arias, E., and Falcón, M. A. (2006). “Upgrading of an industrial lignin by using laccase produced by Fusarium proliferatum and different laccase-mediator systems,” Enzyme Microb. Tech. 38(1-2), 40-48. DOI: 10.1016/j.enzmictec.2005.01.043
Font, X., Caminal, G., Gabarrell, X., Romero, S., and Vicent, M. T. (2003). “Black liquor detoxification by laccase of Trametes versicolor pellets,” J. Chem. Technol. Biot. 78(5), 548-554. DOI: 10.1002/jctb.834
Fuchs, G., Boll, M., and Heider, J. (2011). “Microbial degradation of aromatic compounds—From one strategy to four,” Nat. Rev. Microbiol. 9(11), 803-816. DOI: 10.1038/nrmicro2652
Ghoul, M., and Chebil, L. (2012). Enzymatic Polymerization of Phenolic Compounds by Oxidoreductases, Springer Netherlands, Dordrecht, Netherlands.
Jeon, J.-R., and Chang, Y.-S. (2013). “Laccase-mediated oxidation of small organics: Bifunctional roles for versatile applications,” Trends Biotechnol. 31(6), 335-341. DOI: 10.1016/j.tibtech.2013.04.002
Kim, K. H., Dutta, T., Walter, E. D., Isern, N. G., Cort, J. R., Simmons, B. A., and Singh, S. (2017). “Chemoselective methylation of phenolic hydroxyl group prevents quinone methide formation and repolymerization during lignin depolymerization,” ACS Sustain. Chem. Eng. 5(5), 3913-3919. DOI: 10.1021/acssuschemeng.6b03102
Lara, M. A., Rodrı́guez-Malaver, A. J., Rojas, O. J., Holmquist, O., González, A. M., Bullón, J., Peñaloza, N., and Araujo, E. (2003). “Black liquor lignin biodegradation by Trametes elegans,” Int. Biodeter. Biodegr. 52(3), 167-173. DOI: 10.1016/S0964-8305(03)00055-6
Leonowicz, A., Szklarz, G., and Wojtaś-Wasilewska, M. (1985). “The effect of fungal laccase on fractionated lignosulphonates (peritan Na),” Phytochemistry 24(3), 393-396. DOI: 10.1016/S0031-9422(00)80734-7
Minu, K., Jiby, K. K., and Kishore, V. V. N. (2012). “Isolation and purification of lignin and silica from the black liquor generated during the production of bioethanol from rice straw,” Biomass Bioenerg. 39, 210-217. DOI: 10.1016/j.biombioe.2012.01.007
Narde, G. K., Kapley, A., and Purohit, H. J. (2004). “Isolation and characterization of Citrobacter strain HPC255 for broad-range substrate specificity for chlorophenols,” Curr. Microbiol. 48(6), 419-423. DOI: 10.1007/s00284-003-4230-2
Okuda, N., Soneura, M., Ninomiya, K., Katakura, Y., and Shioya, S. (2008). “Biological detoxification of waste house wood hydrolysate using Ureibacillus thermosphaericus for bioethanol production,” J. Biosci. Bioeng. 106(2), 128-133. DOI: 10.1263/jbb.106.128
Pearl, I., and Benson, H. K. (1940). “The determination of lignin in sulphide pulping liquor,” Paper Trade Journal 111, 35-36.
Pokhrel, D., and Viraraghavan, T. (2004). “Treatment of pulp and paper mill wastewater—A review,” Sci. Total Environ. 333(1-3), 37-58. DOI: 10.1016/j.scitotenv.2004.05.017
Prasetyo, E. N., Kudanga, T., Østergaard, L., Rencoret, J., Gutiérrez, A., del Río, J. C., Santos, J. I., Nieto, L., Jiménez-Barbero, J., Martínez, A. T., et al. (2010). “Polymerization of lignosulfonates by the laccase-HBT (1-hydroxybenzotriazole) system improves dispersibility,” Bioresour. Technol. 101(14), 5054-5062. DOI: 10.1016/j.biortech.2010.01.048
Raj, A., Reddy, M. M. K., and Chandra, R. (2007a). “Decolourisation and treatment of pulp and paper mill effluent by lignin-degrading Bacillus sp.,” J. Chem. Technol. Biot. 82(4), 399-406. DOI: 10.1002/jctb.1683
Raj, A., Reddy, M. M. K., and Chandra, R. (2007b). “Identification of low molecular weight aromatic compounds by gas chromatography–mass spectrometry (GC–MS) from kraft lignin degradation by three Bacillus sp.,” Int. Biodeter. Biodegr. 59(4), 292-296. DOI: 10.1016/j.ibiod.2006.09.006
Raj, A., Reddy, M. M. K., Chandra, R., Purohit, H. J., and Kapley, A. (2007c). “Biodegradation of kraft-lignin by Bacillus sp. isolated from sludge of pulp and paper mill,” Biodegradation 18(6), 783-792. DOI: 10.1007/s10532-007-9107-9
Raj, A., Kumar, S., Haq, I., and Singh, S. K. (2014). “Bioremediation and toxicity reduction in pulp and paper mill effluent by newly isolated ligninolytic Paenibacillus sp.,” Ecol. Eng. 71, 355-362. DOI: 10.1016/j.ecoleng.2014.07.002
Ramalingam, B., Sana, B., Seayad, J., Ghadessy, F. J., and Sullivan, M. B. (2017). “Towards understanding of laccase-catalysed oxidative oligomerisation of dimeric lignin model compounds,” RSC Adv. 7(20), 11951-11958. DOI: 10.1039/C6RA26975C
Rittstieg, K., Suurnakki, A., Suortti, T., Kruus, K., Guebitz, G., and Buchert, J. (2002). “Investigations on the laccase-catalyzed polymerization of lignin model compounds using size-exclusion HPLC,” Enzyme Microb. Tech. 31(4), 403-410. DOI: 10.1016/S0141-0229(02)00102-3
Sachan, A., Ghosh, S., and Mitra, A. (2006). “Biotransformation of p-coumaric acid by Paecilomyces variotii,” Lett. Appl. Microbiol. 42(1), 35-41. DOI: 10.1111/j.1472-765X.2005.01801.x
Schroyen, M., Van Hulle, S. W. H., Holemans, S., Vervaeren, H., and Raes, K. (2017). “Laccase enzyme detoxifies hydrolysates and improves biogas production from hemp straw and miscanthus,” Bioresource Technol. 244(Part 1), 597-604. DOI: 10.1016/j.biortech.2017.07.137
Ulmer, D. C., Leisola, M. S. A., Schmidt, B. H., and Fiechter, A. (1983). “Rapid degradation of isolated lignins by Phanerochaete chrysosporium,” Appl. Environ. Microb. 45(6), 1795-1801.
Upton, B. M., and Kasko, A. M. (2016). “Strategies for the conversion of lignin to high-value polymeric materials: Review and perspective,” Chem. Rev. 116(4), 2275-2306. DOI: 10.1021/acs.chemrev.5b00345
Viswanath, B., Rajesh, B., Janardhan, A., Kumar, A. P., and Narasimha, G. (2014). “Fungal laccases and their applications in bioremediation,” Enzyme Res. 2014. DOI: 10.1155/2014/163242
Wang, Q., Dai, J., Yu, Y., Zhang, Y., Shen, T., Liu, J., and Wang, R. (2010). “Efficiencies of different microbial parameters as indicator to assess slight metal pollutions in a farm field near a gold mining area,” Environ. Monit. Assess. 161(1-4), 495-508. DOI: 10.1007/s10661-009-0763-6
Westermark, U., and Eriksson, K.-E. (1974). “Cellobiose: Quinone oxidoreductase, a new wood-degrading enzyme from white-rot fungi,” Acta Chem. Scand. 28b, 209-214. DOI: 10.3891/acta.chem.scand.28b-0209
Yan, L., and Qi, X. (2014). “Degradation of cellulose to organic acids in its homogeneous alkaline aqueous solution,” ACS Sustain. Chem. Eng. 2(4), 897-901. DOI: 10.1021/sc400507s
Yang, C., Niu, Y., Su, H., Wang, Z., Tao, F., Wang, X., Tang, H., Ma, C., and Xu, P. (2010). “A novel microbial habitat of alkaline black liquor with very high pollution load: Microbial diversity and the key members in application potentials,” Bioresour. Technol. 101(6), 1737-1744. DOI: 10.1016/j.biortech.2009.09.092
Yewale, T., Panchwagh, S., Rajagopalan, S., Dhamole, P. B., and Jain, R. (2016). “Enhanced xylitol production using immobilized Candida tropicalis with non-detoxified corn cob hemicellulosic hydrolysate,” 3 Biotech 6(1), 75. DOI: 10.1007/s13205-016-0388-8
Zhang, D., Ong, Y. L., Li, Z., and Wu, J. C. (2013). “Biological detoxification of furfural and 5-hydroxyl methyl furfural in hydrolysate of oil palm empty fruit bunch by Enterobacter sp. FDS8,” Biochem. Eng. J. 72, 77-82. DOI: 10.1016/j.bej.2013.01.003
Zheng, Y., Chai, L.-Y., Yang, Z.-H., Tang, C.-J., Chen, Y.-H., and Shi, Y. (2013). “Enhanced remediation of black liquor by activated sludge bioaugmented with a novel exogenous microorganism culture,” Appl. Microbiol. Biot. 97(14), 6525-6535. DOI: 10.1007/s00253-012-4453-x
Zhu, D., Zhang, P., Xie, C., Zhang, W., Sun, J., Qian, W.-J., and Yang, B. (2017). “Biodegradation of alkaline lignin by Bacillus ligniniphilus L1,” Biotechnol. Biofuels 10(1), 44. DOI: 10.1186/s13068-017-0735-y
Article submitted: August 24, 2018; Peer review completed: October 28, 2018; Revised version received: November 15, 2018; Accepted: November 30, 2018; Published: December 12, 2018. DOI: 10.15376/biores.14.1.1049-1076