
Abstract
For the detection of wood surface defects, a convolutional neural network has a low detection efficiency and insufficient generalization ability, so it does not meet the requirements of online detection. Aiming to solve the above problems, the YOLOv3 baseline model, which has the advantage of multi-objective dynamic detection, was improved and applied to the online detection of wood surface defects. To solve the problem of the poor generalization ability of the network, GridMask was used to enhance the data and improve the robustness of the network. In order to solve the problem of the considerable amount of network parameter calculations and insufficient real-time performance, the residual block of the backbone network was changed to a Ghost block structure to achieve a lightweight model. Finally, the confidence loss function of the network was improved to reduce the influence of simple samples and negative samples on model convergence. The experimental results showed that, compared with the original network, the improved algorithm increased the mean average precision by 5.73% and the detection speed was increased to 28 frames per second (an increase of 11), which met the requirements for real-time industrial detection.
Download PDF
Full Article
Detection of Wood Surface Defects Based on Improved YOLOv3 Algorithm
Baogang Wang,a,b Chunmei Yang,a,* Yucheng Ding,a and Guangyi Qin a
For the detection of wood surface defects, a convolutional neural network has a low detection efficiency and insufficient generalization ability, so it does not meet the requirements of online detection. Aiming to solve the above problems, the YOLOv3 baseline model, which has the advantage of multi-objective dynamic detection, was improved and applied to the online detection of wood surface defects. To solve the problem of the poor generalization ability of the network, GridMask was used to enhance the data and improve the robustness of the network. In order to solve the problem of the considerable amount of network parameter calculations and insufficient real-time performance, the residual block of the backbone network was changed to a Ghost block structure to achieve a lightweight model. Finally, the confidence loss function of the network was improved to reduce the influence of simple samples and negative samples on model convergence. The experimental results showed that, compared with the original network, the improved algorithm increased the mean average precision by 5.73% and the detection speed was increased to 28 frames per second (an increase of 11), which met the requirements for real-time industrial detection.
Keywords: Deep learning; Wood defects detection; You Only Look Once; Convolution neural network; Data enhancement
Contact information: a: School of Electromechanical Engineering, Northeast Forestry University, Harbin 150040 China; b: Mechanical Engineering College of Heilongjiang Vocational College of Agricultural Engineering, Harbin 150088 China; *Corresponding author: ycmnefu@126.com (C. Yang)
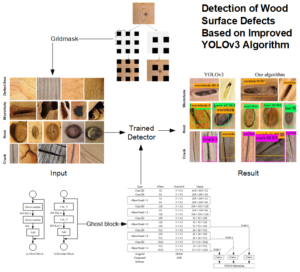
GRAPHICAL ABSTRACT

INTRODUCTION
Forestry is an important part of modern industrial production. With the development and progress of technology, automatic and intelligent visualization technology can improve the utilization rate of forestry resources and save forestry resources (Lee et al. 2011). The defects in wood are an important standard in terms of evaluating the quality and commercial value of wood. To improve the utilization rate of wood, it is necessary to detect and classify wood in order to meet the needs of different industries for specific characteristics of wood. In traditional wood processing, the high-quality defect detection and classification of wood often relies on the naked eye observation of experienced inspectors; therefore, the efficiency and accuracy of this method cannot be guaranteed. With the rapid development of sensor and computer technologies, related non-destructive testing technology has been gradually applied to the field of wood testing, e.g., laser technology, infrared technology, mechanical technology, ultrasonic technology, X-ray technology, machine vision technology, etc. (Zhang et al. 2016).
In the field of wood recognition, traditional machine vision technology is used to extract texture features of objects and then classify them. For example, Gabor filters, HOG (histogram of oriented gradients), GLCM (gray level covariance matrix), LBP (local binary patterns), and other methods are used to extract features, which then are combined with SVM (support vector machines), multilayer perceptron, k-nearest neighbors (KNN), linear discriminant analysis (LDA), backpropagation neural network, and other methods for classification and recognition (Jing et al. 2009; Martins et al. 2013; Yang et al. 2018; Urbonas et al. 2019). With the improvement of computer computing power, deep learning has made a breakthrough in image processing, especially in terms of deep convolution networks, which has entered a stage of rapid development. In the ImageNet image classification contest, starting from AlexNet, VGGNet, ResNet, and GoogLeNet, other algorithms have appeared one after another.
In the field of target detection, the approaches that have been employed can be divided into two categories according to whether there is a pre-check box or not. Region generation is carried out by R-CNN, SPP-Net, Faster R-CNN, and R-FCN (He et al. 2017). Features are directly extracted from the network to predict the classification and location of objects, e.g., OverFeat, YOLO series, SSD, RetinaNet, etc.
Above all, wood defects detection models based on target detection algorithms often have multiple problems, e.g., complex models, large amounts parameter calculations, and poor real-time performance. Moreover, due to the large amount of data, the model generalization ability cannot be guaranteed. Due to its excellent detection speed and accuracy, YOLO (you look only once) algorithms are widely used in fruit quality inspection (Tian et al. 2019), automatic driving (Choi et al. 2019), CT image recognition (Pang et al. 2019), and other fields. This paper aims at the deficiency of the above reported approaches and proposes a wood defect detection model based on the improved YOLOv3 algorithm. Discarding of information on simple data sets to reduce overfitting the GridMask technology was used to enhance the generalization ability. In addition, the residual block of the backbone network was changed to the Ghostblock structure to reduce the amount of parameter calculations in the network. Finally, the confidence loss of the network was improved, and the proportion of negative samples and simple samples in the network was balanced to improve the recall rate of the network.
EXPERIMENTAL
Data Set and Annotation
The data set used in the experiments consisted of the wood defect images collected with the camera, and the region of interest was extracted which included 450 pictures each of defect free, wormholes, knots, and cracks, totaling 1800 pictures. Part of the wood image set came from Datang lumber industry Company Ltd., Ganzhou, Jiangxi, China. The main types of trees were oak, pine, and birch. The pixels of the image were 200×200, and each defective picture included one or more defects. This is a relatively small data set, so data enhancement techniques were used to enhance the generalization ability of the model. Through the analysis of the data set, it was found that there were no large defects with an area larger than 96×96 in the data set, only small defects smaller than 32×32 and medium defects in the range of 32×32 to 96×96. Part of the defect images are shown in Fig. 1.
The labeling of the data set used the LabelImg software (version1.8.4) to manually label the image to obtain the .xml file containing the picture information and the label box information (xmin, ymin, xmax, and ymax). Then, the format conversion script was used to obtain the .txt training file, which included the defect label and location file.

Fig. 1. Images of wood defects (the dataset including 450 pictures each of defect free, wormholes, knots, and cracks, totaling 1800 pictures)
Methods
The YOLO series algorithm is a single-stage object detection algorithm proposed by Redmon et al. in 2016, although the third generation (YOLOv3) is now widely used (Redmon et al. 2016; Redmon and Farhadi 2017; Redmon and Farhadi 2018). Different from the two-stage object detection network, the candidate area is first regressed through the anchor (Ren et al. 2017). Then, the candidate area is regressed and classified to output the final detection result. The YOLOv3 algorithm takes object detection as an end-to-end regression problem and directly conducts regression and classification of the anchor to obtain the final result, which greatly improves the detection speed. The key advantage of the YOLOv3 algorithm is that the Darknet53 framework proposed by Resnet deepens the convolutional network to 106 layers (He et al. 2016). The feature extraction capability of the network is strengthened, and the fast link of the residual network is introduced to solve the problem of gradient explosion or disappearance while the network is deepened. The other advantage is that the multi-scale feature pyramid structure is adopted for prediction, and three feature layers of different sizes are taken from the backbone network for prediction. Thus, multi-scale detection is realized. Figure 2 shows the network structure and multi-scale prediction of the YOLOv3 algorithm.
Although the YOLOv3 algorithm has certain advantages in terms of precision and speed compared with other models, it still has some shortcomings if applied to the task of directly detecting wood defects. First, the Darknet53 framework has a structure with a depth of 106 layers and multi-scale prediction, which greatly increases the complexity of the model and the amount of parameter calculations. This causes higher requirements in terms of the hardware equipment needed for wood defects detection under practical applications. Second, the YOLOv3 algorithm uses multiple scales to predict the object, but for small defects, e.g., cracks, there are still problems, e.g., insufficient feature learning and poor generalization ability. Third, in the YOLOv3 algorithm, the cross entropy method is adopted for confidence loss, but negative samples and simple samples account for a majority of the calculation process; in such situations, the loss function cannot provide correct guidance for the model. Aiming at solving the above shortcomings, this paper has made the corresponding improvements and optimizations to the YOLOv3 algorithm.

Fig. 2. The YOLOv3 network structure and multi-scale prediction. Each convolution part of the Darknet53 framework uses a unique structure (Conv2D), i.e., the CBR part. After each convolution, the BN (batch normalization) and ReLu activation function are also used.
Improvements to the YOLOv3 Algorithm
GridMask data enhancement
A high-quality convolutional network has millions of parameters, which requires a large amount of data for training. Otherwise, serious overfitting problems will occur, and the YOLOv3 algorithm is not an exception to this rule (Krizhevsky et al. 2017). However, it is not realistic to obtain such large amounts of data in terms of practical use, so data augmentation technology was adopted. Existing data augmentation technologies can be divided into three categories: (1) Spatial transformation, e.g., cropping, random rotation, etc.; (2) Color distortion, e.g., adding noise, changing brightness, etc.; and (3) Information deletion, e.g., random erasing, Cutot, etc. (Zhong et al. 2017; Devries and Taylor 2018).
Information deletion technology is widely used because of its effectiveness. By deleting part of the image information, the convolutional network can learn the originally insensitive or unimportant information, so the robustness of the model has increased. GridMask is a data augmentation method of information deletion by generating a mask image with the same resolution as the original image (Chen et al. 2020). The mask image is then multiplied by the original image to produce the new image (as shown in Fig. 3). In the present work, three types of defects were studied, i.e., wormholes, knots, and cracks. Therefore, the r was set to 0.4 to discard more information and reduce the risk of overfitting. The d was set to a random value, i.e., d ∈ random (178,416) (the YOLOv3 image input size is 416 × 416) to increase the diversity of the mask images and achieve higher network robustness. At the same time, as the number of training rounds increased, the probability (P) that the image was enhanced by GridMask is gradually increased until P equaled 0.7. By deleting a structured area and an evenly distributed square area, the target information in the image was appropriately deleted to enhance the generalization ability of the network.
Lightweight model
The YOLOv3 algorithm is difficult to run in embedded devices due to its 106-layer network depth and its multi-scale design. Therefore, it was necessary to lighten its network model. Common lightweight methods include network pruning (Han et al. 2015), knowledge distillation (Hinton et al. 2015), etc. In addition, there are more efficient convolution structures, e.g., deep point convolution (Howard et al. 2020) and grouped convolution (Zhang et al. 2018), that can reduce network parameters and calculations.
The convolution operation in the convolutional network will generate a large number of similar feature maps. The generation of these similar feature maps occupies most of the network parameters and calculations. These redundant feature maps are particularly important for the network to ensure that the network understands the input. A simple operation-Ghost module was used to generate these redundant feature maps, which reduced the amount of network calculations (Han et al. 2020). The normal convolutional layer operations and Ghost module operations are shown in Fig. 4.

Fig. 3. GridMask data augmentation and their parameters. The black region in the mask has the value of 0, which represents the deletion region, thus the deletion of information for a specific region has achieved. The parameters in the figure are the four parameters (x, y, r, and d) that need to be controlled for the GridMask operation on the image. The red box represents a basic mask unit, and (x, y) is the distance between the first mask unit and the edge of the image. The r is the proportion of the retained image, and the d is the length of a basic mask unit.

Fig. 4. Comparison of the two operations
Figure 4a is a common convolution operation, which directly generates a large number of feature maps through the convolution kernel. Figure 4b is the Ghost module operation, which is divided into two steps to obtain the same number of feature maps as the ordinary convolutional layer. First, a small number of convolution kernels (half of the convolution kernels in the shown in Fig. 3) are used to generate a part of the feature maps. The feature maps are then linearly operated to generate the remaining feature maps, which reduces the amount of calculations during the convolution operation.
The Ghost block, which is composed of the Ghost module, is shown in Fig. 5, and it is similar in structure to the residual block. However, the ReLU activation function is not used after the second module. In the present work the Ghost block was replaced with the residual module of the YOLOv3 algorithm to ensure that the model is more lightweight. The improved YOLOv3 model is shown in Fig. 6. The residual block used in the backbone network is replaced with a Ghost block structure. Each Ghost block uses half the number of convolution kernels compared to the original network, and the linear operation of the Ghost module is used to reduce the network. The amount of calculations does not change the multi-scale prediction of the original network, and the target prediction is achieved from three scale feature maps (52 × 52), (26 × 26), and (13 × 13).

Fig. 5. Ghost block and residual block structure

Fig. 6. Improved YOLOv3 structure
Improving confidence loss
In two-stage target detection algorithms, sampling methods are often used to control the proportion of positive and negative samples. However, in single-stage target detection algorithms, a phenomenon causing a balance between positive and negative samples often occurs. A large number of negative samples and simple samples will cause the model to converge in an undesirable direction. Focal loss (Lin et al. 2017) controls negative samples and simple samples by adding a penalty coefficient (α) and a modulation factor (γ) to the CE (cross-entropy) loss, as shown in Eq. 1,
 (1)
(1)
Considering the imbalance of positive and negative samples in the model, negative samples are given a penalty coefficient to reduce the proportion of negative samples. The cross-entropy loss after adding the penalty coefficient is shown in Eq. 2,
 (2)
(2)
In order to make the model focus more on difficult samples, focal loss adds a modulation factor (γ) to the penalty coefficient. The improved focal loss model is shown in Eq. 3,
 (3)
(3)
The loss function of the YOLOv3 algorithm is composed of regression loss, classification loss, and confidence loss. The regression loss uses the mean square error function, and it is calculated only if a true box is included, so there is no category imbalance. The classification loss uses the cross-entropy function, where the YOLOv3 algorithm controls the proportion of positive and negative samples by setting thresholds and ignoring a large number of target boxes. Therefore, there is no imbalance between the positive and negative samples. The confidence loss adopts the cross-entropy loss, as shown in Eq. 4,
 (4)
(4)
where there are a total of grids in the YOLOv3 algorithm and each grid generates the number of prediction boxes (B), and  represents whether the j-th box of the i-th grid is responsible for predicting the object. If
  is responsible for 1, then
  represents the true value and
  represents the prediction value. From Eq. 4, it can be seen that regardless of whether the anchor box is responsible for a certain target, it is necessary to calculate the confidence loss. If the box contains objects, then the regression loss, category loss, and confidence loss of this box must be calculated to update the weight. However, if the anchor box is not responsible for predicting a certain target, then only its confidence error needs to be calculated. There are many negative samples and simple samples. Therefore, this study changed the confidence loss of the YOLOv3 algorithm to focal loss to control the weight of the negative samples and simple samples in the confidence loss. The confidence loss of the YOLOv3 algorithm after introducing focal loss is shown in Eq. 5,
 (5)
(5)
where the penalty coefficient (α) is set to 0.75 and the modulation factor (γ) is set to 2. This greatly reduces the influence of simple samples and negative samples on the loss gradient descent and provides a correct guidance loss function for model training.
Network Training
This experiment was carried out using the Windows 10 operating system, with a Darknet_53 deep learning framework. The hardware server equipment included the following: an Intel i5-7300HQ CPU, and a GTX 1050 GPU, with the addition of a CUDA9.2 and CUDNN to help the GPU to accelerate calculations. The learning rate was set to 0.001. The attenuation coefficient of the weight was 0.0005, and the asynchronous stochastic gradient descent with a momentum term was 0.9. The input image size was normalized to 416 × 416.
The loss curves during the training process (as shown in Fig. 7) were trained with the original YOLOv3 model and the improved YOLOv3 training data set, respectively. It can be seen that the improved YOLOv3 algorithm exhibited a faster network convergence speed and a smaller overall loss value of the model. The loss of the original network was stable at 0.12 with 105 epochs, while the loss of the improved network was stabilized at approximately 0.07 with 95 epochs.

Fig. 7. Comparison of the training loss. The loss of the original network was stable at 0.12 with 105 epochs, while the loss of the improved network was stabilized at approximately 0.07 with 95 epochs.
The Detection Effect of the Model on the Test Set
The performance of the model was measured with mAP (mean average precision), FPS (frames per second), and weight file size. The mAP is the mean value of the AP (average precision) of each category, and the AP is the average value of all the precision values in which the recall rate of each category changed from 0 to 1, calculated using Eq. 6,
 (6)
(6)
where P (precision) represents the classification accuracy, R (recall) represents the recall rate of the network, TP represents the detected positive example, FP represents the detected negative example, FN represents the undetected positive example, and represents the precision when the recall value of the i-th category is . Frames per second is an indicator to measure the speed of model detection. The weight file is a collection of the model and all parameters. The smaller the weight file, the lighter the model and the smaller the number of parameters.
There are a total of 300 defect pictures in the test set, 100 each of wormholes, nodules, and cracks. The trained YOLOv3 network and the improved algorithm were separately used to detect the test set. The AP values of the three defects, the accuracy (P), the recall value (R), and the mAP are shown in Fig. 8. Part of the test results are shown in Fig. 9.

Fig. 8. The improved network and the detection results of the original network

Fig. 9. Detection results of some defects
Experimental Results Analysis
The experimental results show that the recognition effect of the improved algorithm in this paper was better than the recognition effect of the original YOLOv3 network. In the identification of cracks, the AP increased from 68.8% to 77.2%. However, the AP value was still remarkably high. The reason for this is that cracks are extremely similar to the texture of the wood, and some of the cracks are narrow, which affects the recognition of the original network. However, the original network was enhanced with GridMask data, and the confidence loss of the original network was improved. As such, the recognition value of the network for small targets, e.g., cracks was greatly improved. At the same time, for wormholes and knots, the AP also increased by 4.44% and 4.31%, respectively, and the total mAP also increased from 80.8% in the original network to 86.5% in the improved network. Through experiments, the authors also found that the recall value (R) of the network increased by 11%, and the accuracy (P) increased by 8%. It can be seen that the improved network does not sacrifice the recall rate of the network while taking into account the accuracy rate. It also demonstrates the robustness of the improved network.
The weight file of the original network was 234 M, and the improved network was only 144 M after calculation. Therefore, the weight file was reduced by 38%. This showed that changing the residual block of the backbone network to the Ghostblock reduced the amount of model parameters. The speed of the original network detection was 17 FPS, while the speed of the improved network was 28 FPS. As the number of visible models were reduced, the detection speed was greatly improved, and the portability of the model would also improve.
For further analysis of the effect of the original and improved networks on defect identification, some of the detected images are shown in Fig. 10. From Fig. 10, it can be seen that the original network exhibited missed detections and low confidence in the identification of wormholes, while the improved network achieved a confidence in the detection of wormholes close to 100%. In terms of the recognition of knots, due to the similarity between knots and wormholes, there were a large number of mis-examinations, which the improved network avoided. This indicated that the improved network more fully learned the characteristics of knots. For the identification of cracks, the original network and the improved network all showed leaking and mis-checking, because small cracks and the texture characteristics of wood are extremely similar. However, the improved network still was greatly improved in terms of crack detection. Furthermore, wood cracks can be reduced by utilizing certain suitable storage environments. In short, the improved network reflects greater advantages in defect detection. More detailed features can be learned, and the accuracy of defect identification and recall rates are much higher than the original algorithm.

Fig. 10. Comparison of the improved network and the original network recognition effect
Ablation Experiment
An ablation experiment is an indispensable link in deep learning. It can clearly reveal the impact of each link on the performance of the entire network, and it is also the best way to verify whether the improved conjecture is really effective. The results of the ablation experiment are shown in Table 1. In the table, a ☆ means that this improvement was not added, and a ★ means that this improvement was added. The evaluation indicators refer to the item described above. The experimental results show that after adding GridMask to the image enhancement in the second group of control experiments, the mAP had a 1.13% improvement, primary concentrated on cracks, because the original network did not sufficiently learn the characteristics of cracks. After the image was enhanced, the network learned additional features that were not easily learned in the original network, and this increased the generalization ability and robustness of the network. In this way, information dropping in a specific area is realized, which can be understood as a regularization method in essence. In the third set of control experiments, the residual block of the backbone network was changed to the Host block. However, the detection effect of the network was not considerably reduced, i.e., it was essentially consistent with the original network, but the amount of parameters decreased by 38%. The detection speed increased from 17 FPS to 28 FPS (an increase of 65%), so the real-time performance of the network was greatly improved. The Ghost module can use fewer parameters to generate the same number of feature maps as ordinary convolutional layers and then integrate them with other networks, which can reduce the computational cost. In the fourth experiment, after changing the confidence loss of the original network to focal loss, the performance of the network was greatly improved. The mAP increased by 3%, while the AP value of crack detection increased by 5%. Therefore, in comparison to the confidence loss of the original network, the positive and negative sample imbalance of the original network were all improved, and the detection effect was drastically improved. In the last set of experiments, the mAP fusion of all improved models was the highest, reaching 86.5%, and the detection speed reached 28 FPS, which balanced the detection accuracy and detection speed. In summary, the improvements made to the YOLOv3 algorithm in this paper were meaningful in terms of improving the detection of wood defects.
Table 1. Results of the Ablation Experiments

CONCLUSIONS
- Aiming to solve the deficiencies of the You Only Look Once, version 3 (YOLOv3) network in terms of the detection of wood surface defects, the GridMask data enhancement technology was adopted to enhance the data set, which improved the generalization ability and robustness of the network.
- At the same time, considering the real-time problem of the network, the Ghost block was selected to replace the residual block in the YOLOv3 algorithm, so the amount of network calculations were reduced, which caused the detection speed of the network to improve.
- To solve the low recall value of the YOLOv3 network, focal loss was used to improve the confidence loss of the original network, and the detection accuracy and recall value of the network were greatly improved.
- The final experimental results show that the mAP of the improved YOLOv3 network reached 86.5%, with a detection speed of 28 FPS, which can be used in on-line industrial defect detection. On the server side, massive data and computing resources are used to train the model, and then the trained model is deployed to the mobile terminal, and only the computing power of the mobile terminal is used for reasoning. This will be the trend of machine learning landing on the mobile side.
ACKNOWLEDGMENTS
This research was funded by the Fundamental Research Funds for the Central Universities (Grant No. 2572020DR12) and the Research and Applied Technology Research and Development Programme of Heilongjiang Province (Grant No. GA19A402).
REFERENCES CITED
Chen, P., Liu, S., Zhao, H., and Jia, J. (2020). “GridMask data augmentation,” (https://arxiv.org/abs/2001.04086), Accessed January 14, 2020.
Choi, J., Chun, D., Kim, H., and Lee, H.-J. (2019). “Gaussian YOLOv3: An accurate and fast object detector using localization uncertainty for autonomous driving,” in: Proceedings of the 2019 IEEE/CVF International Conference on Computer Vision, 27 October-2 November, Seoul, South Korea, pp. 502-511.
DeVries, T., and Taylor, G. W. (2017). “Improved regularization of convolutional neural networks with cutout,” (https://arxiv.org/abs/1708.04552), Accessed November 29, 2017.
Han, K., Wang, Y., Tian, Q., Guo, J., and Xu, C. (2020). “GhostNet: More features from cheap operations,” in: Proceedings of the 2020 IEEE/CVF Conference on Computer Vision and Pattern Recognition, 13-19 June, Seattle, WA, pp. 1577-1586.
Han, S., Mao, H., and Dally, W. J. (2015). “Deep compression: Compressing deep neural networks with pruning, trained quantization and Huffman coding,” (https://arxiv.org/abs/1510.00149), Accessed October 1, 2015.
He, K., Gkioxari, G., Dollár, P., and Girshick, R. (2017). “Mask R-CNN,” in: 2017 IEEE International Conference on Computer Vision, 22-29 October, Venice, Italy, pp: 2980-2988.
He, K., Zhang, X., Ren, S., and Sun, J. (2016). “Deep residual learning for image recognition,” in: Proceedings of the 2016 IEEE Conference on Computer Vision and Pattern Recognition, 27-30 June, Las Vegas, NV, pp. 770-778.
Hinton, G., Vinyals, O., and Dean, J. (2015). “Distilling the knowledge in a neural network,” (https://arxiv.org/abs/1503.02531), Accessed March 9, 2015.
Howard, A., Sandler, M., Chen, B., Wang, W., Chen, L.-C., Tan, M., Chu, G., Vasudevan, V., Zhu, Y., Pang, R., et al. (2020). “Searching for MobileNetV3,” in: Proceedings of the 2019 IEEE/CVF International Conference on Computer Vision, 27 October-2 November, Seoul, South Korea, pp. 1314-1324.
Jing, Y. T., Yong, Y. H., and Lau, P. Y. (2009). “A comparative study for texture classification techniques on wood species recognition problem,” in: Proceedings of the 2009 Fifth International Conference on Natural Computation, 14-16 August, Tianjian, China, pp. 8-12.
Krizhevsky, A., Sutskever, L., and Hinton, G. E. (2017). “ImageNet classification with deep convolutional neural networks,” Communications of the ACM 60(6), 84-90. DOI: 10.1145/3065386
Lee, S., Lee, S.-J., Lee, J. S., Kim, K.-B., Lee, J.-J., and Yeo, H. (2011). “Basic study on nondestructive evaluation of artificial deterioration of a wooden rafter by ultrasonic measurement,” Journal of Wood Science 57(5), 387-394. DOI: 10.1007/s10086-011-1186-x
Lin, T.-Y., Gotal, P., Gieshick, R., He, K., and Dollár, P. (2017). “Focal loss for dense object detection,” Proceedings of the IEEE Transactions on Pattern Analysis and Machine Intelligence 42(2), 318-327. DOI: 10.1109/TPAMI.2018.2858826
Martins, J., Oliveira, L. S., Nisgoski, S., and Sabourin, R., (2013). “A database for automatic classification of forest species,” Machine Vision and Applications 24(3), 567-578. DOI: 10.1007/s00138-012-0417-5
Pang, S., Ding, T., Qiao, S., Meng, F., Wang, S., Li, P., and Wang, X. (2019). “A novel YOLOv3-arch model for identifying cholelithiasis and classifying gallstones on CT images,” PlosONE 14(6), 1-11. DOI: 10.1371/journal.pone.0217647
Redmon, J., and Farhadi, A. (2017). “YOLO9000: Better, faster, stronger,” in: 2017 Proceedings of the IEEE Conference on Computer Vision and Pattern Recognition, 21-26 July, Honolulu, HI, pp. 6517-6525.
Redmon, J., and Farhadi, A. (2018). “YOLOv3: An incremental improvement,” (https://arxiv.org/abs/1804.02767), Accessed April 1, 2018.
Redmon, J., Divvala, S., Girshick, R., and Farhadi, A. (2016). “You only look once: Unified, real-time object detection,” in: 2016 IEEE Conference on Computer Vision and Pattern Recognition, 27-30 June, Las Vegas, NV, pp. 779-788.
Ren, S., He, K., Girshick, R., and Sun, J. (2017). “Faster R-CNN: Towards real-time object detection with region proposal networks,” Proceedings of the IEEE Transactions on Pattern Analysis and Machine Intelligence 39(6), 1137-1149. DOI: 10.1109/TPAMI.2016.2577031
Tian, Y., Yang, G., Wang, Z., Wang, H., Li, E., and Liang, Z. (2019). “Apple detection during different growth stages in orchards using the improved YOLO-V3 model,” Computers and Electronics in Agriculture 157, 417-426. DOI: 10.1016/j.compag.2019.01.012.
Urbonas, A., Raudonis, V., Maskeliūnas, R., and Damaševičius, R. (2019). “Automated identification of wood veneer surface defects using faster region-based convolutional neural network with data augmentation and transfer learning” Applied Sciences 9(22), 1-20. DOI: 10.3390/app9224898
Yang, F., Wang, Y., Wang, S., and Cheng, Y. (2018). “Wood veneer defect detection system based on machine vision,” in: Proceedings of the 2018 International Symposium on Communication Engineering & Computer Science, 28-29 July, Hohhot, China, pp. 413-418.
Zhang, H., Guan C., and Wen, J. (2016). “Applications and research development of nondestructive testing of wood-based materials.” Journal of Forestry Engineering 1(6), 1-9.
Zhang, X., Zhou, X., Lin, M., and Sun, J. (2018). “ShuffleNet: An extremely efficient convolutional neural network for mobile devices,” in: Proceedings of the 2018 IEEE/CVF Conference on Computer Vision and Pattern Recognition, 18-23 June, Salt Lake City, UT, pp. 6848-6856.
Zhong, Z., Zheng, L., Kang, G., Li, S., and Yang, Y. (2017). “Random erasing data augmentation,” Proceedings of the 34th AAAI Conference on Artificial Intelligence, 7-12 February, New York, NY, pp. 13001-13008.
Article submitted: May 31, 2021; Peer review completed: July 17, 2021; Revised version received and accepted: August 14, 2021; Published: August 20, 2021.
DOI: 10.15376/biores.16.4.6766-6780