Abstract
Tool wear conditions monitoring is an important mechanical processing system that can improve the processing quality of wood plastic composite furniture and reduce industrial energy consumption. An appropriate signal, feature extraction method, and model establishment method can effectively improve the accuracy of tool wear monitoring. In this work, an effective method based on discrete wavelet transformation (DWT) and genetic algorithm (GA) – back propagation (BP) neural network was proposed to monitor the tool wear conditions. The spindle power signals under different spindle speeds, depths of milling, and tool wear conditions were collected by power sensors connected to the machine tool control box. Based on the feature extraction method, the approximate coefficients of spindle power signal were extracted by DWT. Then, the extracted approximate coefficients, spindle speeds, depths of milling, and tool wear conditions were taken as samples to train the monitoring model. Threshold and weight of BP neural network were optimized by GA, and the accuracy of monitoring model established by the GA – BP neural network can reach 100%. Thus, the proposed monitoring method can accurately monitor tool wear conditions with different milling parameters, which can achieve the purpose of improving the processing quality of wood plastic composite furniture and reducing energy consumption.
Download PDF
Full Article
Discrete Wavelet Transformation and Genetic Algorithm – Back Propagation Neural Network Applied in Monitoring Woodworking Tool Wear Conditions in the Milling Operation Spindle Power Signals
Weihang Dong,a Xiaolei Guo,a,* Yong Hu,b Jinxin Wang,a and Guangjun Tian a
Tool wear conditions monitoring is an important mechanical processing system that can improve the processing quality of wood plastic composite furniture and reduce industrial energy consumption. An appropriate signal, feature extraction method, and model establishment method can effectively improve the accuracy of tool wear monitoring. In this work, an effective method based on discrete wavelet transformation (DWT) and genetic algorithm (GA) – back propagation (BP) neural network was proposed to monitor the tool wear conditions. The spindle power signals under different spindle speeds, depths of milling, and tool wear conditions were collected by power sensors connected to the machine tool control box. Based on the feature extraction method, the approximate coefficients of spindle power signal were extracted by DWT. Then, the extracted approximate coefficients, spindle speeds, depths of milling, and tool wear conditions were taken as samples to train the monitoring model. Threshold and weight of BP neural network were optimized by GA, and the accuracy of monitoring model established by the GA – BP neural network can reach 100%. Thus, the proposed monitoring method can accurately monitor tool wear conditions with different milling parameters, which can achieve the purpose of improving the processing quality of wood plastic composite furniture and reducing energy consumption.
Keywords: Woodworking tool wear conditions monitoring; Milling parameters; Spindle power signals; Discrete wavelet transformation; Genetic Algorithm; Back propagation neural network
Contact information: a: Nanjing Forestry University, College of Materials Science & Engineering, Nanjing, Jiangsu, 210037, Peoples Republic of China; b: Bosun Prewi (Shanghai) Tool System Co., Ltd., Shanghai, 201316, Peoples Republic of China; *Corresponding author: guo.xiao.lei@hotmail.com
INTRODUCTION
In the production process of wood plastic composite furniture, with the increase of the spindle speed and depth of cutting, the wear of tool will accelerate (Guo et al. 2014; Zhu et al. 2017, 2019). The increased cutting time will also cause the woodworking tools to wear. Severe wear of woodworking tools will cause machine tool vibration, and the processing quality of wood furniture will be seriously reduced (da Silva et al. 2013; Bao et al. 2018). At present, the downtime caused by woodworking tool wear is one-fifth of the total downtime. The use of accurate and reliable woodworking tool wear conditions monitoring technology can increase the utilization rate of CNC (computer numerical control) machine tools by 50% and reduce energy consumption by nearly 30% (Rehorn et al. 2005). Thus, online monitoring of the tool wear conditions and timely replacement of worn tools can improve product processing quality and reduce energy consumption.
Tool wear conditions monitoring methods are divided into direct method and indirect method (Shao et al. 2004; Ambhore et al. 2015). The direct method is to obtain the wear conditions of the tool flank surface by observing the cutting region, which has higher accuracy. However, it cannot be used in the online monitoring field. The indirect method is to monitor the tool wear conditions by collecting various signals during the cutting process and extracting the characteristics related to the tool wear conditions, which can monitor the tool wear conditions online during the cutting process (Chi et al. 2018). The signals collected by the indirect method include cutting force, vibration, acoustic emission, power (current and voltage), and multi-signal fusion (Xu et al. 2011; Ai et al. 2012; Shao et al. 2016; Hu et al. 2019; Zhu and Zhang 2019; Zhang and Xiang 2020). The sensors that collect cutting force signals, acoustic emission signals, and vibration signals are expensive and affect the volume of the workpiece and the clamping structure of the machine tool. The power signal is directly related to the cutting force signal, which can reflect the tool wear conditions. Moreover, the power signal sensor is cheaper and not limited by machine tool, which is suitable for monitoring the production of wood plastic composite furniture.
The accuracy of tool wear conditions monitoring depends on the feature extraction and monitoring model establishment method. Many scholars have conducted numerous explorations on tool wear conditions monitoring technology using power signals. In the feature extraction method, Elgargni and Al-Habaibeh (2015) used discrete wavelet transformation (DWT) to extract the features of the collected power signals and found that the approximate coefficient curve of the normal tool gradually shifted to the left compared with the worn tool, which can clearly distinguish the tool wear conditions. As for the model establishment method, Rodrigo da Silva et al. (2016) collected acoustic emission signals and power signals as samples and used a probabilistic neural network to establish a tool wear conditions monitoring model to identify the tool wear conditions. The results showed the combination of cutting power and acoustic emission with the signal energy parameter can definitely be applied in a tool wear conditions monitoring system.
Deep learning, such as neural networks and support vector machines, has an excellent ability to process complex signals and is widely used in the field of fault diagnosis (Schmidhuber 2015; Li and An 2016; Mu and Zeng 2019). Back propagation neural network is widely used in the field of fault monitoring; the method has excellent self-learning, self-adaptation, and generalization capabilities. However, it is easy to fall into a local minimum during the calculation process. Genetic algorithm (GA) has the ability to simulate biological evolution process, which can search for optimal parameters globally. Using GA to optimize the initial weight and threshold of BP neural network can solve the problem of BP neural network falling into local minimum.
This work proposed an effective method for monitoring the tool wear conditions based on DWT and GA – BP Neural Network. The spindle power signals under different spindle speeds, depths of milling, and tool wear conditions were collected, and the DWT was used to extract features of the spindle power signals. Then, the extracted approximate coefficients, spindle speeds, depths of milling, and tool wear conditions were taken as samples to train the woodworking tool wear conditions monitoring model. Meanwhile, GA was used to optimize the initial weights and thresholds of the BP neural network to improve the accuracy of the monitoring model.
RESEARCH BACKGROUND
Discrete Wavelet Transformation
Discrete wavelet transformation is a discretization process on the basis of wavelet transform, which can decompose nonlinear signals at multiple scales and extract approximate coefficients from the signals as effective features to reflect the variation trend of tool wear conditions (Cheng 2008; Zhang and Xiang 2020). The principle of DWT is:
Assume the signal f(n) where n = 0, 1, 2, 3, …, M-1, and j ≥ j0. A discrete signal is approximated by follows,
![]()
where, and are discrete functions defined in [0, M−1], there are a total of M points. Wavelet coefficients can be obtained using inner products, as shown below,
![]()
where in Eq. 2 are called approximation coefficients while in Eq. 3 are called detailed coefficients.
Back Propagation Neural Network
Back propagation neural network is a multi-layer feedforward neural network model in fault diagnosis and monitoring, which was proposed by Rumelhart and McClelland in 1985 (Nasimi and Irani 2015; Sun and Gao 2019). The structure diagram of the 3-layer BP neural network is shown in Fig. 1, where Xn is defined as the input vector of the input layer, Yq is defined as the output vector of the output layer, n, p, and q are the number of neurons in the input layer, hidden layer, and output layer, respectively, W is the weight matrix between the hidden layer and the input layer, and V is the weight matrix between the output layer and the hidden layer. The BP neural network consists of two calculation processes: forward and backward. In forward propagating, the data are transmitted from the input layer to the hidden layer for calculating, and the results are acquired by output layer. The accuracy of the BP neural network is restricted by threshold, weight, learning rate, and the number of hidden layer units. Reasonable parameters can speed up the convergence, reduce the training time, and improve the accuracy of the network (Liang et al. 2018).
Genetic Algorithm
Genetic algorithm was developed based on Darwin’s theory of evolution and Mendelian genetics, which is a practical optimization algorithm for global search (Zhang et al. 2020; Zhou et al. 2020). In the BP neural network, GA can be used to optimize the threshold and weight, which can make BP neural network realize automatic optimization, accelerate the learning rate, and improve the optimization speed of the weight coefficient (Sun and Huang 2020).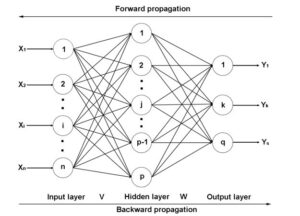
Fig. 1. Structure diagram of 3-layer BP neural network
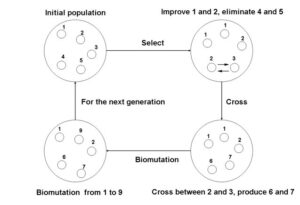
Fig. 2. The execution process of GA
Figure 2 illustrates the execution process of the GA, in which the GA takes all individuals in a population as the object, and the individuals are selected, crossed, mutated, and cyclically searched until the population is optimal. The coding method of chromosome, setting of initial population, evaluation method of individual fitness function value, design of genetic operator, and the basic operating parameters constitute the core five elements of GA.
Experimental Setup
The material consisted of a wood-plastic composite, DP-9, manufactured by Kolo Material Co., Ltd. (Gwacheon, South Korea). The workpiece material size was 200 mm × 100 mm × 8 mm. Table 1 describes the chemical composition and mechanical properties of the material.

A series of cutting experiments were performed on the CNC, model MGK01 and manufactured by Nanxing Machinery Co., Ltd. (Dongguan, China). The rated power of the main motor was 8.1 kW. The milling cutter was a single-toothed shank cutter, which was made of cemented carbide and manufactured by Bosun Prewi Tooling System Co., Ltd. (Shanghai, China). The selected cutter diameter was 12 mm, the rake angle was 2°, and the wedge angle was 45°.
The experimental milling campaign was planned by varying the cutting parameters as follows: one level of feed speed (5 m/min), three levels of spindle speed (6000, 8000, and 10000 r/min), and three levels of depth of milling (0.5, 1.0, and 1.5 mm), as shown in Table 2.

The power signal was acquired by the machine control box with three-phase power analyzer (AN87300) manufactured by Ainuo Co., Ltd. (Jinan, China). A sampling frequency of 50 kHz was used for both experiments. Figure 3 demonstrates the power signal acquisition system. The three-phase power analyzer was connected to the machine control cabinet to collect the spindle power signal when the spindle motor drives the tool to mill the workpiece. At the same time, the collected spindle power signal was transmitted to the data processing computer for storage and further processing.
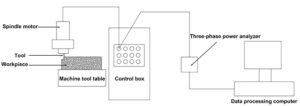
Fig. 3. Power signal acquisition system
Machine Spindle Power Data in Process Analysis
Tool wear conditions usually follow three categories or classes: initial wear (flank wear is 0.1 mm), normal wear (flank wear is 0.2 mm), and rapid wear (flank wear is 0.3 mm), as shown in Fig. 4. Figure 4.2 demonstrates the spindle power signal variations under different milling conditions. With the variations in spindle speed (Fig. 5a), depth of milling (Fig. 5b), and tool wear conditions (Fig. 5c), the spindle power signal increased noticeably. However, the power signal value was complicated, which made it difficult to directly reflect the variations in the tool wear conditions. Further processing of the spindle power signal can solve this problem and make the characteristics of the tool wear conditions more clear.
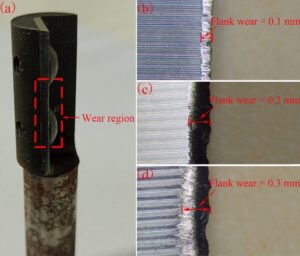
Fig. 4. Woodworking tool wear conditions: a: shows the tool wear region, b: shows the flank wear at 0.1 mm, c: shows the flank wear at 0.2 mm, and d: shows the flank wear at 0.3 mm
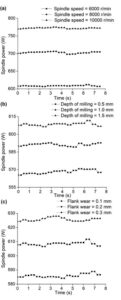
Fig. 5. Comparison of spindle power signals under the spindle speed (a), the depth of milling (b), and the tool wear conditions(c). In Fig. 5a, the depth of milling was 1.5 mm and the flank wear was 0.2. In Fig. 5b, the spindle speed was 6000 r/min and the flank wear was 0.2. In Fig. 5c, the spindle speed was 6000 r/min and the depth of milling was 1.5 mm.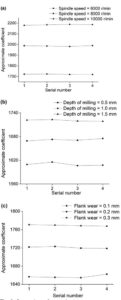
Fig. 6. Comparison of approximate coefficients under the spindle speed (a), the depth of milling (b), and tool wear conditions(c). In Fig. 6a, the depth of milling was 1.5 mm and the flank wear was 0.2. In Fig. 6b, the spindle speed was 6000 r/min and the flank wear was 0.2. In Fig. 6c, the spindle speed was 6000 r/min and the depth of milling was 1.5 mm.
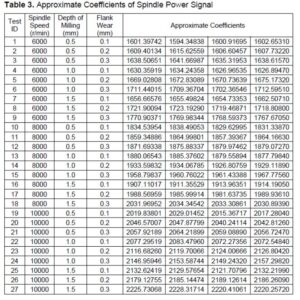
Discrete wavelet transformation was used to extract features in the spindle power signal. The spindle power signal was decomposed by the discrete wavelet transformation with the wavelet basis function of DB5. After four decompositions, four approximate coefficients were obtained. The approximate coefficients can clearly distinguish the tool wear conditions under different milling processing conditions, as shown in Fig. 6. The approximate coefficients of the extracted spindle power signal are shown in Table 3. The spindle speed, depth of milling, and approximate coefficients of spindle power signal were used as input vectors, and the tool wear conditions were used as the output vector.
Establishment of Monitoring Model
The model was established in the neural network toolbox of MATLAB (MathWorks Inc., Natick, MA, USA). The steps for establishing a monitoring model are as follows:
Step 1: Dividing the sample data set. To determine the reliability of the monitoring model, 2, 9, 13, 15, 19, and 25 were randomly selected as the test set, and the remaining 21 sets of data as the training set.
Step 2: Normalizing the data set. To make the BP neural network converge quickly and avoid repeated values, the S-type activation function was used to normalize the training set and the test set. The S-type activation function is shown in Eq. 4,
![]()
where yi is the processed data, xi is the original data, xmax is the maximum value of the original data, and xmin is the minimum value of the original data.
Step 3: Initializing the BP neural network. The sigmoid function was selected as the transfer function.
Step 4: Using GA to optimize the threshold and weight of BP neural network. The population size of GA was selected as 50, the number of evolution was selected as 300, the crossover probability was selected as 0.8, and the mutation probability was selected as 0.2. The fitness function is shown in Eq. 5,

where Yi is the data predicted by the BP neural network, Xi is the actual data, N is the number of sample sets, and ε is a constant to avoid the denominator being zero.
Step 5: Establishing a woodworking tool wear conditions monitoring model. The training of woodworking tool wear conditions monitoring model requires setting the following parameters, including the number of hidden layers, training times, learning rate, training accuracy, and training function. The number of training times was selected as 20, the learning rate was selected as 0.01, the training accuracy was 0.0001, and the number of hidden layers was selected according to Eq. 6,
![]()
where m is the number of hidden layers, n is the number of input vectors, j is the number of output vectors, and α is a constant between 1 and 10.
Step 6: Using the test set to verify the accuracy of the model.
The optimization process of GA to BP neural network is shown in Fig. 7, where the X-axis represents the number of evolutions and the Y-axis represents the fitness. When the number of evolutions reached 100, the GA reached convergence, the threshold and weight of the BP neural network were optimal.
Figure 8 shows the error analysis diagram of the tool wear conditions monitoring model established by the GA – BP neural network, where the X-axis is the test data number and the Y-axis is the tool wear conditions corresponding to each number. The R2 represents the mean squared error of the test results; a high mean squared error means the model has excellent monitoring accuracy. As shown in Fig. 8, the mean squared error R2 was 0.98176, the predicted results of all test numbers were consistent with the actual results, and the monitoring accuracy rate was 100%. Therefore, the wear conditions monitoring model of woodworking tools established by GA – BP neural network can accurately monitor the tool wear conditions.
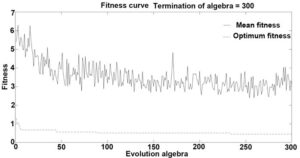
Fig. 7. Optimization process of threshold and weight
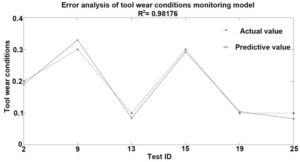
Fig. 8. Error analysis of tool wear conditions monitoring model
Comparative Analysis of Monitoring Accuracy
Probabilistic neural network (PNN) is a feedforward neural network based on Bayesian strategy, which classifies data by establishing a PNN hierarchical model (Yi et al. 2016). The accuracy of the PNN depends on the samples and the smoothing factor. The process of obtaining the smoothing factor is cumbersome, but the GA can be used to optimize the smoothing factor (Parry et al. 2011). Therefore, the monitoring accuracy of the GA – BP neural network and the GA – PNN are compared.
The composition of a PNN includes an input layer, a hidden layer, a summation layer, and an output layer. The Gaussian radial activation function and Euclidean distance weighting function are used to transform the input layer data into hidden layer output data, and then the data is transmitted to the summing layer. The monitoring results are obtained by the output layer decision. The steps of using the GA – PNN to establish the tool wear conditions monitoring model are as follows: the first step is to divide the sample set, the division of the sample set was consistent with the GA – BP neural network. The second step is to normalize the training set data. The third step is to initialize the PNN, the speed of the PNN was selected as 0.1. The fourth step is to use the GA to optimize the smoothing factor of the PNN, the various parameters of the GA were consistent with the GA – BP neural network. The fifth step is to train the network to obtain a monitoring model for the tool wear conditions. The sixth step is to verify the accuracy of the model through the test set data.
Figure 9 demonstrates the analysis of the GA – PNN monitoring error. The prediction results of test numbers 13, 19, and 25 were consistent with the actual values, but the prediction results of test numbers 2, 9, and 15 were different from the actual results, the monitoring accuracy rate was 50%.
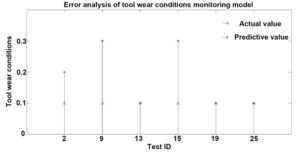
Fig. 9. Error analysis of tool wear conditions monitoring model
Table 4 indicates that the monitoring accuracy of the model established by the GA – BP neural network was 100%, which was higher than the GA – PNN. Under the premise of using the same GA optimization parameters, the accuracy of the PNN was obviously lower than that of the BP neural network, which illustrated that the selection of sample set data also affected the accuracy of the neural network. When the sample set data was poorly selected, GA – BP neural network can accurately monitor the tool wear conditions.

CONCLUSIONS
1. In the milling of wood plastic composite furniture, the spindle power signal changes with the tool wear conditions and the milling parameters. The features extracted by the machine tool spindle power signal can effectively monitor the tool wear conditions.
2. In this work, the discrete wavelet transformation (DWT) was used to process the complex spindle power signal, and the approximate coefficients of the spindle power signal were extracted.
3. The approximate coefficients of the spindle speed, depth of milling, and spindle power signal were used as the input vector, and the tool wear conditions were used as the output vector.
4. The back propagation (BP) neural network optimized by genetic algorithm (GA) was used to establish the tool wear conditions monitoring model.
5. Even if the sample set data is poorly selected, the model can still accurately monitor the tool wear conditions with different milling parameters.
6. Moreover, the power sensor was not affected by the clamping structure of the machine tool, and the monitoring cost was relatively cheap. Thus, the proposed method for monitoring the tool wear conditions is suitable for large-scale applications in the production of wood furniture.
ACKNOWLEDGMENTS
This work is funded by the National Natural Science Foundation of China (31971594) and Postgraduate Research & Practice Innovation Program of Jiangsu Province (SJCX20_0273).
REFERENCES CITED
Ai, C. S., Sun, Y. J., He, G. W., Ze, X. B., Li, W., and Mao, K. (2012). “The milling tool wear monitoring using the acoustic spectrum,” International Journal of Advanced Manufacturing Technology 61(5-8), 457-463. DOI: 10.1007/s00170-011-3738-z
Ambhore, N., Kamble, D., Chinchanikar, S., and Wayal, V. (2015). “Tool condition monitoring system: A review,” Materials Today-Proceedings 2(4-5), 3419-3428. DOI: 10.1016/j.matpr.2015.07.317
Bao, X., Guo, X., Cao, P., Zhu, Z., and Deng, M. (2018). “Forces and heat variation laws of pine materials processing and microcosmic characteristics of surface damage,” BioResources 13(4), 7534-7544. DOI: 10.15376/biores.13.4.7534-7544
Cheng, C. S. (2008). “Fingerprint recognition using discrete wavelet transformation and grey relational analysis,” Journal of Grey System 20(2), 93-108.
Chi, Y., Dai, W., Lu, Z., Wang, M., and Zhao, Y. (2018). “Real-time estimation for cutting tool wear based on modal analysis of monitored signals,” Applied Sciences-Basel 8(5), Article number 708. DOI: 10.3390/app8050708
da Silva, R. B., Machado, A. R., Ezugwu, E. O., Bonney, J., and Sales, W. F. (2013). “Tool life and wear mechanisms in high speed machining of Ti-6Al-4V alloy with PCD tools under various coolant pressures,” Journal of Materials Processing Technology 213(8), 1459-1464. DOI: 10.1016/j.jmatprotec.2013.03.008
da Silva, R. H. L., da Silva, M. B., and Hassui, A. (2016). “A probabilistic neural network applied in monitoring tool wear in the end milling operation via acoustic emission and cutting power signals,” Machining Science and Technology 20(3), 386-405. DOI: 10.1080/10910344.2016.1191026
Elgargni, M. A., and Al-Habaibeh, A. (2015). “Analytical and comparative study of using a CNC machine spindle motor power and infrared technology for the design of a cutting tool condition monitoring system,” in: Proceedings 2015 IEEE International Conference on Industrial Informatics (Indin), Cambridge, United Kingdom, pp. 782-787.
Guo, X., Ekevad, M., Gronlund, A., Marklund, B., and Cao, P. (2014). “Tool wear and machined surface roughness during wood flour/polyethylene composite peripheral up-milling using cemented tungsten carbide tools,” BioResources 9(3), 3779-3791. DOI: 10.15376/biores.9.3.3779-3791
Hu, M., Ming, W. W., An, Q. L., and Chen, M. (2019). “Tool wear monitoring in milling of titanium alloy Ti-6Al-4 V under MQL conditions based on a new tool wear categorization method,” International Journal of Advanced Manufacturing Technology 104(2), 4117-4128. DOI: 10.1007/s00170-019-04125-y
Li, L., and An, Q. (2016). “An in-depth study of tool wear monitoring technique based on image segmentation and texture analysis,” Measurement 79, 44-52. DOI: 10.1016/j.measurement.2015.10.029
Liang, Q., Han, H., Cui, X., Qing, H., and Fan, Y. (2018). “Comparative study of probabilistic neural network and back propagation network for fault diagnosis of refrigeration systems,” Science and Technology for the Built Environment 24(4), 448-457. DOI: 10.1080/23744731.2017.1375012
Mu, R., and Zeng, X. (2019). “A review of deep learning research,” Ksii Transactions on Internet and Information Systems 13(4), 1738-1764. DOI: 10.3837/tiis.2019.04.001
Nasimi, R., and Irani, R. (2015). “Combining a neural network with a genetic algorithm and particle swarm optimization for permeability estimation of the reservoir,” Energy Sources Part A-Recovery Utilization and Environmental Effects 37(4), 384-391. DOI: 10.1080/15567036.2011.576407
Parry, M. E., Cao, Q., and Song, M. (2011). “Forecasting new product adoption with probabilistic neural networks,” Journal of Product Innovation Management 28(1), 78-88. DOI: 10.1111/j.1540-5885.2011.00862.x
Rehorn, A. G., Jiang, J., and Orban, P. E. (2005). “State-of-the-art methods and results in tool condition monitoring: A review,” International Journal of Advanced Manufacturing Technology 26(7-8), 693-710. DOI: 10.1007/s00170-004-2038-2
Shao, C. H., Kim, T. H., Hu, S. J., Jin, J. H., Abell, J. A., and Spicer, J. P. (2016). “Tool wear monitoring for ultrasonic metal welding of lithium-ion batteries,” Journal of Manufacturing Science and Engineering-Transactions of the ASME 138(5), Article ID 051005. DOI: 10.1115/1.4031677
Shao, H., Wang, H. L., and Zhao, X. M. (2004). “A cutting power model for tool wear monitoring in milling,” International Journal of Machine Tools & Manufacture 44(14), 1503-1509. DOI: 10.1016/j.ijmachtools.2004.05.003
Schmidhuber, J. (2015). “Deep learning in neural networks: An overview,” Neural Networks 61, 85-117. DOI: 10.1016/j.neunet.2014.09.003
Sun, W., and Gao, Q. (2019). “Exploration of energy saving potential in China power industry based on Adaboost back propagation neural network,” Journal of Cleaner Production 217, 257-266. DOI: 10.1016/j.jclepro.2019.01.205
Sun, W., and Huang, C. (2020). “A carbon price prediction model based on secondary decomposition algorithm and optimized back propagation neural network,” Journal of Cleaner Production 243, Article ID 118671. DOI: 10.1016/j.jclepro.2019.118671
Xu, C., Xu, T., Zhu, Q., and Zhang, H. (2011). “Study of adaptive model parameter estimation for milling tool wear,” Journal of Mechanical Engineering 57(7-8), 568-578. DOI: 10.5545/sv-jme.2009.138
Yi, J. H., Wang, J., and Wang, G. G. (2016). “Improved probabilistic neural networks with self-adaptive strategies for transformer fault diagnosis problem,” Advances in Mechanical Engineering 8(1), 1-13 DOI: 10.1177/1687814015624832
Zhang, B., Xu, L., and Zhang, J. (2020). “A multi-objective cellular genetic algorithm for energy-oriented balancing and sequencing problem of mixed-model assembly line,” Journal of Cleaner Production 244, Article ID 118845. DOI: 10.1016/j.jclepro.2019.118845
Zhang, W., and Xiang, S. (2020). “Face anti-spoofing detection based on DWT-LBP-DCT features,” Signal Processing-Image Communication 89, Article ID 115990. DOI: 10.1016/j.image.2020.115990
Zhou, X. P., Huang, X., and Zhao, X. F. (2020). “Optimization of the critical slip surface of three-dimensional slope by using an improved genetic algorithm,” International Journal of Geomechanics 20(8), Article ID 04020120. DOI: 10.1061/(ASCE)GM.1943-5622.0001747
Zhu, K., and Zhang, Y. (2019). “A generic tool wear model and its application to force modeling and wear monitoring in high speed milling,” Mechanical Systems and Signal Processing 115, 147-161. DOI: 10.1016/j.ymssp.2018.05.045
Zhu, Z., Buck, D., Ekevad, M., Marklund, B., Guo, X., Cao, P., and Zhu, N. (2019). “Cutting forces and chip formation revisited based on orthogonal cutting of Scots pine,” Holzforschung 73(2), 131-138. DOI: 10.1515/hf-2018-0037
Zhu, Z., Guo, X., Ekevad, M., Cao, P., Na, B., and Zhu, N. (2017). “The effects of cutting parameters and tool geometry on cutting forces and tool wear in milling high-density fiberboard with ceramic cutting tools,” International Journal of Advanced Manufacturing Technology 91(9-12), 4033-4041. DOI: 10.1007/s00170-017-0085-8
Article submitted: November 24, 2020; Peer review completed: January 31, 2021; Revised version receive and accepted: February 4, 2021; Published: February 5, 2021.
DOI: 10.15376/biores.16.2.2369-2384
