
Abstract
The effects of different activation temperatures (Ta), ranging from 300 to 750 °C, on the ash content, yield, ignition point, microcrystalline structure, surface functional group, pore structure, and adsorption performance of activated carbon in preparing activated carbon by phosphoric acid (H3PO4) were systematically studied. The yield and volatile content of activated carbon decreased with the increase of Ta, while the ash content, ignition point, and graphitization degree showed the opposite results. The turning point of ash content increasing rate of activated carbon occurred at 500 °C. The thermal decomposition temperature of phosphonate compounds was approximately 450 °C. With increased Ta, micropores were generated first, followed by mesopores. The ignition point of activated carbon was related to the volatile content and the degree of graphitization. Activated carbon with low ash content, high yield, well-developed pore structure and good adsorption performance was prepared at 350 to 425 °C. With increased Ta, the volatile content decreased, and the ignition point of activated carbon increased. At Ta higher than 500 °C, the aromatic and condensed ring structure, graphitization degree, and mesopore ratio of the activated carbon increased, yielding decreased adsorption performance.
Download PDF
Full Article
Effect of Activation Temperature on Properties of H3PO4-Activated Carbon
Wei Xu, Junli Liu,* Kang Sun, Yanyan Liu, Chao Chen, Ao Wang, and Hao Sun
The effects of different activation temperatures (Ta), ranging from 300 to 750 °C, on the ash content, yield, ignition point, microcrystalline structure, surface functional group, pore structure, and adsorption performance of activated carbon in preparing activated carbon by phosphoric acid (H3PO4) were systematically studied. The yield and volatile content of activated carbon decreased with the increase of Ta, while the ash content, ignition point, and graphitization degree showed the opposite results. The turning point of ash content increasing rate of activated carbon occurred at 500 °C. The thermal decomposition temperature of phosphonate compounds was approximately 450 °C. With increased Ta, micropores were generated first, followed by mesopores. The ignition point of activated carbon was related to the volatile content and the degree of graphitization. Activated carbon with low ash content, high yield, well-developed pore structure and good adsorption performance was prepared at 350 to 425 °C. With increased Ta, the volatile content decreased, and the ignition point of activated carbon increased. At Ta higher than 500 °C, the aromatic and condensed ring structure, graphitization degree, and mesopore ratio of the activated carbon increased, yielding decreased adsorption performance.
Keywords: Activated carbon; Activation temperature; H3PO4-activation; Adsorption performance
Contact information: Institute of Chemical Industry of Forest Products, CAF; National Engineering Lab. for Biomass Chemical Utilization; Key Lab. of Chemical Engineering of Forest Products, National Forestry and Grassland Administration; Key Lab. of Biomass Energy and Material, Jiangsu Province; Jiangsu Co-Innovation Center of Efficient Processing and Utilization of Forest Resources, Longpan Road, Nanjing, 210042, China; *Corresponding author: liujunli1974@126.com
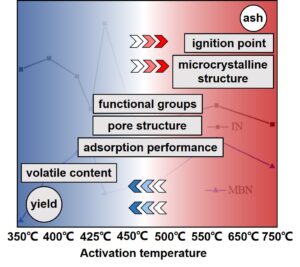
GRAPHICAL ABSTRACT
INTRODUCTION
Producing activated carbon from biomass waste is a good way to reduce environmental pollution and the use of limited resources (Hesas et al. 2014; Jain et al. 2016). Phosphoric acid (H3PO4) is used industrially for preparing activated carbon from lignocellulosic materials (Heidarinejad et al. 2020). H3PO4 is effective for producing mesopores at lower temperatures. In addition, H3PO4 provides an easier way to recover the carbon product during processing stage by rinsing with water (Yahya et al. 2015). Compared with other activating compounds such as KOH (Mao et al. 2015), ZnCl2 (Duan et al. 2019), and K2CO3 (Mao et al. 2020), it also gives higher yield of activated carbon and has non-toxic properties (Romero-Anaya et al. 2012). The H3PO4 method has been used for almost 40 years. At present, approximately 0.2 million tons of activated carbon is produced by H3PO4 in China (Environmental Monitoring Center Station of Ningxia 2018). With a huge market demand, the activated carbon is an indispensable and important chemical product for the national economy and ecological environment construction.
Activation temperature (Ta) is an important factor in the preparation of H3PO4-activated carbon because H3PO4 works above 300 ℃ (Jagtoyen and Derbyshire 1998; Zuo et al. 2010). The Ta affects the thermal decomposition of cellulose, hemicellulose, and lignin (Yang et al. 2007; Chen et al. 2018). Moreover, Ta affects the formation and thermal transformation of phosphonate compounds to connect and crosslink biopolymer fragments (Zuo et al. 2018). Finally, Ta is a direct factor for H3PO4 to dehydrate and polymerize itself (Kang et al. 2018). The influence of Ta on the surface area, pore development, and yield of activated carbon have been investigated. Increasing temperature is beneficial for the formation of pores in the carbon, especially when the temperature increases from 400 to 500 ℃ (Luo et al. 2019). This is ascribed to the use of activating agent releasing the tar from the cross-linked framework (Foo and Lee 2010). However, with further increases in temperature, violent gasification reactions destroy part of the micropore structure, leading to decreased surface area and pore volume (Chen et al. 2013). Moreover, increased temperature elevates the ash and fixed carbon percentage, decreasing the volatile matter and the solid yield (Ioannidou and Zabaniotou 2007). A final Ta of 400 °C is suitable for producing high-surface-area activated carbon (Yorgun and Yildiz 2015; Kang et al. 2018). This temperature is favorable for increasing yield and reducing ash content. Thus, the Ta is usually in the range of 400 to 500 °C (Demiral and Şamdan 2016; Villota et al. 2017; Villota et al. 2019), and the activated carbon prepared at these temperatures can have well-developed porous structure and large adsorption capacity, which is beneficial for decolorization, water purification, catalytic carriers, and other industrial needs (Malaika et al. 2018; Wu et al. 2019).
With the increasing need for special activated carbon, especially for activated carbon with low ash content, high ignition point, and controlled pore size, the existing activated carbon products no longer meet the market demand. While there have been studies on the formation of ash, the change of ignition point, and the relationship between pore development and adsorption properties of activated carbon, research on the heat treatment process is limited. Therefore, it is necessary to systematically study the influence of Ta on the properties of H3PO4-activated carbon. This study examined the influence of Ta on the ash content, yield, pore structure, adsorption performance, ignition point, microcrystalline structure, surface functional groups, and changes in microstructure. The results of this research can be used for reference in the preparation of special activated carbon with controllable pore structure, good adsorption, low ash content, or high ignition point.
EXPERIMENTAL
Materials
Analytical grade H3PO4 (85% by mass), iodine, methylene blue, and sodium thiosulfate were purchased from Aladdin Co. Ltd. (Shanghai, China). Fir sawdust (FS, 10- to 35-mesh, lignin content of 31.46%) was provided by Yuanli Active Carbon Co. Ltd. (Fujian, China). The ultimate analysis and proximate analysis of FS are listed in Table 1.

Preparation of activated carbon
FS (50 g) was soaked with H3PO4 solution (55 wt%) according to the immersion ratio of 1.5:1. After stirring for 30 min, the mixture was pretreated in an oven at 140 ℃ for 120 min, then moved to a muffle furnace under N2 flow and activated at 300 °C to 750 °C for 120 min. After activation, they were taken out, washed in deionized water (500 mL) for 3 times (each time for 3 min), and dried to obtain the activated carbon.
Test Standards
The ash content, iodine number, methylene blue number, ignition point, and volatile matter of activated carbon were determined as per GB/T 12496.3(1999), GB/T 12496.8 (2015), GB/T 12496.10 (1999), GB/T 12496.6 (1999), GB/T 20449 (2006), and GB/T 17664 (1999), respectively.
Methods
The BET specific surface area was measured using a Micromeritics ASAP 2460 apparatus (Norcross, GA, USA) at 77 K. The pore size distribution was computed based on the density functional theory (DFT) method. Thermogravimetric analysis (TG) was carried out by a Netzsch STA449C apparatus (Selb, Germany). A 10 mg sample was heated to 800 ℃ under the protection of the nitrogen with a heating rate of 10 ℃/min. The X-ray diffraction (XRD) was performed on a Bruker D8 Advance X-ray diffractometer (Karlsruhe, Germany) with Cu Kα radiation (λ=0.154 nm), Scanning range was 10 to 80° with 0.1°/s. The Fourier transform infrared (FTIR) was tested on a Magna-IR spectrometer 550 (Madison, WI, USA) in the range of 4000 to 400 cm-1 with a resolution of 4 cm-1.
RESULTS AND DISCUSSION
Effect of Ta on Ash Content and Yield of Activated Carbon
Low ash content in activated carbon is necessary when used for injection, wine, catalyst support, etc. In order to explore the preparation method of low ash content activated carbon, the effect of Ta on the ash content of activated carbon was studied, as shown in Fig. 1(a). The ash content of activated carbon increases with the elevation of Ta. At the Ta lower than 350 ℃, activated carbon with ash content less than 2% was prepared. When the Ta ranged from 350 to 500 ℃, the ash content increased slightly. When the temperature was raised from 500 to 550 ℃, the ash content greatly increased from 3.54% to 6.00%. This means that the turning point of ash content increasing rate of activated carbon occurred at 500 °C. Further elevation of the Ta caused only slight changes in the ash content of activated carbon. The results indicated that the Ta should be lower than 500 ℃ for preparation of low ash content activated carbon.
The influence of Ta on ash content is closely related to the polymerization of H3PO4 at different temperatures. With the increase of Ta, H3PO4 dehydrates continuously to form viscous liquid or solid such as pyrophosphoric acid, metaphosphoric acid, polyphosphoric acid, and phosphorus pentoxide (Greenwood and Earnshaw 2012; Kang et al. 2018), which block the pores of activated carbon. Most of these polyphosphates are recycled during activated carbon rinsing. The unremoved polyphosphate remains in the pores of activated carbon, creating an important source of ash. The rapid increase of ash content of activated carbon at 500 to 550 ℃ means that there was more polyphosphoric acid generated in this temperature range, and it is difficult to elute. In addition, water-insoluble phosphate was formed via the reaction of H3PO4 and metal salts in raw materials under high temperature. The phosphonate compounds were produced by condensation of H3PO4 and hydroxyl groups of high glycan (include their degradation products) are also important sources of ash.


Fig. 1. (a) Ash content and (b) yield of activated carbon with different Ta
As shown in Fig. 1(b), the yield of activated carbon was affected by Ta. During the preparation of activated carbon, the yield of activated carbon continuously decreased with the increase of Ta. When Ta was 300 ℃, the yield was 67.4%, and the yield decreased to 48.6% at 450 ℃. The turning point of the curve occurred at 450 ℃, showing that the pyrolysis rate was faster and the degree of pyrolysis was higher before 450 ℃. The effect of Ta on the yield is related to the degree of pyrolysis of raw materials at different temperatures. With increasing temperature, the cellulose, hemicellulose, and lignin making up the sawdust are pyrolyzed gradually, resulting in a continually decreased yield. To compare the influence of H3PO4 on the pyrolysis process of sawdust, TG (Fig. 2) was carried out for FS and fir sawdust impregnated H3PO4 (FS-H3PO4). The thermal decomposition of FS was concentrated in 250 to 400 ℃, and the mass loss in this range was increased from 4.28% to 71.4%. After the FS was soaked with H3PO4, the thermal decomposition range was changed into two stages, 130 to 450 ℃ (mass reduced from 91.4% to 66.9%) and 450 to 700 ℃ (mass reduced from 66.9% to 28.2%). Comparing the TG curves for the two specimens, the addition of H3PO4 improved the yield and changes the thermal decomposition process of FS (Yagmur et al. 2018). In the pyrolysis process, the catalytic dehydration of H3PO4 makes the weight loss of FS-H3PO4 more obvious before 334 ℃. Above 334 ℃, H3PO4 forms stable phosphonate compounds with FS, protects the pyrolysis of FS, and enhances the yield (Yakout and Eldeen 2016), whereas the pyrolysis of FS unimpregnated H3PO4 is more obvious. The weight drop of FS-H3PO4 after 450 ℃ can be explained by the destruction of phosphonate compounds (Solum et al. 1995; Jagtoyen and Derbyshire 1998) and the volatilisation of phosphorus compounds (Suarezgarcia et al. 2004; Puziy et al. 2005). It is more appropriate to assume that P2O5 (formed by dehydration of H3PO4) behaves as an oxidant, which can react with carbon, reducing the yield and forming new pores (Olivaresmarin et al. 2006). The mechanism of this process is shown in Fig. 3, and the result is consistent with the turning point of yield in Fig. 1(b) at 450 ℃. The volatilisation of phosphorus compounds does not lead to the decrease of ash content of activated carbon, and it can be inferred that the phosphorus compounds are not the only source of ash in activated carbon.

Fig. 2. TG curves of FS and FS-H3PO4

Fig. 3. Mechanism of phosphonate compounds decomposition (Ta > 450 C)
Effect of Ta on Ignition Point and Volatile of Activated Carbon
The ignition point is an important index to evaluate the thermal stability of activated carbon in gas phase application. As shown in Fig. 4, the ignition point of activated carbon increased with elevated Ta. Before 450 ℃, the ignition point of activated carbon was lower than 300 ℃. When the Ta increased to 500 ℃, the ignition point of the activated carbon exceeded 300 ℃, and flame-retardant activated carbon with an ignition point greater than 400 ℃ was prepared at a Ta of 750 ℃. The effect of Ta on the ignition point may be related to the reduction of volatile content of activated carbon. This is because CO, H2, CH4, and other gaseous organics from pyrolysis are conducive to the combustion of activated carbon. The relationship between the content of volatile matter and the ignition point of activated carbon was studied (Fig. 4). The volatile content of activated carbon decreased with the increased Ta, which is contrary to the change trend of ignition point with Ta. It was concluded that the ignition point is correlated negatively to the volatile content of activated carbon. When the Ta increased from 300 °C to 425 °C, the volatile content decreased from 27.3% to 23.4%, and the volatile content decreased to 21.9% with the Ta at 750 °C. Compared with the volatile content (81.2%) of FS, the pyrolysis of FS was sufficient at 300 to 425 °C (Ferrera-Lorenzo et al. 2014; Li et al. 2015), which may be a basis for the formation of developed pore structure of activated carbon at low Ta.

Fig. 4. Ignition point and volatile of activated carbon with different Ta
Effect of Ta on Microcrystalline Structure and Surface Functional Groups of Activated Carbon
XRD was employed to analyze the effect of different Ta on the microcrystalline structure of the activated carbon. As shown in Fig. 5a, three diffraction peaks at 16°, 22°, and 34° for FS represent the (101), (002), and (004) crystal planes of cellulose (Ma et al. 2017). Two obvious peaks are observable at 24° and 42° for activated carbon corresponding to the (002) and (100) planes of amorphous carbon (Chen et al. 2017). These changes indicate that the crystalline area of cellulose was destroyed after activation, representing the formation of amorphous carbon. The amorphous carbon produced above 300 ℃ is the basis for the formation of pores. The pores are produced by removing various carbon-containing compounds and disordered carbon between the basic crystallites of amorphous carbon during the preparation of activated carbon (Wigmans 1986). With the increase of Ta, the diffraction peak of amorphous carbon gradually increases and shifts to the high angles, the stacking thickness of carbon layer along (100) direction increases, and the degree of graphitization increases (Wada et al. 2010). The exception occurs at 650 °C and 750 °C, when the (002) shifts to low angles, which may be related to the channel collapse at high temperature. The elevated degree of graphitization makes the internal structure of activated carbon orderly and regular. The reduction of the spacing of microcrystalline layers may make the internal phosphoric acid unable to elute. The formation of stable graphite-like microcrystalline structures may also reduce their tendency to spontaneous combustion.


Fig. 5. (a) XRD and (b) FTIR curves of activated carbon with different Ta
The changes in functional groups on the surface of activated carbon prepared at different Ta were studied by FTIR, as shown in Fig. 5b. In all spectra, the band located at 3430 cm-1 can be assigned to the O-H stretching mode. The band of activated carbon prepared at 300 ℃ is obviously asymmetric, indicating the existence of hydrogen bond (Ma et al. 2017). A small peak at 2920 to 2850 cm-1 can be assigned to the C-H stretching mode, and its bending mode appears at 1440 cm-1 (Mao et al. 2018). The band of C=O appears at 1700 cm-1. With increased Ta, the intensity of C=O decreased and disappeared above 500 ℃, and the band position shifted to a low wave number, indicating decarbonylation. This effect was apparent when the intensity of C-O (1060 cm-1) increased with the elevated Ta. A strong band at 1580 cm-1 was ascribed to the stretching vibration of aromatic ring (C=C), demonstrating that the carbonyl (1700 cm-1) is conjugated with aromatic ring. A small red shift with the increase of Ta indicated the growth of aromatic ring structure (Puziy et al. 2002), which is unfavorable to the adsorption performance of activated carbon but is the basis for the enhancement of the structural order and graphitization degree of activated carbon (Leung and Safford 1970). The increase of aromatic ring structure is caused by the catalytic dehydration of phosphoric acid, and the process is shown in Fig. 6 (Benaddi et al. 1998). The band at 1160 cm-1 is assigned to phosphates with stretching mode of P=O, P-O-C, and P=OOH. The bands at 1060 cm-1 are due to C-O stretching in alcohols, phenols, ethers, and esters, or P+-O– (Puziy et al. 2005; Ma et al. 2018). The broad band between 750 cm-1 and 900 cm-1 corresponding to the out-of-plane bending mode of aromatic ring C-H weakened and disappeared when Tawas higher than 500 ℃. The change indicates that the functional group of activated carbon has replaced or formed a dense ring structure.

Fig. 6. Dehydration reaction of sugar molecules catalyzed by phosphoric acid
Effect of Ta on Pore Structure and Adsorption Properties of Activated Carbon
The N2 adsorption-desorption isotherms of the activated carbon are presented in Fig. 7(a). The isotherms of activated carbon prepared at 300 ℃ belong to type I (Sing 1982; Rouquerol et al. 1994). The micropores of activated carbon were confirmed by the abundant pores and in the range of 1 to 2 nm, as can be seen in Fig. 7(b) as low Vmes/Vtot ratio and small Dave value (Table 2). When the Ta is higher than 300 ℃, the isotherms of activated carbon belong to type IV (Sing 1982; Rouquerol et al. 1994). The hysteresis loop appearing at high relative pressures (P/P0>0.4) indicates that the mesopores of activated carbon are developed and corresponds with the large number of mesopores distributed at 2.7, 3.4, and 8.7 nm, as shown in Fig. 7(b). At the same relative pressure, the adsorption capacity of N2 was consistent with the SBET and Vtot of activated carbon, which is shown in Table 2. The pore structure of activated carbon prepared at different Ta was distributed in the range of 0 to 50 nm. At the same diameter, the different proportion of pores reflect the amount of Vtot of activated carbon prepared at different Ta.


Fig. 7. (a) N2 adsorption-desorption isotherms and (b) DFT pore size distributions of activated carbon with different Ta
The pore parameters of activated carbon based on N2 adsorption-desorption isotherms are given in Table 2. With increasing Ta, the SBET and Vtot of activated carbon increased first and then decreased. When the Ta is 300 ℃, the pore structure of the prepared activated carbon is underdeveloped with the SBET of 799 m2/g and Vtot of 0.34 cm3/g. When the Ta increased from 300 to 350 ℃, the SBET, Vtot, and Vmes/Vtot of the activated carbon increased, suggesting that the effect of H3PO4 is enhanced at this temperature. Increasing the Ta to 450 ℃, the SBET and Vtot were further developed and tended to be stable. At an Ta of 400 ℃, the SBET and Vtot of activated carbon reached maximum values, which were 1547 m2/g and 0.89 cm3/g, respectively. At the Ta between 450 to 550 ℃, the SBET and Vtot of activated carbon showed a downward trend, relating to the destruction of the phosphate bond, the ablation of the cell wall, and the collapse of the pore structure during high temperature (Romeroanaya et al. 2012). A slight increase of SBET and Vtot at 650 ℃ is related to the rearrangement of microcrystalline structure during skeleton contraction. The increase of SBET from 350 to 400 ℃ was not significant, but the Vtot and Vmes/Vtot were increased, indicating that this stage is conducive to the formation of mesopores. The Vmes/Vtot ratio of activated carbon increased with the elevation of Ta and reached the maximum at 450 ℃, which can be ascribed to the formation of mesopores at the high Ta (Jagtoyen and Derbyshire 1998). The change of Vmes/Vtot was supported by the change trend of the Dave.

Iodine number (IN) and methylene blue number (MBN) are important references for evaluating the adsorption performance of activated carbon. The influence of Ta on IN and MBN of activated carbon were studied (Fig. 8). With increased Ta, the curve of the IN showed a trend of first increasing and then decreasing. When the Ta was 450 ℃, the IN reached the highest value of 834 mg/g. Further increasing the Ta to 500 ℃, the IN decreases significantly. The IN of activated carbon does not change much at 500 to 750 ℃. The influence of MBN on activated carbon is relatively weak by the Ta. Both low Ta (425 ℃) and high Ta (650 ℃) can prepare activated carbons with MBN exceeding 285 mg/g. The MBN on activated carbon prepared at 450 to 550 ℃ was less than 250 mg/g. The IN and MBN of activated carbon are used to measure the development of micropores and mesopores, respectively (Nunes and Guerreiro 2011; Hirunpraditkoonet al. 2015). When the Ta was lower than 400 ℃, the IN of activated carbon was high enough. The MBN increased with the elevation of Ta from 300 to 425 ℃, indicating that mesopores were generated. This result was consistent with the conclusion that pore structure was affected by Ta. At Ta higher than 500 ℃, the IN and MBN of activated carbon were not regular with the collapse of old pores and the formation of new pores. Thus, activated carbon with higher IN and MBN should be prepared at a Ta between 350 and 425 ℃.

Fig. 8. IN and MBN curves of activated carbon with Ta
CONCLUSIONS
- The activated carbon with low ash content should be prepared at an activation temperature (Ta) lower than 500 ℃. This is because the turning point of ash content increasing rate of activated carbon occurs at 500 ℃. The thermal decomposition temperature of phosphonate compounds about 450 ℃, can be demonstrated by the weight reduction of FS-H3PO4. The yield curve of activated carbon turned at a Ta value higher than 450 ℃.
- The volatile content is negatively relating to the ignition point of activated carbon. At a Ta of 750 ℃, activated carbon with ignition point higher than 400 ℃ can be prepared. The increase of Ta promotes the aromatic ring structure of activated carbon. This relationship provides a basis for the improvement of structure order and graphitization degree of activated carbon. However, it is unfavorable for the adsorption performance of activated carbon, especially at high Ta.
- With the increase of Ta, micropores are generated first, followed by mesopores. The Vmes/Vtot ratio of activated carbon increases with the elevation of Ta and reaches a maximum at 450 ℃. The iodine number (IN) and methylene blue number (MBN) of activated carbon are related to micropore volume and mesopore volume, respectively. For preparation of activated carbon with high IN and MBN, the Ta should be between 350 and 425 ℃.
ACKNOWLEDGMENTS
This work was financially supported by the Biomass Energy & Materials Laboratory of Jiangsu Province (JSBEM-S-202010), and the National Key R&D Program of China (Project No. 2019YFB1503804). The authors are grateful for the analytic support of the Instrument Analysis Center and Pulp and Paper Research Lab at the Institute of Chemical Industry of Forest Products, CAF, Nanjing, China.
REFERENCES CITED
Benaddi, H., Legras, D., Rouzaud, J. N., and Beguin, F. (1998). “Influence of the atmosphere in the chemical activation of wood by phosphoric acid,” Carbon 36(3), 306-309. DOI: 10.1016/S0008-6223(98)80123-1
Chen, Y., Zhai, S. R., Liu, N., Song, Y., An, Q. D., and Song, X. W. (2013). “Dye removal of activated carbons prepared from NaOH-pretreated rice husks by low-temperature solution-processed carbonization and H3PO4 activation,” Bioresource Technology 144, 401-409. DOI: 10.1016/j.biortech.2013.07.002
Chen, H., Guo, Y. C., Wang, F., Wang, G., and Yu, F. (2017). “An activated carbon derived from tobacco waste for use as a supercapacitor electrode material,” New Carbon Materials 32(6), 592-599. DOI: 10.1016/S1872-5805(17)60140-9
Chen, D., Gao, A., Cen, K., Zhang, J., Cao, X., and Ma, Z. (2018). “Investigation of biomass torrefaction based on three major components: Hemicellulose, cellulose, and lignin,” Energy Conversion and Management 169, 228-237. DOI:10.1016/j.enconman.2018.05.063
Demiral, I., and Şamdan, C. A. (2016). “Preparation and characterisation of activated carbon from pumpkin seed shell using H3PO4,” Anadolu University Journal of Science and Technology. A: Applied Sciences and Engineering 17(1), 125-138.DOI: 10.18038/btda.64281
Duan, X. L., Yuan, C. G., Jing, T. T., and Yuan, X. D. (2019). “Removal of elemental mercury using large surface area micro-porous corn cob activated carbon by zinc chloride activation,” Fuel 239, 830-840. DOI: 10.1016/j.fuel.2018.11.017
Environmental Monitoring Center Station of Ningxia (2018). “Letter on seeking opinions on four national environmental protection standards including ‘emission standards of pollutants for activated carbon industry (Draft)’,” The Ministry of Environmental Protection of the People’s Republic of China, (http://www.mee.gov.cn/gkml/hbb/bgth/201803/t20180315_432536.htm).
Ferrera-Lorenzo, N., Fuente, E., Suárez-Ruiz, I., Gil, R. R., and Ruiz, B. (2014). “Pyrolysis characteristics of a macroalgae solid waste generated by the industrial production of agar-agar,” Journal of Analytical and Applied Pyrolysis 105, 209-216. DOI: 10.1016/j.jaap.2013.11.006
Foo, P. Y. L., and Lee, L. Y. (2010). “Preparation of activated carbon from Parkia speciosa pod by chemical activation,” in: Proceedings of the World Congress on Engineering and Computer Science, San Francisco, USA, pp. 696-698.
Fu, Y. H., Shen, Y. F., Zhang, Z. D., Ge, X. L., and Chen, M. D. (2019). “Activated bio-chars derived from rice husk via one- and two-step KOH-catalyzed pyrolysis for phenol adsorption,” Science of the Total Environment 646, 1567-1577. DOI: 10.1016/j.scitotenv.2018.07.423
Greenwood, N. N., and Earnshaw, A. (1997). Chemistry of the Elements, Butterworth-Heinemann, Oxford, UK.
Heidarinejad, Z., Dehghani, M. H., Heidari, M., Javedan, G., Ali, I., and Sillanpää, M. (2020). “Methods for preparation and activation of activated carbon: A review,” Environmental Chemistry Letters 18, 393-415. DOI: 10.1007/s10311-019-00955-0
Hesas, R. H., Arami-Niya, A., Wan Daud, W. M. A., and Sahu, J. N. (2013). “Preparation and characterization of activated carbon from apple waste by microwave-assisted phosphoric acid activation: Application in methylene blue adsorption,” BioResources 8(2), 2950-2966. DOI: 10.15376/biores.8.2.2950-2966
Hirunpraditkoon, S., Srinophakun, P., Sombun, N., and Moore, E. J. (2015). “Synthesis of activated carbon from jatropha seed coat and application to adsorption of iodine and methylene blue,” Chemical Engineering Communications 202(1), 32-47. DOI: 10.1080/00986445.2013.828611
Ioannidou, O., and Zabaniotou, A. (2007). “Agricultural residues as precursors for activated carbon production – A review,” Renewable and Sustainable Energy Reviews 11(9), 1966-2005. DOI: 10.1016/j.rser.2006.03.013
Jagtoyen, M., and Derbyshire, F. (1998). “Activated carbons from yellow poplar and white oak by H3PO4 activation,” Carbon 36(7-8), 1085-1097. DOI: 10.1016/S0008-6223(98)00082-7
Jain, A., Balasubramanian, R., and Srinivasan, M. P. (2016). “Hydrothermal conversion of biomass waste to activated carbon with high porosity: A review,” Chemical Engineering Journal 283, 789-805. DOI: 10.1016/j.cej.2015.08.014
Kang, S. M., Jiang, S. H., Peng, Z. Z., Lu, Y., Guo, J. F., Li, J. W., Zeng, W. X., and Lin, X. Y. (2018). “Valorization of humins by phosphoric acid activation for activated carbon production,” Biomass Conversion and Biorefinery 8(4), 889-897. DOI:10.1007/s13399-018-0329-3
Leung, P. S., and Safford, G. J. (1970). “An investigation of the early stage graphitization process by neutron inelastic scattering,” Carbon 8(4), 527-544. DOI: 10.1016/0008-6223(70)90015-1
Li, Y. X., Zhang, X., Yang, R. G., Li, G. Y., and Hu, C. W. (2015). “The role of H3PO4 in the preparation of activated carbon from NaOH-treated rice husk residue,” RSC Advances 5(41), 32626-32636.DOI: 10.1039/c5ra04634c
Luo, Y. P., Li, D., Chen, Y. C., Sun, X. Y., Cao, Q., and Liu, X. F. (2019). “The performance of phosphoric acid in the preparation of activated carbon-containing phosphorus species from rice husk residue,” Journal of Materials Science 54(6), 5008-5021. DOI: 10.1007/s10853-018-03220-x
Ma, Z. Q., Wang, J. H., Yang, Y. Y., Zhang, Y., Zhao, C., Yu, Y. M., and Wang, S. R. (2018). “Comparison of the thermal degradation behaviors and kinetics of palm oil waste under nitrogen and air atmosphere in TGA-FTIR with a complementary use of model-free and model-fitting approaches,” Journal of Analytical and Applied Pyrolysis 134, 12-24. DOI: 10.1016/j.jaap.2018.04.002
Ma, Z. Q., Yang, Y. Y., Ma, Q. Q., Zhou, H. Z., Luo, X. P., Liu, X. H., and Wang, S. R. (2017). “Evolution of the chemical composition, functional group, pore structure and crystallographic structure of bio-char from palm kernel shell pyrolysis under different temperatures,” Journal of Analytical and Applied Pyrolysis 127, 350-359. DOI: 10.1016/j.jaap.2017.07.015
Malaika, A., Rechnia-Gorący, P., Kot, M., and Kozłowski, M. (2018). “Selective and efficient dimerization of isobutene over H3PO4/activated carbon catalysts,” Catalysis Today 301, 266-273. DOI: 10.1016/j.cattod.2017.02.038
Mao, H., Chen, X., Huang, R., Chen, M., Yang, R., Lan, P., Zhou, M., Zhang, F., Yang, Y., and Zhou, X. (2018). “Fast preparation of carbon spheres from enzymatic hydrolysis lignin: Effects of hydrothermal carbonization conditions,” Scientific Reports 8(1), 9501. DOI: 10.1038/s41598-018-27777-4
Mao, H., Zhou, D., Hashisho, Z., Wang, S., Chen, H., and Wang, H. (2015). “Preparation of pinewood and wheat straw-based activated carbon via a microwave-assisted potassium hydroxide treatment and an analysis of the effects of the microwave activation conditions,” BioResources 10(1), 809-821. DOI: 10.15376/biores.10.1.809-821
Mao, H., Tang, J., Xu, J., Peng, Y., Chen, J., Wu, B., Jiang, Y., Hou, K., Chen, S., Wang, J., Lee, H. R., Halat, D. M., Zhang, B., Chen, W., Plantz, A. Z., Lu, Z., Cui, Y., and Reimer, J. A. (2020). “Revealing molecular mechanisms in hierarchical nanoporous carbon via nuclear magnetic resonance,” Matter 3(6), 2093-2107. DOI: 10.1016/j.matt.2020.09.024
Nunes, C. A., and Guerreiro, M. C. (2011). “Estimation of surface area and pore volume of activated carbons by methylene blue and iodine numbers,” Química Nova 34(3), 472-476. DOI: 10.1590/S0100-40422011000300020
Olivares-Marín, M., Fernández-González, C., Macías-García, A., and Gómez-Serrano, V. (2006). “Thermal behaviour of lignocellulosic material in the presence of phosphoric acid. Influence of the acid content in the initial solution,” Carbon 44(11), 2347-2350. DOI: 10.1016/j.carbon.2006.04.004
Puziy, A. M., Poddubnaya, O. I., Martínez-Alonso, A., Suárez-García, F., and Tascón, J. M. (2005). “Surface chemistry of phosphorus-containing carbons of lignocellulosic origin,” Carbon 43(14), 2857-2868. DOI: 10.1016/j.carbon.2005.06.014
Puziy, A. M., Poddubnaya, O. I., Martı́nez-Alonso, A., Suárez-Garcı́a, F., and Tascón, J. M. D. (2002). “Synthetic carbons activated with phosphoric acid: I. Surface chemistry and ion binding properties,” Carbon 40(9), 1493-1505. DOI: 10.1016/S0008-6223(01)00317-7
Romero-Anaya, A. J., Lillo-Ródenas, M. A., Lecea, C. S. M., and Linares-Solano, A. (2012). “Hydrothermal and conventional H3PO4 activation of two natural bio-fibers,” Carbon 50(9), 3158-3169. DOI: 10.1016/j.carbon.2011.10.031
Rouquerol, J., Avnir, D., Fairbridge, C. W., Everett, D. H., Haynes, J. M., Pernicone, N., Ramsay, J. D. F., Sing, K. S. W., and Unger, K. K. (1994). “Recommendations for the characterization of porous solids,” Pure and Applied Chemistry 66(8), 1739-1758. DOI: 10.1351/pac199466081739
Sing, K. S. W. (1982). “Reporting physisorption data for gas/solid systems with special reference to the determination of surface area and porosity,” Pure and Applied Chemistry 54(11), 2201-2218. DOI: 10.1351/pac198557040603
Solum, M. S., Pugmire, R. J., Jagtoyen, M., and Derbyshire, F. (1995). “Evolution of carbon structure in chemically activated wood,” Carbon 33(9), 1247-1254. DOI: 10.1016/0008-6223(95)00067-N
Suárez-Garcı́a, F., Martı́nez-Alonso, A., and Tascón, J. M. (2004). “Activated carbon fibers from Nomex by chemical activation with phosphoric acid,” Carbon 42(8), 1419-1426. DOI: 10.1016/j.carbon.2003.11.011
Villota, E. M., Lei, H. W., Qian, M., Yang, Z. X., Villota, S. M. A., Zhang, Y. Y., and Yadavalli, G. (2017). “Optimizing microwave-assisted pyrolysis of phosphoric acid-activated biomass: Impact of concentration on heating rate and carbonization time,” ACS Sustainable Chemistry & Engineering 6(1), 1318-1326. DOI: 10.1021/acssuschemeng.7b03669
Wada, M., Hori, R., Kim, U. J., and Sasaki, S. (2010). “X-ray diffraction study on the thermal expansion behavior of cellulose Iβ and its high-temperature phase,” Polymer Degradation & Stability 95(8), 1330-1334. DOI: 10.1016/j.polymdegradstab.2010.01.034
Wigmans, T. (1986). Fundamentals and Practical Implications of Activated Carbon Production by Partial Gasification of Carbonaceous Materials, Martinus Nijhoff Publishers, Leiden, Netherlands.
Wu, H. F., Chen, R. Y., Du, H. X., Zhang, J., Shi, L. M., Qin, Y., Yue, L. Z., and Wang, J. P. (2019). “Synthesis of activated carbon from peanut shell as dye adsorbents for wastewater treatment,” Adsorption Science & Technology 37(1-2), 34-48.DOI: 10.1177/0263617418807856
Yagmur, E., Inal, I. I. G., Gokce, Y., Ghobadi, T. G. U., Aktar, T., and Aktas, Z.(2018). “Examination of gas and solid products during the preparation of activated carbon using phosphoric acid,” Journal of Environmental Management 228, 328-335. DOI: 10.1016/j.jenvman.2018.09.046
Yahya, M. A., Al-Qodah, Z., and Zanariah, N. C. W. (2015). “Agricultural bio-waste materials as potential sustainable precursors used for activated carbon production: A review,” Renewable & Sustainable Energy Review 46, 218-235. DOI: 10.1016/j.rser.2015.02.051
Yakout, S. M., and Sharaf El-Deen, G. (2011). “Characterization of activated carbon prepared by phosphoric acid activation of olive stones,” Arabian Journal of Chemistry 9(S2), S1155-S1162. DOI: 10.1016/j.arabjc.2011.12.002
Yang, H., Yan, R., Chen, H., Lee, D., and Zheng, C. (2007). “Characteristics of hemicellulose, cellulose and lignin pyrolysis,” Fuel 86(12-13), 1781-1788. DOI: 10.1016/j.fuel.2006.12.013
Yorgun, S., and Yildiz, D. (2015). “Preparation and characterization of activated carbons from Paulownia wood by chemical activation with H3PO4,” Journal of The Taiwan Institute of Chemical Engineers 53, 122-131. DOI: 10.1016/j.jtice.2015.02.032
Zuo, S. L. (2018). “A review of the control of pore texture of phosphoric acid-activated carbons,” New Carbon Materials 33(4), 289-302. DOI: 10.19869/j.ncm.1007-8827.2018.04.001
Zuo, S. L., Yang, J. X., and Liu, J. L. (2010). “Effects of the heating history of impregnated lignocellulosic material on pore development during phosphoric acid activation,” Carbon 48(11), 3293-3295. DOI: 10.1016/j.carbon.2010.04.042
Article submitted: October13, 2020; Peer review completed: January 16, 2021; Revised version received and accepted: April 1, 2021; Published: April 20, 2021.
DOI: 10.15376/biores.16.2.4007-4020