
Abstract
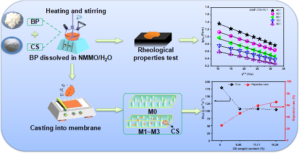
Bamboo dissolving pulp (BP)/chitosan (CS) blend solutions were obtained by adding different weight ratios of BP and CS particles to N-methyl-morpholine-N-oxide (NMMO) solvent. The processing and membrane-forming performances of the blend solutions were studied using a rotating rheometer. The BP/CS blend solutions’ optimal processing temperature was 50 to 70 °C. When the CS weight ratio was 9.09 wt%, the viscosity of the solution decreased, which was conducive to the processing of the membrane. The BP/CS blend ultrafiltration membranes were prepared by phase transformation of the blend solutions. The results showed that the rejection rate of the BP/CS blend ultrafiltration membrane with physically added CS particles was greatly improved compared with that of the regenerated BP ultrafiltration membrane.
Download PDF
Full Article
Effect of Chitosan on Membrane Formation and Processability of Bamboo Dissolving Pulp Based Ultrafiltration Membrane
Hongmei Yuan, Jianfei Wu, Junkang Lin, Liulian Huang, Lihui Chen,* and Shan Lin *
Bamboo dissolving pulp (BP)/chitosan (CS) blend solutions were obtained by adding different weight ratios of BP and CS particles to N-methyl-morpholine-N-oxide (NMMO) solvent. The processing and membrane-forming performances of the blend solutions were studied using a rotating rheometer. The BP/CS blend solutions’ optimal processing temperature was 50 to 70 °C. When the CS weight ratio was 9.09 wt%, the viscosity of the solution decreased, which was conducive to the processing of the membrane. The BP/CS blend ultrafiltration membranes were prepared by phase transformation of the blend solutions. The results showed that the rejection rate of the BP/CS blend ultrafiltration membrane with physically added CS particles was greatly improved compared with that of the regenerated BP ultrafiltration membrane.
Keywords: Bamboo dissolving pulp; Chitosan; Rheological properties; Ultrafiltration membrane; Rejection rate
Contact information: College of Material Engineering, Fujian Agriculture and Forestry University, Fuzhou 350002, Fujian, China; *Corresponding authors: lihuichen66@126.com; ls99036@163.com
GRAPHICAL ABSTRACT
INTRODUCTION
Ultrafiltration membranes have developed greatly in the past 20 years due to their low operating costs, simple assembly processes, and low-pressure and low-energy processes (Garba et al. 2019). However, because most of the materials used to prepare ultrafiltration membranes are traditional fossil polymers, which have low sustainability, natural polymer materials with the potential to replace traditional polymers in these membranes have attracted wide attention. Cellulose-based membranes have high permeability and are important in water treatment (Galiano et al. 2018). Cellulose is a competitor of other biodegradable polymers due to its renewability, hydrophilicity, biocompatibility, excellent mechanical properties, and low cost (Abdellah et al. 2018; Bai et al. 2019; Li et al. 2019a). However, cellulose membranes easily grow biologically active substances, which reduce the membrane’s permeability, shorten its life, and increase its energy consumption, and they are the main obstacle to the development of membrane filtration technology (Zhao et al. 2014; Han et al. 2019; Wu et al. 2020). Chitosan is a cationic polysaccharide obtained by deacetylating chitin. Its molecular structure is similar to that of cellulose, and it has broad-spectrum antibacterial properties (Li et al. 2019b; Mozafari et al. 2019). Therefore, blending chitosan and cellulose to prepare blend ultrafiltration membranes has become a research focus.
In recent years, preparation and research of blends of chitosan and cellulose have been widespread. For example, 1-ethyl-3-methylimidazolium acetate ([EMIM]Ac) ionic liquid has been used to prepare a cellulose/chitosan solution and study its rheological properties (Duan et al. 2011). Cellulose membranes have been filled with chitosan-coated zeolite to eliminate non-selective voids (Dogan and Hilmioglu 2010). Chitosan-cellulose composite membranes have been prepared to study their physical properties and their application in affinity membrane immunoadsorption (Yang et al. 2002). In addition, cellulose-chitosan blend material has been prepared to remove heavy metals and dyes in wastewater (Olivera et al. 2016; Urbina et al. 2018). A chitosan/cellulose mixture membrane has been prepared by the alkali/urea co-solution method (Zhang et al. 2019). However, there are not yet reports of adding chitosan as an enhanced particle to cellulose N-methyl-morpholine-N-oxide (NMMO) solution to prepare a blend-type ultrafiltration membrane.
In this study, NMMO was used as the solvent, chitosan (CS) was used as reinforcement phase, and bamboo dissolving pulp (BP) and chitosan were added into NMMO solution in batches to prepare BP/CS blend solution. A BP/CS blend ultrafiltration membrane was then prepared by phase transformation of the blend solution. The rheological properties of the blend solution were tested by a rotating rheometer, and the effects of CS at different mass concentrations on the processing and membrane-forming properties of the NMMO/BP solution were investigated. The structural and pore size changes of the BP/CS blend ultrafiltration membrane were determined by scanning electron microscopy (SEM) and Brunauer−Emmett−Teller (BET) nitrogen adsorption, and the effects of CS on the BP/CS blend ultrafiltration membrane filtration performance were analyzed. The preparation of a BP/CS blend ultrafiltration membrane provides broad application prospects for important applications such as water purification.
EXPERIMENTAL
Materials
Bamboo dissolving pulp with an α-cellulose content of 98.4 wt% was provided by a pulp mill in Southern China, and the degree of polymerization (DP) was 560. The NMMO was purchased from Tianjin Hainachuan Technology Development Co., Ltd. (Tianjin, China) (purity > 99%). Chitosan was obtained from Shanghai Sinopharm Group Chemical Reagent Co., Ltd., (Shanghai, China) with a deacetylation degree of 80% to 95%. N-methyl-morpholine-N-oxide was purchased from Shanghai Aladdin Reagent Co., Ltd. (Shanghai, China) (purity > 99%).
Methods
Degree of polymerization test
The degree of polymerization of cellulose was measured by the copper ethylene diamine solution method. First, accurately weigh 0.25, 0.30, and 0.35 g of the BP samples before and after crushing, and put them into sample dissolving bottles, numbered 1, 2, and 3 sample bottles, respectively. Simultaneously determine the moisture content of the BP sample. Add glass beads to the sample bottle, use a pipette to draw 15 mL of distilled water into the bottle, and stopper the bottle tightly. Shake the sample bottle vigorously until the sample is dispersed, then draw 15 mL of copper ethylene diamine solution into the bottle, and exhaust all remaining gas, and vigorously shake repeatedly until the sample is completely dissolved. Place the sample bottle in a constant temperature water bath for 5 to 15 min, adjust the temperature of the sample solution to 25 °C, pour out the solution in the viscometer for measurement, and keep the temperature constant for 5 min. Then measure the outflow time of the solution in the viscometer when the temperature is 25±0.1 °C, and use a stopwatch to measure 3 to 5 times in parallel, and take the average value to calculate the relative viscosity. Finally, the degree of polymerization of cellulose is calculated through an empirical formula.
Sample preparation
To accelerate the dissolution of the BP in the NMMO, the BP was crushed by a grinder for 3 min (DP was 521 after crushing) and then kept in a drying dish for later use. The NMMO was mixed with deionized water and placed in a three-neck flask that was immersed in an oil bath maintained at 90 °C until the NMMO was dissolved. The n-propyl gallate (2 to 3 wt‰, calculated based on NMMO) was added as an antioxidant. Then, according to the ratios shown in Table 1, CS and BP were sequentially added to the aqueous solution of NMMO.


Fig. 1. Preparation of the regenerated BP membrane and BP/CS blend ultrafiltration membranes
The temperature of the oil bath was increased to 110 °C, and the BP was dissolved by stirring for 2 to 3 h. Then, the temperature was lowered to 90 °C, the agitator was turned off, and the BP/CS mixed solution was left to stand for 2 to 5 h to remove air bubbles (Li et al. 2018). According to the traditional phase transformation method, the hot blending solution was uniformly cast onto the non-woven fabric at a speed of 20 cm/min, and then the gel was quickly immersed in a deionized water coagulation bath for 24 to 48 h, as shown in Fig. 1. The NMMO solvent was extracted with water to obtain the regenerated BP ultrafiltration membrane and the BP/CS blend ultrafiltration membranes. The NMMO solvent can be recycled and reused in the processes of dissolution and regeneration.
Rheological measurements
The rheological properties of the BP/CS blend solutions were tested using a rotating rheometer (HAAKE MARS Ⅲ, Thermo Fisher Scientific, Waltham, MA, USA) with a cone-plate diameter of 35 mm and a cone angle of 2°. The steady-state measurements were performed with shear rates (γ) from 0.1 to 1000 s-1 at 40, 50, 60, 70, and 80 °C. In the oscillating measurements, the storage modulus (G′) and loss modulus (G″) were determined as dynamic viscoelastic functions of the shear frequency (f), which ranged from 0.1 to 100 Hz. To minimize the deviations, each test was repeated 3 times.
Membrane filtration performance measurements
The flux and rejection of BSA solution (1.0 g/L) were conducted according to the measurement of permeability. For measurement, the membrane to be tested was cut into 50.26 cm2 and loaded into the membrane performance evaluation instrument. At room temperature, the pressure was increased by 0.1 MPa every 1 minute until the pressure was 0.15 MPa. Under this pressure, after pre-pressing the membrane for 30 min, when the membrane flux was stable, the permeation volume of the solution passing through the membrane within a certain period of time was measured. The permeate flux was calculated using Eq. 1,
J = V / (A · t) (1)
where J is the permeate flux (L/(m2·h)), V is the volume of permeate (L), A is the effective area of the membrane (m2), and t is the permeate collection time (h).
The concentration of the feed and filtered solution were calculated by UV-spectrophotometer (Lambda 750S, PerkinElmer, Waltham, MA, USA) at 280 nm. The BSA rejection ratio was determined using the following Eq. (2) (Yang et al. 2019),
R = (C – CP) / C × 100% (2)
where CP and C are the concentration of BSA in permeate and feed liquid, respectively.
Scanning Electron Microscopy (SEM) measurements
The morphologies of the BP ultrafiltration membrane (M0) and the BP/CS blend ultrafiltration membranes (M1 to M3) were studied by SEM (JSM-7500F, JEOL, Tokyo, Japan). The membranes (M0 to M3) were quenched in liquid nitrogen and freeze-dried for 24 h. The sample membranes were plated with a thin layer of gold under vacuum, and the SEM images were taken with an accelerating voltage of 3 kV.
Brunauer−Emmett−Teller (BET) measurements
The regenerated BP ultrafiltration membrane (M0) and BP/CS blend ultrafiltration membranes (M1 to M3) were freeze dried and cut into 0.2 cm × 0.2 cm pieces. The surface areas, pore volumes, and pore sizes of the membranes (M0 to M3) were measured using the nitrogen adsorption method. The sample tube was charged and subjected to a BET test (ASAP 2460, Micromeritics Instrument Corporation, Norcross, GA, USA) to analyze the specific surface area and average pore size. Under isothermal conditions, the specific surface area and internal pore size distribution of the prepared sample were calculated by the amount of nitrogen adsorption and desorption. The main principle of the test is: different pore structures such as micropores, mesopores, macropores and their hierarchical pore structures have different adsorption and desorption capacities for nitrogen. The porous material has a rich pore structure. When the amount of nitrogen adsorption and desorption of the sample is inconsistent, a hysteresis loop will be formed. According to the adsorption and desorption curve of the sample, different models are used to calculate the specific surface area and pore diameter of the sample structure. Degassing the sample for 8 hours before testing is recommended to ensure that the gas in the sample is removed. Generally, the nitrogen adsorption capacity at the reference boiling point (77.4 K) is measured at a low pressure of 1 atm or lower. In the low pressure range, single-molecule adsorption occurs, and then as the pressure increases, a multi-molecule adsorption layer is formed. To account for such an adsorption process, the BET equation is used, which is a modification of the Langmuir equation. The gas adsorption data performs a linear regression on the gas pressure. From its gradient, the amount of gas adsorption at the surface of the material covered by the monomolecular adsorption layer can be found. Based on this value, the specific surface area in m2/g can be determined. The average pore diameter can then be found from the pore volume obtained by the helium mercury substitution method and the specific surface area of the pore obtained by the BET method (Sakai 1994).
RESULTS AND DISCUSSION
Effect of Temperature on BP/CS Blend Solution Viscous Flow Activation Energy
At a constant shear rate, the relationship between the apparent viscosity of the polymer and the temperature conformed to the Arrhenius equation (Eq. 3) (Yao et al. 2014),

where ηa (Pa·s) is apparent viscosity, T (K) is the absolute temperature, A is a constant relative to the substance, ΔEη (kJ/mol) is the solution flow activation energy, and R is the gas constant (R = 8.314 J/(mol·K )). Equation 3 shows that ln ηa had a linear relationship with a 1/T, and the slope was ΔEη/R. A solution whose ΔEη value is higher is more sensitive to temperature changes (Tan et al. 2011). The relationship of ln ηa with 1/T is shown for each blend solution in Fig. 2. Trend lines were obtained by curve fitting, and the ΔEη value of each solution was calculated according to Eq. 3 (Table 2). When the weight content of CS ranged from 9.09 wt% to 14.24 wt%, the ΔEη values of the BP/CS solutions were all lower than that of the pure BP solution. This result indicates that the fluidities of the blend solutions, with added CS, were less sensitive to temperature changes than that of the pure BP solution. The ΔEη values of the BP/CS solutions were lower than the results of Duan et al. (2011) (range of ΔEη: 52.10 kJ/mol to 62.50 kJ/mol; temperature range: 80 °C to 100 °C), indicating that the fluidities of the BP/CS blend solutions were less affected by temperature changes between 40 and 80 °C (Cross 1965), which is beneficial for casting into a membrane.

Fig. 2. The relationship curves of ln ηa vs. 1/T for the BP solution and BP/CS blend solutions

Effect of Temperature on Non-Newtonian Exponent (n) of BP/CS Blend Solutions
The degree of deviation of a non-Newtonian fluid from a Newtonian fluid can be expressed by the non-Newtonian exponent (n), which can be calculated according to the Ostwald-de Waele power law model (Eq. 4) (Lu et al. 2014):

where τ (Pa) is shear stress and k is the consistency index. Figure 3 shows the curves of lg τ vs. lg γ for the BP/CS blend solutions. The slope of the curve is the n value of the corresponding solution, as shown in Table 3. As shown in Fig. 3, the n values of the BP/CS blend solutions at different temperatures were less than 1, indicating that the BP/CS blend solutions at different temperatures were pseudoplastic fluids (Li et al. 2016). With increasing temperature, the n values of the solutions gradually increased, indicating that the increase of temperature was conducive to increasing the fluidities of the solutions and improving their performance. In addition, as shown in Table 3, when the CS weight content was 9.09 wt%, the n values of the BP/CS blend solution were higher than those of the pure BP solution at the same temperatures, because an appropriate amount of CS can reduce the apparent viscosity of the BP/CS blend solution and increase its fluidity, which is similar to the research results of Li et al. (2016). With increasing CS weight content (from 9.09 wt% to 14.24 wt%) at a given temperature, the n values of the blend solutions gradually decreased, and the flow performance decreased. This result was because, with the increase of CS weight content, the apparent viscosities of the BP/CS blend solutions also gradually increased.

Fig. 3. lg τ vs. lg γ curves of BP solution and BP/CS blend solutions at different temperatures

Effect of Temperature on the Structural Viscosity Index (Δη) of BP/CS Blend Solutions
The structural viscosity index (Δη) can indicate the tendency of shear thinning and characterize the degree of structure of the fluid, so it is an important measure of the processability of the fluid (Li et al. 2016). Generally, smaller structural viscosity indices indicate better processability of the solution. When the shear stress is constant, the shear thinning tendency is mainly related to the interaction forces between macromolecules in the solution. With greater interaction forces between the macromolecules in the solution, the tendency of shear thinning decreases, and the structural viscosity index increases, which can be expressed by the following equation (Eq. 5) (Chhabra 2010):

Figure 4 shows the lg ηa vs. γ0.5 relationship curves of the BP/CS blend solutions at different temperatures.


Fig. 4. lg ηa vs. γ0.5 curves of BP solution and BP/CS blend solutions at different temperatures
With increasing γ0.5, the structural viscosity index decreased, because the increase of shear rate destroyed the interactions between macromolecules, and the apparent viscosity of the blend solutions decreased. Thus, the structural degrees of the solutions decreased. In addition, at a certain shear rate, with increasing temperature, the structural viscosity indices of the BP/CS blend solutions decreased, indicating that temperature affected the activities of macromolecular chains in the solutions. As the temperature increases, the activity of the macromolecular chains increases, the interaction between molecules decreases, and the degree of structuring of the blend solution decreases, so the structural viscosity index decreases (Tan et al. 2011). However, it is not feasible to improve the fluidities of the BP/CS blend solutions only by increasing the temperature. Excessively high temperatures (greater than 80 °C) not only cause degradation of BP and decomposition of NMMO and reduce product quality, but they also increase energy consumption and requirements for equipment (Li et al. 2012). Therefore, an appropriate temperature increase below 80 °C is beneficial to the membrane preparation of the blend solution. In addition, when the CS weight content was 9.09 wt%, the Δη values of the BP/CS blend solution at a given temperature were lower than those of the pure BP solution, which is similar to the results of Li et al. (2016). At a given temperature, as the CS weight content increased (from 9.09 wt% to 14.24 wt%), the blend solutions’ Δη values increased gradually, and the flow performance gradually decreased. This result was because, with the increases of CS weight content, the apparent viscosities of the blend solutions also increased gradually.
Crossing Point (Gc) and Crossing Point Frequency (fc) of BP/CS Blend Solutions
Dynamic rheological tests were performed at 40, 50, 60, 70, and 80 °C for the BP solution and BP/CS blend solutions to further study the effect of temperature on the dynamic rheological properties of the BP/CS blend solutions. Figure 5 shows the storage modulus (G′) and loss modulus (G″) values of the BP/CS blend solutions at different temperatures as functions of shear frequency. As temperature increased, the storage modulus (G′) and loss modulus (G″) values of the blend solutions decreased at a given CS weight content. G′ is related to the elastic component of the blended solution, and is affected by the cross-linking, entanglement and aggregation structure of BP and CS molecules. G″ is related to the viscosity of the blended solution, and is affected by the liquid-like components of the solution. Both are related to the processing properties of the blended solution. In a certain shear frequency range (0.1 Hz < f < 100 Hz), as the shear frequency increased, both the storage modulus and the loss modulus increased, with a crossing point at a certain shear frequency, namely, the gel point (Lee et al. 2017). Table 5 lists the G′–G″ crossing point (Gc) and crossing point frequency (fc) values of the pure BP solution and the BP/CS blend solutions at different temperatures. At a given CS weight content, as temperature increased, Gc in the blend solutions moved to the high-frequency region. This phenomenon was consistent with the rheological properties of cellulose/CS in ionic liquid solutions (Duan et al. 2011). Before the crossing point, the loss modulus (G″) values of the blend solutions were greater than the storage modulus (G′) values, and the viscosities of the blend solutions were greater than the elasticities. After the crossing point, the storage modulus (G′) values of the blend solutions were greater than the loss modulus (G″) values, and the elasticities of the blend solutions were greater than the viscosities (Peng et al. 2018). In addition, at low temperature (< 50 °C), the BP/CS blend solutions presented greater elasticity than viscosity in the low-frequency region (f < 1 Hz). The decreased fluidities of the blend solutions are not conducive to the progress of casting into membrane, so appropriately increasing the temperature is beneficial to cast into the membrane. According to G′–G″ crossing point (Gc) and crossing point frequency (fc) of BP solution and BP/CS blend solutions at different temperatures (Table 5), the suitable processing temperature range of the BP/CS blend solutions was 50 to 70 °C.

Fig. 5. G′/G″ vs. f curves of BP solution and BP/CS blend solutions at different temperatures

Changes of Complex Viscosities of BP/CS Blend Solutions
Figure 6 shows the complex viscosity (η*) vs. f curves of the pure BP solution and the BP/CS blend solutions at 40, 50, 60, 70, and 80 °C. The complex viscosity is the linear scaling coefficient between shear stress and shear frequency (Chhabra 2010). With increasing f, the η* values of the blend solutions decreased at a given temperature, showing typical shear-thinning behavior. This result is because, when f increases, the shear stress also increases, which provides enough energy for the sliding of the macromolecular chains. Thus, the mobilities of chain segments increase, the interaction forces between molecules decrease, and the untangling tendencies of the macromolecular chains increase, resulting in decreased flow resistance in the blend solutions and decreased values of η* (Wang et al. 2007). When the CS weight content was 9.09 wt%, the flow resistance of the solution was the lowest, and it was substantially lower than that of the pure BP solution, indicating that an appropriate amount of CS can reduce the viscosity of the solution. This result was consistent with the effect of shear rate on apparent viscosity (ηa). As the CS weight content increased (from 9.09 wt% to 14.24 wt%), the solution η* values also gradually increased, indicating that the entanglement degrees and hydrogen bond forces between CS and BP molecular chains were greater, and the flow resistances were greater. This conclusion is consistent with the measurement results of G′ and G″. At a given shear frequency (f) of BP/CS blend solution, with increasing of temperature, the mobilities of CS and BP molecular chains increase, the cross-linking, entanglement, and aggregation between macromolecular chains decrease, and the η* of the solution decreases (Graessley 1974; Ward and Klein 2007). This result is similar to steady-state rheological behavior, where high temperatures reduce the viscosity of the solution, indicating that increasing the temperature can reduce the viscosity of the solution and improve its machining performance. The suitable processing temperature range of the BP/CS blend solutions was 50 to 70 °C.

Fig. 6. η* vs. f curves of pure BP solution and BP/CS blend solutions at different temperatures
Flux Changes and Rejection Rates of Membranes
As shown in Fig. 7, the regenerated BP ultrafiltration membrane and the BP/CS blend ultrafiltration membranes with different CS contents were prepared. With increasing CS content, the rejection rate of the BP/CS blend ultrafiltration membrane substantially increased, and the membrane flux decreased. This result may be because the physically added CS particles refined the pore size of the membrane. The rejection rate of the membrane was increased. SEM scan and BET can explain the pore size changes of BP ultrafiltration membrane and BP/CS blend ultrafiltration membrane, thereby determining the changes of membrane flux and rejection rate.

Fig. 7. Effect of CS weight content on membrane flux and rejection rate of BP/CS blend ultrafiltration membranes
Morphologies of the Membranes
The surfaces and cross sections of the regenerated BP membrane (M0) and the BP/CS blend ultrafiltration membranes (M1 to M3) are shown in Fig. 8. The SEM images showed that the sample membranes (M0 to M3) had finger-like pore structures, and as the mass of CS increased, the pores seemed to become tighter but uneven. This result may be because too many CS molecules penetrated the BP molecules, forming more heterogeneous networks.

Fig. 8. SEM images of the regenerated BP membrane (M0) and BP/CS blend ultrafiltration membranes (M1 to M3): (a) surface and (b) cross-section
The BP/CS blend ultrafiltration membranes with different CS contents had semi-finger and semi-sponge structures. The part close to the interface between the BP/CS and air was finger-shaped pores, and the part close to the interface between the BP/CS and glass was spongy pores. The surfaces of sample membranes M1 to M3 were rougher than that of M0, which may be caused by the adhesion of some of the CS to the surfaces of the blend membranes.
BET Analysis of the Membranes
Figure 9 shows the BET adsorption of nitrogen by the regenerated BP ultrafiltration membrane and the BP/CS blend ultrafiltration membranes. The results showed that, as the relative pressure increased, the regeneration adsorption capacities of the membranes decreased slightly and then increased sharply. This behavior corresponds to a typical isotherm of porous materials (Barrett et al. 1951). The BET theory is based on the multilayer physical adsorption of gas (usually nitrogen) on the solid surface to determine the specific surface area. For porous materials, the Barrett-Joyner-Halenda (BJH) method uses the modified Kelvin equation. When the relative pressure decreases from a high value to a low value, the amount of adsorbate removed from the material’s pores is related to the pore size (Urbina et al. 2018).

Fig. 9. BET analyses of the regenerated BP ultrafiltration membrane and BP/CS blend ultrafiltration membranes

The results for the pure regenerated BP membrane (M0) and the BP/CS blended ultrafiltration membranes (M1 to M3) are shown in Table 6. With the addition of CS to the pure regenerated BP membrane matrix, the specific surface areas and total pore volumes of the BP/CS blend membranes (M1 to M3) were higher than those of the pure regenerated BP membrane (M0), while the average pore sizes were lower than that of the regenerated cellulose ultrafiltration membrane (M0). These results indicate that, by adding CS, larger pores were filled, and many nanopores were formed. Thus, the average pore size decreased, and the specific surface area increased.
CONCLUSIONS
- The best processing temperature of the BP/CS blend solution was 50 to 70 °C.
- When the chitosan (CS) weight ratio was 9.09 wt%, the viscosity of the solution decreased, which was beneficial to the processing of the membrane.
- After the CS particles were physically added, the rejection rate of the bamboo dissolving pulp/chitosan (BP/CS) blend ultrafiltration membrane was greatly improved compared with that of the regenerated BP ultrafiltration membrane.
ACKNOWLEDGMENTS
The authors are very grateful to the General Project of The National Natural Science Foundation of China (31971612), Fujian Provincial Natural Science Foundation of China Youth Innovation Project (2019J05044) and Fujian Agriculture and Forestry University Science and Technology Innovation Special Project (CXZX2017040, CXZX2018007 and CXZX2018003). In addition, the authors sincerely thank the reviewers for their valuable time and constructive comments.
REFERENCES CITED
Abdellah, M. H., Pérez-Manríquez, L., Puspasari, T., Scholes, C. A., Kentish, S. E., and Peinemann, K.-V. (2018). “A catechin/cellulose composite membrane for organic solvent nanofiltration,” Journal of Membrane Science 567, 139-145. DOI: 10.1016/j.memsci.2018.09.042
Bai, L., Liu, Y., Ding, A., Ren, N., Li, G., and Liang, H. (2019). “Surface coating of UF membranes to improve antifouling properties: A comparison study between cellulose nanocrystals (CNCs) and cellulose nanofibrils (CNFs),” Chemosphere 217, 76-84. DOI: 10.1016/j.chemosphere.2018.10.219
Barrett, E. P., Joyner, L. G., and Halenda, P. P. (1951). The determination of pore volume and area distributions in porous substances. I. Computations from nitrogen isotherms,” Journal of the American Chemical Society 73(1), 373-380. DOI: 10.1021/ja01145a126
Chhabra, R. P. (2010). “Non-Newtonian fluids: An introduction,” in: Rheology of Complex Fluids, A. P. Deshpande, J. M. Krishnan, and P. B. S. Kumar (eds.), Springer, New York, NY, USA, pp. 3-34. DOI: 10.1007/978-1-4419-6494-6_1
Cross, M. M. (1965). “Rheology of non-Newtonian fluids: A new flow equation for pseudoplastic systems,” Journal of Colloid Science 20(5), 417-437. DOI: 10.1016/0095-8522(65)90022-X
Dogan, H., and Hilmioglu, N. D. (2010). “Chitosan coated zeolite filled regenerated cellulose membrane for dehydration of ethylene glycol/water mixtures by pervaporation,” Desalination 258(1-3), 120-127. DOI: 10.1016/j.desal.2010.03.027
Duan, X., Xu, J., He, B., Li, J., and Sun, Y. (2011). “Preparation and rheological properties of cellulose/chitosan homogeneous solution in ionic liquid,” BioResources 6(4), 4640-4651.
Galiano, F., Briceño, K., Marino, T., Molino, A., Christensen, K. V., and Figoli, A. (2018). “Advances in biopolymer-based membrane preparation and applications,” Journal of Membrane Science 564, 562-586. DOI: 10.1016/j.memsci.2018.07.059
Garba, M. D., Usman, M., Mazumder, M. A. J., Al-Ahmed, A., and Inamuddin. (2019). “Complexing agents for metal removal using ultrafiltration membranes: A review,” Environmental Chemistry Letters 17, 1195-1208. DOI: 10.1007/s10311-019-00861-5
Graessley, W. W. (1974). The Entanglement Concept in Polymer Rheology, Springer-Verlag, Berlin, Germany. DOI: 10.1007/BFb0031036
Han, N., Zhang, W., Wang, W., Yang, C., Tan, L., Cui, Z., Li, W., and Zhang, X. (2019). “Amphiphilic cellulose for enhancing the antifouling and separation performances of poly (acrylonitrile-co-methyl acrylate) ultrafiltration membrane,” Journal of Membrane Science 591. DOI: 10.1016/j.memsci.2019.117276
Lee, Y. J., Kwon, M. K., Lee, S. J., Jeong, S. W., Kim, H.-C., Oh, T. H., and Lee, S. G. (2017). “Influence of water on phase transition and rheological behavior of cellulose/ionic liquid/water ternary systems,” Journal of Applied Polymer Science 134(22). DOI: 10.1002/app.44658
Li, J. B., Zhang, M. Y., Xiu, H. J., and Li, X. P. (2012). “Rheological characteristics on solution of NMMO/cellulose with different degree of polymerization and its combination,” Advanced Materials Research 568, 396-399. DOI: 10.4028/www.scientific.net/AMR.568.396
Li, K., Guan, G., Zhu, J., Wu, H., and Sun, Q. (2019b). “Antibacterial activity and mechanism of a laccase-catalyzed chitosan–gallic acid derivative against Escherichia coli and Staphylococcus aureus,” Food Control 96, 234-243. DOI: 10.1016/j.foodcont.2018.09.021
Li, S., Liu, S., Huang, F., Lin, S., Zhang, H., Cao, S., Chen, L., He, Z., Lutes, R., Yang, J., et al. (2018). “Preparation and characterization of cellulose-based nanofiltration membranes by interfacial polymerization with piperazine and trimesoyl chloride,” ACS Sustainable Chemistry & Engineering 6(10), 13168-13176. DOI: 10.1021/acssuschemeng.8b02720.
Li, X., Li, H.-C., You, T.-T., Wu, Y.-Y., Ramaswamy, S., and Xu, F. (2019a). “Fabrication of regenerated cellulose membranes with high tensile strength and antibacterial property via surface amination,” Industrial Crops and Products 140. DOI: 10.1016/j.indcrop.2019.111603
Li, Y., Liu, X., Zhuang, X., Jin, X., and Liu, Q. (2016). “Rheological behavior and spinnability of ethylamine hydroxyethyl chitosan/cellulose co-solution in N-methylmorpholine-N-oxide system,” Fibers and Polymers 17(5), 778-788. DOI: 10.1007/s12221-016-5578-9
Lu, F., Wang, L., Ji, X., Cheng, B., Song, J., and Gou, X. (2014). “Flow behavior and linear viscoelasticity of cellulose 1-allyl-3-methylimidazolium formate solutions,” Carbohydrate Polymers 99, 132-139. DOI: 10.1016/j.carbpol.2013.08.025
Mozafari, M., Seyedpour, S. F., Salestan, S. K., Rahimpour, A., Shamsabadi, A. A., Firouzjaei, M. D., Esfahani, M. R., Tiraferri, A., Mohsenian, H., Sangermano, M., et al. (2019). “Facile Cu-BTC surface modification of thin chitosan film coated polyethersulfone membranes with improved antifouling properties for sustainable removal of manganese,” Journal of Membrane Science 588. DOI: 10.1016/j.memsci.2019.117200
Olivera, S., Muralidhara, H. B., Venkatesh, K., Guna, V. K., Gopalakrishna, K., and Kumar K., Y. (2016). “Potential applications of cellulose and chitosan nanoparticles/composites in wastewater treatment: A review,” Carbohydrate Polymers 153, 600-618. DOI: 10.1016/j.carbpol.2016.08.017
Peng, B., Tang, J., Wang, P., Luo, J., Xiao, P., Lin, Y., and Tam, K. C. (2018). “Rheological properties of cellulose nanocrystal-polymeric systems,” Cellulose 25, 3229-3240. DOI: 10.1007/s10570-018-1775-6
Sakai, K. (1994). “Determination of pore size and pore size distribution: 2. Dialysis membranes,” Journal of Membrane Science 96(1-2), 91-130.
Tan, L. W., Ji, Q., Zhang, J. J., Wang, F. J., Quan, F. Y., and Xia, Y. Z. (2011). “Rheological behavior of blend spinning solution of sodium alginate and carbon black,” Advanced Materials Research 332-334, 268-274. DOI: 10.4028/www.scientific.net/AMR.332-334.268
Urbina, L., Guaresti, O., Requies, J., Gabilondo, N., Eceiza, A., Corcuera, M. A., and Retegi, A. (2018). “Design of reusable novel membranes based on bacterial cellulose and chitosan for the filtration of copper in wastewaters,” Carbohydrate Polymers 193, 362-372. DOI: 10.1016/j.carbpol.2018.04.007
Wang, S.-Q., Ravindranath, S., Wang, Y., and Boukany, P. (2007). “New theoretical considerations in polymer rheology: Elastic breakdown of chain entanglement network,” The Journal of Chemical Physics 127(6). DOI: 10.1063/1.2753156
Ward, I. M., and Klein, P. G. (2007). “Polymer physics,” in: Encyclopedia of Magnetic Resonance, R. K. Harris and R. Wasylishen (eds.), John Wiley, Chichester, UK. DOI: 10.1002/9780470034590.emrstm0404
Wu, Y., Xia, Y., Jing, X., Cai, P., Igalavithana, A. D., Tang, C., Tsang, D. C. W., and Ok, Y. S. (2020). “Recent advances in mitigating membrane biofouling using carbon-based materials,” Journal of Hazardous Materials 382. DOI: 10.1016/j.jhazmat.2019.120976
Yang, L., Hsiao, W. W., and Chen, P. (2002). “Chitosan–cellulose composite membrane for affinity purification of biopolymers and immunoadsorption,” Journal of Membrane Science 197(1-2), 185-197. DOI: 10.1016/S0376-7388(01)00632-9
Yang, S., Zou, Q., Wang, T., and Zhang, L. (2019). “Effects of GO and MOF@GO on the permeation and antifouling properties of cellulose acetate ultrafiltration membrane,” Journal of Membrane Science. DOI: 10.1016/j.memsci.2018.09.068
Yao, Y., Mukuze, K. S., Zhang, Y., and Wang, H. (2014). “Rheological behavior of cellulose/silk fibroin blend solutions with ionic liquid as solvent,” Cellulose 21(1), 675-684. DOI: 10.1007/s10570-013-0117-y
Zhang, R., Xie, J., Yang, B., Fu, F., Tang, H., Zhang, J., Zhao, Y., Zhang, Y., Liu, L., and Zhu, Y. (2019). “Self-assembly of chitosan and cellulose chains into a 3D porous polysaccharide alloy films: Co-dissolving, structure and biological properties,” Applied Surface Science 493, 1032-1041. DOI: 10.1016/j.apsusc.2019.06.193
Zhao, X., Su, Y., Li, Y., Zhang, R., Zhao, J., and Jiang, Z. (2014). “Engineering amphiphilic membrane surfaces based on PEO and PDMS segments for improved antifouling performances,” Journal of Membrane Science 450, 111-123. DOI: 10.1016/j.memsci.2013.08.044
Article submitted: January 21, 2021; Peer review completed: February 28, 2021; Revised version received and accepted: May 2, 2021; Published: May 6, 2021.
DOI: 10.15376/biores.16.3.4752-4768