Abstract
Effects of dual-treatment on cellulose fiber quality, micro-structure appearance, crystalline structure, hydrogen bonds, and surface elements were analyzed using a fiber quality analyzer (FQA), scanning electron microscope (SEM), wide-angle X-ray diffraction (XRD), Fourier transform infrared spectroscopy (FT-IR), and X-ray photoelectron spectroscopy (XPS), respectively. In comparison to the untreated pulp, the brightness of pulp increased by 51.71%, whereas the apparent density and burst strength index of the pulpboard decreased by 11.76% and 48.18%, respectively. The absorption time, absorbability, and bulk of the fiber obtained by defibering the pulpboard decreased by 47.40%, 8.33%, and 5.32%, respectively, when it had been subjected to supplementary alkali. With the analysis of FQA and SEM, fiber swelled and curled, its surface was relatively smooth, and filaments of its partial surface area were exposed as a result of the supplementary alkali. Additionally, XRD analysis, FT-IR analysis, and XPS scanning spectra all showed that the crystallinity degree of fiber decreased by 45.10%, indicating more crystal structures were converted into amorphous structures. The proportion of total intra-molecular hydrogen bond intensity to total hydrogen bonds increased. The –OH content on fiber surface only decreased by 4.15%, compared with those of the untreated pulp, when the fiber was subjected to the two-step chemical treatment.
Download PDF
Full Article
Effects of Supplementary Alkali after Alkaline Peroxide Treatment on the Properties of Bleached Kraft Pine Fluff Pulp
Yongjian Xu,a,b Jiayong Wang, a,b Xin Qian, a,b Leigang Zuo,a,b,* and Xiaopeng Yue a,b
Effects of dual-treatment on cellulose fiber quality, micro-structure appearance, crystalline structure, hydrogen bonds, and surface elements were analyzed using a fiber quality analyzer (FQA), scanning electron microscope (SEM), wide-angle X-ray diffraction (XRD), Fourier transform infrared spectroscopy (FT-IR), and X-ray photoelectron spectroscopy (XPS), respectively. In comparison to the untreated pulp, the brightness of pulp increased by 51.71%, whereas the apparent density and burst strength index of the pulpboard decreased by 11.76% and 48.18%, respectively. The absorption time, absorbability, and bulk of the fiber obtained by defibering the pulpboard decreased by 47.40%, 8.33%, and 5.32%, respectively, when it had been subjected to supplementary alkali. With the analysis of FQA and SEM, fiber swelled and curled, its surface was relatively smooth, and filaments of its partial surface area were exposed as a result of the supplementary alkali. Additionally, XRD analysis, FT-IR analysis, and XPS scanning spectra all showed that the crystallinity degree of fiber decreased by 45.10%, indicating more crystal structures were converted into amorphous structures. The proportion of total intra-molecular hydrogen bond intensity to total hydrogen bonds increased. The –OH content on fiber surface only decreased by 4.15%, compared with those of the untreated pulp, when the fiber was subjected to the two-step chemical treatment.
Keywords: Alkaline-peroxide bleaching; Fluff pulp; Absorbability; Bonding strength
Contact information: a: College of Light Industry and Energy, Shaanxi Province Key Lab of Papermaking Technology and Specialty Paper, Shaanxi University of Science & Technology, Xi’an, Shaanxi, 710021 China; b: State Key Laboratory of Pulp and Paper Engineering, South China University of Technology, Guangzhou,510640; *Corresponding authors: biotougao@163.com; startshuishuier@163.com
INTRODUCTION
Cellulose, the most abundant natural polymer, is produced in nature at an annual rate of approximately 1011 to 1012 tons. It has the advantages of being renewable, has a low price, is pollution free, and has been widely used for centuries in all kinds of practical applications including paper, regenerated fiber, and cellulosic functional materials (Hon 1994; Zhao et al. 2007).
As a widely used kind of absorbent material, fluff pulp is made using cellulose fiber and has been used in hygienic products for several decades (Wu et al. 2001). Moreover, the fluff pulpboard must be de-fibered in a dry condition when it is used (Garnier et al. 2005). Therefore, appropriate absorbability and a relatively weak bonding strength of fluff pulp fibers are required (Xu et al. 2006). On the other hand, chemical treatments contribute to the better performance of the material after the mechanical separation of the fibers. Bonding strength is both a focus point and difficulty during the fluff pulp preparing process (Wang 2013). All the physical and chemical treatment processes used to achieve the goal of improving fluff pulp quality will affect the mechanical fluffing operation. For example, weak-bonding agents can be added during the preparation process to obtain weak bonding strength between the fibers. However, those additives exhibit detrimental effects on the absorbability of the pulp in traditional technology (Marrinan and Mann 1954; Eriksson 1994; Norlander 1998; Goswami et al. 2009). In recent years, several kinds of new weak-bonding additives with improved properties have been researched, but their cost is also a considerable problem (Sealey and Hevenor 2011).
A two-step chemical treatment is proposed in this work based on the mechanism of the chemical components and morphology characteristics of fibers, which have significant effects on the fiber strength and absorbability. It has been reported that a portion of the hemicellulose on the fiber surface was degraded when fiber was treated with alkali in a short time, which was conducive to the weak-bonding of fibers (Fang et al. 1999). According to Mohanty et al. (2001), alkali liquor permeated into the inside of fiber cell walls, which made the hemicellulose, resin, pigment, etc., around the cellulose dissolve and then be removed. The fiber was sufficiently swollen and became smooth, kinked, curled, and the shape of its cell cavity changed from flat to oval during the process of alkali treatment. Yang (2009) also reported that hemicellulose degraded in the form of peeling reactions under moderate alkaline conditions. Therefore, two-step chemical treatment was proposed as a kind of fluff-pulp preparation technology, one that combined 8 wt.% alkali treatment with peroxide bleaching.
In this paper, the effects of two-step chemical treatment on the mechanical properties of fluff pulp were investigated. The mechanism of two-step chemical treatment was also analyzed using a fiber quality analyzer (FQA), scanning electron microscope (SEM), wide-angle X-ray diffraction (XRD), Fourier transform infrared spectroscopy (FT-IR), and X-ray photoelectron spectroscopy (XPS) to lay the foundation of further research for fluff pulp making.
EXPERIMENTAL
Materials
Semi-bleached Pinus massoniana Lamb. Pulp was supplied by Feng Huang Paper Co. Ltd., Nanning, Guangxi, China. The Kappa number and brightness of the pulp were 9.09 and 50.18% ISO, respectively. The sodium hydroxide, magnesium sulfate, hydrogen peroxide, sodium silicate, ethylenediaminetetraacetic acid, and sulfuric acid were all of analytical grade and obtained from the Chemical Corporation of Shanghai Chemicals Corporation.
Methods
Compound fluffing
Cellulose fiber was mixed with the bleaching agents (NaOH (AR), H2O2 (107.95 g/L), MgSO4 (AR), Na2SiO3 (AR), EDTA (AR) evenly and diluted to the predetermined concentration in a plastic bag. The plastic bag was sealed and placed in a thermostatic water bath. The pulp was kneaded every 10 min. When the predetermined time was reached, the pulp was taken out from the water bath, and some residual liquid of the pulp was squeezed to distribute the supplementary alkali uniformly through the pulp suspension. After adding the supplementary alkali, the pulp was placed in the water bath again and treated for the predetermined time. Finally, the pulp was taken out and washed primarily with diluted sulphuric acid and then washed with a small amount of water until the pH value of the washed water was close to 7.
Physical properties determination
A whiteness testing apparatus (NO.010916, Wenzhou Instrument Co. Ltd., Wenzhou, Zhejiang, China), a computer-controlled thickness and apparent density testing instrument (DC-HJY03, Sichuan Changjiang Papermaking Instrument Factory, Yibin, Sichuan, China), and a bursting strength tester (DCP-NPY5600, Sichuan Changjiang Papermaking Instrument Co. Ltd., Yibin, Sichuan, China) were used to determine the brightness (GB/T 7974-2013), apparent density (GB/T 451.3-2002), and burst strength index (GB/T 1539-2007) of pulpboard, respectively. Properties of fluff pulp fiber were determined according to methods in GB/T 21331-2008.
The fiber bulk (A), absorption speed (B), and absorbability (C) were calculated according to the following formulae,

where s is the sample bottom area (19.64 cm2), h is the sample height, x is the sample weight (3 g), y is the sample weight after absorbing water sufficiently, and t is the time used in absorbing water from the sample bottom to the top (Wang 2013).
Fiber quality analysis
Thirty milligrams of fibers (oven dry weight) was dispersed in no more than 1000 mL of water. The suspension slurry was transferred to a 1000-mL beaker and diluted to 1000 mL. Then the morphological characteristics of those fibers were determined, and their qualities were analyzed by a fiber quality analyzer (FQA) (Morfi Compact, France Techpap Co. Ltd).
Fiber ultrastructure observation
The fibers were vacuum-dried at 40 °C for 6 h. After this, the dried samples were pasted onto a testing stand and sprayed with gold. Then, a SEM (SEM-3000M, South Korea Match Co. Ltd.) was used to observe the surface morphology and ultrastructure of the fiber sample. The scanning voltage was 3.0 kV.
X-ray diffraction analysis
A D/max 2200PC XRD (Rigaku Corporation, Tokyo, Japan) was used to analyze the crystalline degree of cellulose fiber samples with a 5°/min scan speed. Ni-filtered Cu Ka radiation (k=0.154 nm) generated at a voltage of 40 kV was utilized (Oh et al. 2005).
The crystallinity (XC) was analyzed using the Multi-peaks-fitting method. The crystallites’ sizes were determined from the ,, and lattice planes of cellulose fiber samples and then calculated using the Scherrer equation (Nishiyama et al. 2000; Gümüskaya et al. 2003),
![]() (4)
(4)
where D is the crystal size, β is the breadth of the peak of a specific phase, k is a constant that varies from 0.89 to 1, λ is the wavelength of incident X-rays, and 2θ is the corresponding Bragg angle (Oh et al. 2005; Luo and Zhu 2011).
FT-IR analysis
FT-IR spectra were recorded using a FT-IR spectrometer (VECTRO-22, Bruker Corporation, Karlsruhe, Germany). The infrared crystallization index (N-O’KI) (Chen and Yu 1989) was calculated using the equation that follows:
![]() (5)
(5)
where a1372 and a2900 are band intensities (1372 cm-1 is the C-H bending vibration, and 2900 cm-1 is C-H and CH2 stretching vibration).
The overlapping hydrogen peak in the approximate 3700 to 3000 cm-1 wave number range was dealt with using the Gaussian multi-peaks-fitting method, distributing it into three or four bands using Origin software (OriginLab Corporation, Northampton, USA). Furthermore, the absorbance bands of inter-molecular, or intra-molecular, hydrogen bonds were distinguished according to the report by Fengel and Strobel (1994).
XPS analysis
The 80 g/m2 hand sheets for XPS analysis were extracted using a benzene-alcohol mixture for 6 h, washed with deionized water, and air-dried. A Thermo, K-Alpha XPS (Thermo Fisher Scientific, USA) was used to obtain the XPS spectra. The apparatus was equipped with a mono Al K-Alpha X-ray irradiation source, LB6 filament electron gun, ion gun, electron synthetic system, a XYZq four-dimensional direction of motion with a variable temperature sample stage (-150 to 600 °C), and a CCD imaging system. It was also equipped with a 9-10 Torr vacuum, 150 W of power, and a binding energy calibration standard of C1s 284.8 eV. The XPS spectra was fitted and analyzed according to Johansson et al. (1999).
RESULTS AND DISCUSSION
Effect of Two-step Chemical Treatment on Physical Properties of Fluff Pulp
The pH value exhibits a marked influence on the efficiency of H2O2 bleaching. Normally, pH value is adjusted by the incorporation of an appropriate amount of NaOH (Hashem et al. 2010). Therefore, a suitable ratio of NaOH to H2O2 (mass ratio) should be chosen during the bleaching process. It was reported that the preferable ratio of NaOH to H2O2 was 1:1 when the bleaching concentration was in the range of 9% to 12% (Xie and Zhan 2008). Nevertheless, concentrated alkali treatment was combined with H2O2 bleaching in compound fluffing. Thus, the NaOH loading of compound fluffing would be much more than the traditional H2O2 bleaching process.
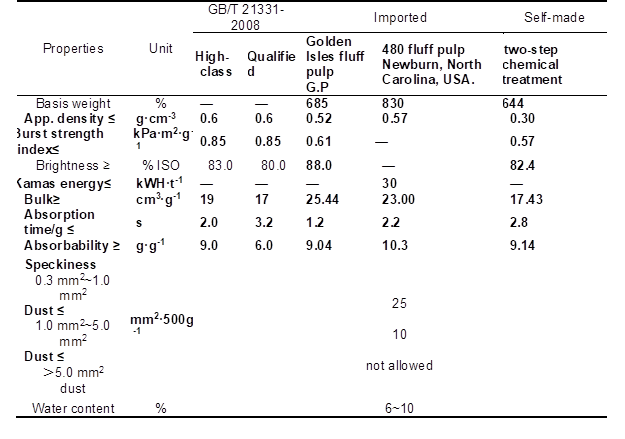
According to the primary research, the optimized compound fluffing technology was carried out under conditions of 8 wt.% NaOH loading, 1.8 wt.% H2O2 loading, 2.5 wt.% Na2SiO3 loading, 0.05 wt.% MgSO4 loading, 0.4 wt.% EDTA loading (based on oven-dry raw material mass), a temperature of 70 °C, concentration 10%, concentrated alkaline treated time of 10 min, and a total treated time of 60 min. The mechanical properties of fluff pulp prepared under these conditions were measured and compared with those of three other pulp samples. In addition, the quality of the self-made fluff pulp was analyzed according to the national standard (GB/T 21331-2008) of the People’s Republic of China (PRC), and compared to imported fluff pulp. The results are shown in Tables 1 and 2, respectively.
Table 1. Physical Properties of Fluff Pulp with Various Treatment Methods and Conditions

Note: 1) untreated pulp; 2) alkali-treated pulp (NaOH 8 wt.%; treated time 10 min); 3) H2O2 bleached pulp (H2O2 1.8 wt.%, Na2SiO3 2.5 wt.%, MgSO4 0.05 wt.%, EDTA 0.4 wt.%, percentage of oven-dry raw material mass; treated time of 60 min); 4) two-step chemically treated pulp (NaOH 8 wt.%, H2O2 1.8 wt.%, Na2SiO3 2.5 wt.%, MgSO4 0.05 wt.%, EDTA 0.4 wt.%, percentage of oven-dry raw material mass, total treated time of 60 min, concentrated alkali treated time 10 min). Other conditions such as temperature (70 °C) and concentration (10%) were invariable.
In comparison with the untreated pulp, the brightness of the pulp increased by 51.71%, and the apparent density and the burst strength index of the pulpboard decreased by 11.76% and 48.18%, respectively. The absorption time, absorbability, and bulk of fiber obtained by defibering the pulpboard decreased by 47.40%, 8.33%, and 5.32%, respectively, when the fiber was treated with dual-treatment. The absorbability and bulk of the fiber being treated with the 8 wt.% alkali solution were superior to those of the fiber treated with two-step chemical treatment. Properties such as brightness, burst strength index, absorption time, and the absorption speed of the pulp being treated with two-step chemical treatment were all superior to those of the 8 wt.% alkali-treated pulp. Additionally, all the properties of H2O2 bleached pulp, such as the brightness and the absorbability, were inferior to those of two-step chemically treated pulp.
The varied performance of the pulp fiber mentioned above was mainly attributed to the two-step chemical treatment, in which concentrated alkali was added when H2O2 bleaching was coming to an end. As a result, the degradation of H2O2 can be reduced, the residual H2O2 can be effectively used, and the brightness of the pulp can be further increased. Besides, alkaline degradation of hemicellulose on the fiber surface was conducive to the fiber’s weak bonding strength. Simultaneously, the absorbability of the fiber exhibited a slight decline.
As shown in Table 2, the absorbability, apparent density, and burst strength index of self-made fluff pulp all met the high-class standard of GB/T 21331-2008, and were superior to those of the Golden Isles fluff pulp. The absorbability of self-made fluff pulp was inferior to that of 480 fluff pulp. In addition, the bulk and absorption time of self-made fluff pulp both met the qualified standard of GB/T 21331-2008, but they were inferior to that of the imported fluff pulp. The influences of self-made fluff pulp properties mentioned above were primarily a result of the degradation of a small amount of hemicellulose on the fiber surface, which was conducive to obtain appropriate apparent density and the burst strength index of fluff pulp. However, the degradation had little negative effect on the absorbability and bulk of the fiber.
Table 2. Fluff Pulp PRC National Standard and Physical Properties of the Self-Made and Imported Fluff Pulp
Effect of Two-step Chemical Treatment on Fluff Pulp Fiber Quality and Micro-Structure Appearance
To investigate the effect of the fiber morphology characteristics on the bonding strength between fibers, a fiber quality analyzer was used to characterize the performance of four kinds of fiber. The results are shown in Table 3.
Based on the data in Table 3, the following analysis could be performed. In comparison with the untreated fiber, the fiber number-average length and weight-average length decreased by 8.92% and 8.27%, respectively. The fiber width and coarseness increased by 1.73% and 6.51%, respectively. The kinked and curled fiber content increased by 9.54% and 26.13%, respectively, and the fines content decreased by 29.63% when the fiber was treated with two-step chemical treatment. As a result, the bulk of fluff pulpboard increased, and consequently it was rather easily defibered. Simultaneously, the bulk of the fluff pulp fiber was also improved. Additionally, the dust decreased when the fluff pulpboard was defibered because of the reduction of the fines content, which could have improved the defibering environment.
Table 3. Quality Indicators of Fibers with Various Treatment Methods and Conditions

Note: 1) untreated pulp; 2) alkali-treated pulp (NaOH 8 wt.%; treated time 10 min); 3) H2O2 bleached pulp (H2O2 1.8 wt.%, Na2SiO3 2.5 wt.%, MgSO4 0.05 wt.%, EDTA 0.4 wt.%, percentage of oven-dry raw material mass; time 60 min); 4) two-step chemically treated pulp (NaOH 8 wt.%; H2O2 1.8 wt.%, Na2SiO3 2.5 wt.%, MgSO4 0.05 wt.%, EDTA 0.4 wt.%, percentage of oven-dry raw material mass; total treated time 60 min, concentrated alkali treated time 10 min). Other conditions such as temperature (70 °C) and concentration (10%) were invariable.
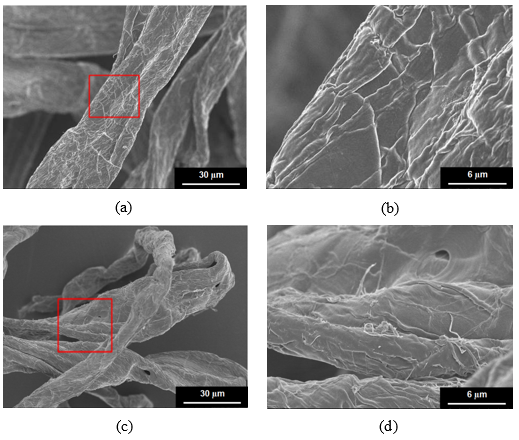
Fig. 1. SEM micrographs of fiber: (a) and (b) un-treated fiber (1000×), (5000×); (c) and (d) two-step chemically treated fiber (1000×), (5000×). Note: two-step chemical treatment conditions: NaOH 8 wt.%, H2O2 1.8 wt.%, Na2SiO3 2.5 wt.%, MgSO4 0.05 wt.%, EDTA 0.4 wt.%, percentage of oven-dry raw material mass, total treated time 60 min, concentrated alkali treated time 10 min, temperature 70 °C, and 10% concentration.
SEM was also used to investigate the effect of the fiber micro-structure appearance on the fiber bonding strength. The micro-structure appearance and its partially enlarged detail of untreated pulp and two-step chemically treated pulp fiber samples are shown in Fig. 1.
It can be seen from Fig. 1 that the untreated pulp fiber surface was rough and complicated. However, the two-step chemically treated pulp fiber surface was relatively smooth. The fiber filaments of its partial surface area were exposed, which was conducive to the increase in its accessibility to water and other chemical agents, thus improving its absorbability. Additionally, because of the removal of partial surface layer, a small amount of hemicellulose was degraded and free hydroxyl groups on the fiber surface were reduced, which was conducive to its weak bonding strength.
Effect of Two-step Chemical Treatment on the Fiber Crystalline Structure
Wide-angle X-ray diffraction curves and its fitting curves of untreated fiber, alkali-treated fiber, and two-step chemically treated fiber are shown in Figs. 2 and 3, respectively (Clolacu 2007; Qi et al. 2008).
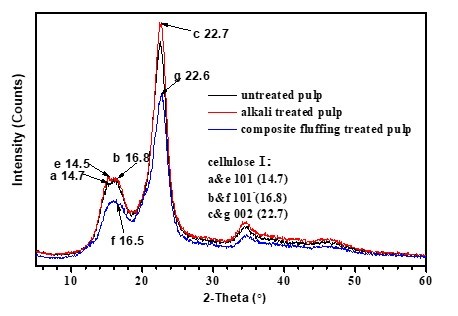
Fig. 2. Wide-angle X-ray diffraction curves of untreated fiber, alkali-treated fiber, and two-step chemically treated fiber. Note: Alkali-treated pulp (NaOH 8 wt.%, treated time 10 min, temperature 70 °C, concentration 10%), two-step chemically treated pulp (NaOH 8 wt.%, H2O2 1.8 wt.%, Na2SiO3 2.5 wt.%, MgSO4 0.05 wt.%, EDTA 0.4 wt.%, percentage of oven-dry raw material mass, total treated time 60 min, concentrated alkali treated time 10 min, temperature 70 °C, concentration 10%).
As shown in Fig. 2, the absorption peaks of these three cellulose samples all appeared at 2θ = 22.5°, 2θ = 16.5°, and 2θ = 14.5°, which were the typical absorption peaks of the 002 lattice plane, 101-lattice plane, and 101 lattice plane of the cellulose I structure, respectively. This revealed that these three cellulose samples all had typical cellulose I structure, in which both the crystal and amorphous structure existed. Moreover, the absorption peak of cellulose fiber treated using two-step chemical treatment also appeared at 2θ = 20.2°, as shown in Fig. 3(c), which was the typical absorption peak of the lattice plane of the cellulose II structure.
Analysis showed that the original crystalline type of fiber did not vary using an 8 wt.% alkali treatment with a short time and slight alkali loading. However, except for the typical cellulose I structure, the lattice plane absorption peak of a typical cellulose II structure also appeared when the fiber was treated with two-step chemical treatment. This indicated that the crystalline type of the fiber tended to vary from cellulose I structure to cellulose II structure when it was treated using the two-step chemical treatment. According to studies by Kroon-Batenburg and Kroon (1997) and Zugenmaier (2001), the crystalline type of the cellulose II structure was rather active, and its crystallites’ sizes were rather larger than those of cellulose I structure, which meant accessibility to a solvent for the fiber was superior with a cellulose II structure. As a result, the absorbability of the fluff pulp fiber was increased when using a two-step chemical treatment.

Fig. 3. Wide-angle X-ray diffraction fitting curves: (a) untreated fiber; (b) 8 wt.% alkali-treated fiber; (c) two-step chemically treated fiber
The crystallinity and crystallite size of 101,, and 002 lattice planes were also calculated using the Scherrer equation (Nishiyama et al. 2000), and results are shown in Table 4. It can be seen that the crystallinity degree of fiber samples decreased, both when the fiber was treated with 8 wt.% alkali solution, or with two-step chemical treatment.
Table 4. Effect of Two-step Chemical Treatment on Fiber Crystallinity
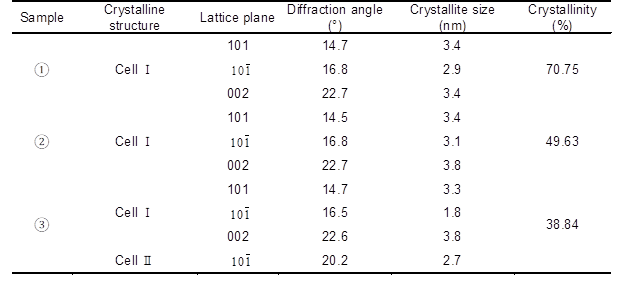
Note: 1) untreated pulp; 2) alkali-treated pulp (NaOH 8 wt.%, treated time 10 min, temperature 70 °C, concentration 10%); 3) two-step chemically treated pulp (NaOH 8 wt.%, H2O2 1.8 wt.%, Na2SiO3 2.5 wt.%, MgSO4 0.05 wt.%, EDTA 0.4 wt.%, percentage of oven-dry raw material mass, total treated time 60 min, concentrated alkali treated time 10 min, temperature 70 °C, concentration 10%).
The maximum value of the crystallinity degree decreased by 45.10% compared with that of the untreated pulp when the fiber was treated with a two-step chemical treatment. As a result, more of the cellulose crystal structure was converted into amorphous structure, which favored the accessibility of fiber to solvent and the defiberation of fluff pulpboard. In other words, the absorbability of fluff pulp fiber and the defiberation performance of fluff pulpboard was improved during the two-step chemical treatment process.
The variations of the fiber crystalline properties mentioned above are due to the de-crystallization effect of the alkali treatment. It has been determined that fiber swells when concentrated alkali enters into its interior, which makes molecular chains in cellulose crystalline regions slack and separate, while the crystallinity of the fiber decreases accordingly (Cai et al. 2015). In addition, the structure of intra-molecular hydrogen bonds and inter-molecular hydrogen bonds of the cellulose fiber were ruptured, exposing more free hydroxyl groups and decreasing the cohesion strength of the fiber, which would improve the absorbability of the fluff pulp fiber and make the defiberation of fluff pulpboard much easier. However, with the fiber crystallinity decreasing, the strength of fiber also decreased, which resulted in some negative effects on bulk performance of fluff pulp fiber.
Effect of Two-step Chemical Treatment on Hydrogen Bonds of Fiber
FT-IR spectra of cellulose fibers are shown in Fig. 4. It can be seen that no new absorption peaks appeared when the fiber was treated with 8 wt.% alkali solution and two-step chemical treatment, in comparison with that of the untreated pulp. This indicated that no new functional groups were generated when the fiber was treated with two-step chemical treatment and concentrated alkali, within a short reaction time.
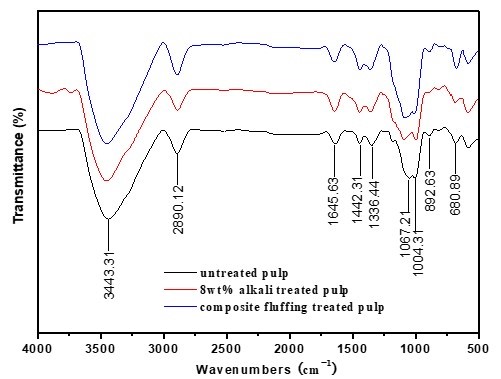
Fig. 4. FT-IR curves of untreated fiber, 8 wt.% alkali-treated fiber, and two-step chemically treated fiber. Note: Alkali-treated pulp (NaOH 8 wt.%, treated time 10 min, temperature 70 °C, concentration 10%), two-step chemically treated pulp (NaOH 8 wt.%, H2O2 1.8 wt.%, Na2SiO3 2.5 wt.%, MgSO4 0.05 wt.%, EDTA 0.4 wt.%, percentage of oven-dry raw material mass, total treated time 60 min concentrated alkali treated time 10 min, temperature 70 °C, concentration 10%).
The hydroxyl groups in the crystalline region of the cellulose were connected through inter- and intra-molecular hydrogen bonds. The absorption wave numbers of these bonds were different in FT-IR spectra. As shown in Fig. 2, the crystalline type of the fiber sample after having been treated by the two-step chemical treatment was still a typical cellulose I structure. According to a report by Fengel and Strobel (1994), FT-IR spectra of hydrogen-bonded –OH stretching vibrations around 3352 cm-1 were resolved into three bands for cellulose I structure, assuming that all the vibration modes follow Gaussian distribution. The bands of 1 (3518 cm-1), 2 (3349 cm-1), and 3 (3195 cm-1) were related to an intra-molecular hydrogen bond of 2-OH…O-6, intra-molecular hydrogen bond of 3-OH…O-5, and the inter-molecular hydrogen bond of 6-OH…O-3’, respectively. Consequently, cellulose I hydrogen-bonded –OH stretching resolving results for the untreated fiber, alkali-treated fiber, and two-step chemically treated fiber are shown in Fig. 5. The data analyzed using the Gaussian method and absorbent intensity of these three resolved bands is shown in Table 5.

Fig. 5. Resolution of hydrogen-bonded OH stretching: (a) untreated fiber; (b) alkali-treated fiber; (c) two-step chemically treated fiber. Note: 1) intra-molecular hydrogen bond O(2)H···O(6); 2) intra-molecular hydrogen bond O(3)H···O(5); 3) inter-molecular hydrogen bond O(6)H···O(3’). Alkali-treated pulp (NaOH 8 wt.%, treated time 10 min, temperature 70 °C, concentration 10%), two-step chemically treated pulp (NaOH 8 wt.%, H2O2 1.8 wt.%, Na2SiO3 2.5 wt.%, MgSO4 0.05 wt.%, EDTA 0.4 wt.%, percentage of oven-dry raw material mass, total treated time 60 min, concentrated alkali treated time 10 min, temperature 70 °C, concentration 10%).
Table 5. Basic Data of Resolving Hydrogen-Bonded OH Stretching in FT-IR by two-step chemical treatment
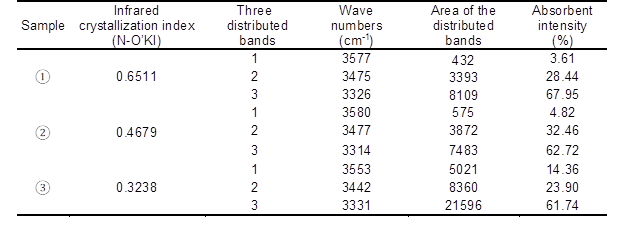
Note: ①—untreated pulp, ②—8wt% alkali-treated pulp, ③—two-step chemically treated pulp
From Fig. 5 and the data listed in Table 5, it was found that the proportion of inter-molecular hydrogen bond intensity (6-OH…O-3’) to total hydrogen bonds decreased from 67.95% to 62.72% when the fiber was treated with 8 wt.% alkali solution for 10 min. The proportion of intra-molecular hydrogen bond intensity increased from 3.61% to 4.82% (2-OH…O-6), and from 28.44% to 32.46% (3-OH…O-5), respectively. Additionally, the proportion of inter-molecular hydrogen bond intensity (6-OH…O-3’) to total hydrogen bonds decreased from 67.95% to 61.74%, and that of intra-molecular hydrogen bond intensity (3-OH…O-5) also decreased from 28.44% to 23.90% when the fiber was treated by two-step chemical treatment, of which alkali loading was the same as the 8 wt.% solution. Moreover, the proportion of intra-molecular hydrogen bond intensity (2-OH…O-6) increased from 3.61% to 14.36%. As a result, the proportion of total intra-molecular hydrogen bond intensity to total hydrogen bonds increased. The infrared crystallization index (N-O’KI) decreased when the fiber was treated both with 8 wt.% alkali solution and with the two-step chemical treatment, which was similar to the result of X-ray, as shown in Table 4.
The varied performance of fiber hydrogen bonds mentioned above can be attributed to the concentrated alkali treatment and its permeation route in the fiber. The hydrogen bonds’ structure was ruptured when the concentrated alkali permeated into the fiber from outside to inside (Zheng et al. 2012). Moreover, a relatively high proportion of inter-molecular hydrogen bond intensity to total hydrogen bonds led to a much easier rupture of inter-molecular hydrogen bonds than that of intra-molecular hydrogen bond. As a result, the proportion of inter-molecular hydrogen bond intensity (6-OH…O-3’) to total hydrogen bonds decreased when the fiber was treated with 8 wt.% alkali solution and two-step chemical treatment, which meant that the proportion of total intra-molecular hydrogen bond intensity to total hydrogen bonds increased. In addition, during the process of two-step chemical treatment, the effect of alkali on intra-molecular hydrogen bonds (3-OH…O-5) was probably relatively stronger than its effect on intra-molecular hydrogen bonds (2-OH…O-6). Under this condition, the proportion of intra-molecular hydrogen bonds (3-OH…O-5) to total hydrogen bonds decreased, but the proportion of total intra-molecular hydrogen bond intensity to total hydrogen bonds increased.
Moreover, hemicellulose with abundant free hydroxyl groups was partially degraded when the fiber was treated with concentrated alkali and a bleaching agent. Additionally, hydrogen bonds that were easily formed by free hydroxyl groups were mostly inter-molecular hydrogen bonds. This was another reason why the proportion of inter-molecular hydrogen bond intensity to total hydrogen bonds decreased, and that of total intra-molecular hydrogen bond intensity increased when the fiber was treated with concentrated alkali and two-step chemical treatment. Consequently, it was expected that after the rupture of hydrogen bonds, more free hydroxyl groups would be exposed and the cohesion of the fiber would decrease, which was conducive to not only improving the defiberation performance of fluff pulpboard and the absorbability of fluff pulp fiber, but also in compensating the negative effects on fiber absorbability caused by degradation of partial hemicellulose when it was treated with two-step chemical treatment.
Effect of Two-step Chemical Treatment on Fiber Surface Elements
The effect of two-step chemical treatment on fiber surface elements was investigated using XPS to supplement the results of fiber crystalline structure and hydrogen bond changes when it was treated with two-step chemical treatment. More basic data can be obtained to gather further research into the effects of two-step chemical treatment on the defiberation performance of fluff pulpboard and the absorbability of fluff pulp fiber.
XPS can detect the element types, chemical composition, and significant information about relative electronic structure, which was an effective means of element qualitative, and semi-qualitative, analysis. In this section, fiber surface elements and functional groups of un-treated pulp, 8 wt.% alkali-treated pulp, and two-step chemically treated pulp were analyzed using XPS. The XPS scanning spectra are shown in Fig. 6.
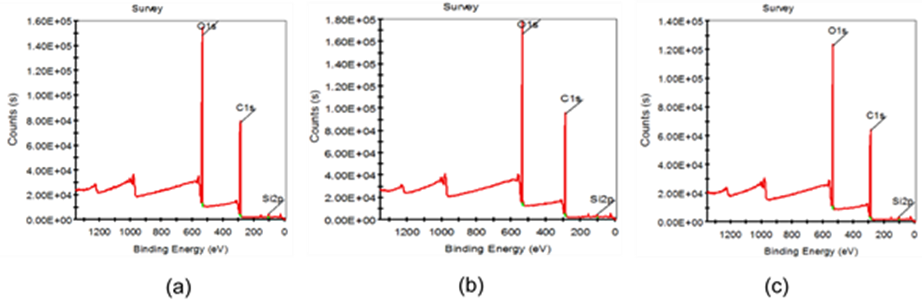
Fig. 6. XPS scanning spectra of fiber surface: (a) untreated fiber; (b) 8 wt.% alkali-treated fiber; (c) two-step chemically treated fiber. Note: Alkali-treated pulp (NaOH 8 wt.%, treated time 10 min, temperature 70 °C, concentration 10%); two-step chemically treated pulp (NaOH 8 wt.%, H2O2 1.8 wt.%, Na2SiO3 2.5 wt.%, MgSO4 0.05 wt.%, EDTA 0.4 wt.%, percentage of oven-dry raw material mass, total treated time 60 min, concentrated alkali treated time 10 min, temperature 70 °C, concentration 10%).
It can be seen from Fig. 6 that C, O, and Si characteristic absorption peaks appeared in the XPS scanning spectra of untreated fiber surface, 8 wt.% alkali-treated fiber surface, and two-step chemically treated fiber surface. In addition, C and O peaks were relatively stronger than that of Si, primarily because of the composition of the fiber carbohydrate. Si came from the raw material; a portion of the Si in the two-step chemical treatment treated fiber was caused by the addition of Na2SiO3 during the two-step chemical treatment process. Then, O1s peaks were resolved and fitted. XPS scanning spectra and the peak fitting results of O1s are shown in Figs. 7 to 9. The basic data for the O1s peak fitting are shown in Table 6.
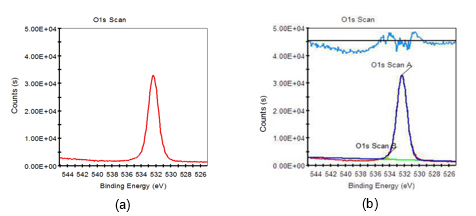
Fig. 7. O1s XPS scanning spectra of untreated fiber: (a) original spectra; (b) peak fitting spectra
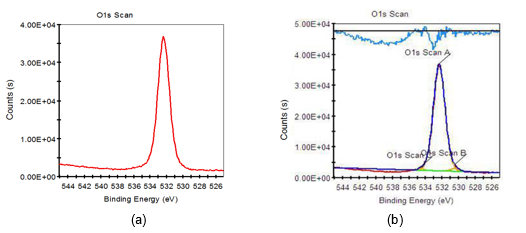
Fig. 8. O1s XPS scanning spectra of 8 wt.% alkali-treated fiber: (a) original spectra; (b) peak fitting spectra
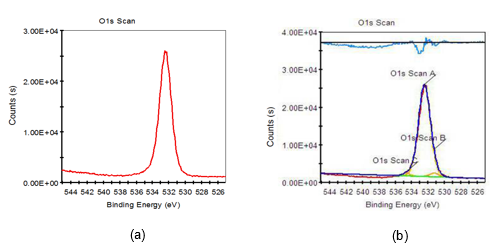
Fig. 9. O1s XPS scanning spectra of two-step chemically treated fiber; (a) original spectra; (b) peak fitting spectra
Based on Figs. 7 through 9 and the data listed in Table 6, it was found that the O1s characteristic absorption peak with the largest peak area compared to other O1s peaks appeared when the binding energy was 532.38 eV, which was a typical –OH absorption peak and hydroxyl characteristic absorption peak on the surface of saccharide (such as cellulose, hemicellulose, etc.) molecular chains. Atomic percent of this peak both decreased when fiber was treated with 8 wt.% alkali solution and two-step chemical treatment. Furthermore, it decreased by 4.15%, from 99.21% to 95.09%, during the dual-treated process. C-O and C=O characteristic absorption peaks also appeared on the fiber surface when it was treated with 8 wt.% alkali solution and two-step chemical treatment, which were the carboxyl group characteristic absorption peaks of saccharic acid generated from the degradation of partial carbohydrate. Additionally, the binding energy of C-O characteristic absorption peaks of two-step chemically treated fiber were rather stronger than that of the 8 wt.% alkali-treated fiber. This was mainly attributed to the electron withdraw group connected to the C-O group of two-step chemically treated fiber, and consequently higher energy was needed when an electron transition of these atoms occurred.
Table 6. Basic Data of O1s Peak Fitting By Two-step Chemical Treatment (Data in Table Compared with that in Reference Sikorski et al. 2004)
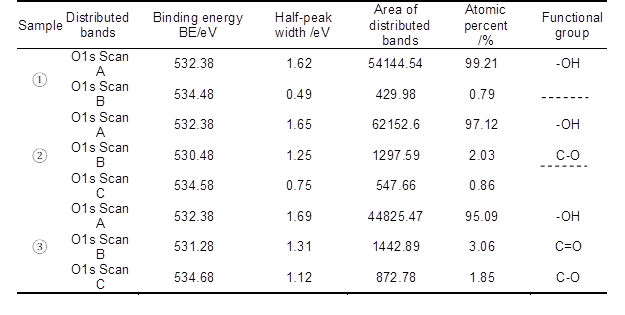
Note: 1) untreated pulp; 2) 8 wt.% alkali-treated pulp; 3) two-step chemically treated pulp.
Consequently, the decrease in the –OH content on the fiber surface meant that part of the carbohydrates, primarily hemicellulose, was degraded when the fiber was treated with 8 wt.% alkali and two-step chemical treatment. This conclusion was consistent with the report by Fang et al. (1999). On the one hand, the bonding strength of fluff pulp fiber was weakened when –OH content on fiber surface decreased. On the other hand, the –OH content on fiber surface only decreased by 4.15% when the fiber was treated with two-step chemical treatment, compared to that of the untreated pulp. As a result, not only the bonding strength of fluff pulp fiber was weakened, but also the negative effect of the –OH content decrease on the fluff pulp fiber absorbability was minimized, when the fiber was treated using two-step chemical treatment.
CONCLUSIONS
- In comparison with the untreated pulp, the brightness of pulp increased by 51.71% following two-step treatment with supplementary alkali addition. The apparent density and burst strength index of the pulpboard decreased by 11.76% and 48.18%, respectively. Consequently, the absorption time, absorbability, and bulk of the fiber obtained by defibering the pulpboard decreased by 47.40%, 8.33%, and 5.32%, respectively when the fibers were treated with two-step chemical treatment.
- All the properties of self-made fluff pulp met the qualified standard of GB/T 21331-2008. The absorbility, apparent density, and burst strength index met the requirements of GB/T 21331-2008 high-class standard, and were superior to those of Golden Isles fluff pulp.
- In comparison with untreated fiber, the two-step chemical treated fiber surface was relatively smooth, fiber filaments of its partial surface area were exposed, and fiber number-average length and weighted in length decreased by 8.92% and 8.27%, respectively. The fiber width and coarseness increased by 1.73% and 6.51%, respectively. The kinked and curled fiber contents increased by 9.54% and 26.13%, respectively. The fines content decreased by 29.63%.
- In comparison with untreated fiber, the crystallinity degree of two-step chemical treated fiber decreased by 45.10%, more crystal structure was converted into amorphous structure, and the proportion of total intra-molecular hydrogen bond intensity to total hydrogen bonds increased. All of this was conducive to the absorbability of fluff pulp fiber and the defiberation performance of the fluff pulpboard.
- Compared with that of the untreated pulp, the –OH content on fiber surface only decreased by 4.15% when the fiber was treated with two-step chemical treatment. Not only the bonding strength of the fluff pulp fiber was weakened, but also the negative effect of decreased –OH content on the fiber absorbability was minimized.
ACKNOWLEDGMENTS
The authors would like to acknowledge the financial support to this research from the National Natural Science Foundation of China (Grant number: 31170559), the Open Fund of National Key Laboratory of Pulp and Paper Engineering, and the South China University of Technology (201465). We also appreciate the financial support from the Academic Leaders Group Fund (2013XSD25).
REFERENCES CITED
Cai, M., Li, Y., Takagi, H., Nakagaito, A. N., Katoh, M., Ueki, T., Waterhouse, G. I. N., and Li, Y. (2015). “Influence of alkali treatment on internal microstructure and tensile properties of abaca fibers,” Ind. Crop. Prod. 65, 27-35. DOI: 10.1016/j.indcrop.2014.11.048
Chen, J. X. and Yu, J. L. (1989). Research Method of Chemical Structure of Plant Fiber, South China University of Technology Press, Guangzhou, China.
Clolacu, D. (2007). “On the supramolecular structure of cellulose allomorphs after enzymatic degradation,” J. Optoelectron. Adv. M. 9(4), 1033-1037.
Eriksson, I. (1994). “Fibers of increased specific surface area, a method for their manufacture, fluff pulp consisting of such fibers and the use of the fibers as absorption material,” EPO Patent Application SE 500858 C2.
Fang, J. M., Sun, R. C., Salisbury, D., Fowler, P., and Tomkinson, J. (1999). “Comparative study of hemicelluloses from wheat straw by alkali and hydrogen peroxide extractions,” Polym. Degrad. Stab. 66(3), 423-432. DOI: 10.1016/S0141-3910(99)00095-6
Fengel, D., and Strobel, C. (1994). “FTIR spectroscopic studies on the heterogeneous transformation of cellulose I into cellulose II,” Acta Polym. 45(4), 319-324. DOI: 10.1002/actp.1994.010450406
Garnier, D., Allison, E. A., Berceau, M. A., and Runge, M. T. (2005). “Highly wettable-highly flexible fluff fibers and disposable,” US Patent Application 2005/0137547 A1.
GB/T 451.3-2002 (2002). “Paper and board-Determination of thickness,” China Standards Press, Beijing, China.
GB/T 1539-2007 (2007). “Paperboard-Determination of bursting strength,” China Standards Press, Beijing, China.
GB/T 7974-2013 (2013). “Paper, board and pulps – Measurement of diffuse blue reflectance factor-D65 brightness (Diff/ Geometry, Outdoor daylight conditions),” China Standards Press, Beijing, China.
GB/T 21331-2008 (2008). “Fluff pulp,” China Standards Press, Beijing, China.
Goswami, P., Blackburn, R. S., EI-Dessouky, H. M., Taylor, J., and White, P. (2009). “Effect of sodium hydroxide pre-treatment on the optical and structural properties of lyocell,” Eur. Polym. J. 45(2), 455-465. DOI: 10.1016/j.eurpolymj.2008.10.030
Gümüskaya, E., Usta, M., and Kirci, H. (2003). “The effects of various pulping conditions on crystalline structure of cellulose in cotton linters,” Polym. Degrad. Stab. 81(3), 559-564. DOI: 10.1016/S0141-3910(03)00157-5
Hashem, M., El-Bisi, M., Sharaf, S., and Refaie, R. (2010). “Pre-cationization of cotton fabrics: An effective alternative tool for activation of hydrogen peroxide bleaching process,” Carbohydr. Polym. 79(3), 533-540. DOI: 10.1016/j.carbpol.2009.08.038
Hon, D. N. S. (1994). “Cellulose: A random walk along its historical path,” Cellulose 1(1), 1-25. DOI: 10.1007/BF00818796
Johansson, L. S., Campbell, J. M., and Stenius, P. (1999). “Evaluation of surface lignin on cellulose fibers with XPS,” Appl. Surf. Sci. 144-145(15), 92-95. DOI: 10.1016/S0169-4332(98)00920-9
Kroon-Batenburg, L. M. J., and Kroon, J. (1997). “The crystal and molecular structures of cellulose I and cellulose II,” Glycoconjugate J. 14(5), 677-690. DOI: 10.1023/A:1018509231331
Luo, X. L. and Zhu, J. Y. (2011). “Effects of drying-induced fiber hornification on enzymatic saccharification of lignocelluloses,” Enzyme Microb. Technol. 48(1), 92-99. DOI: 10.1016/j.enzmictec.2010.09.014
Marrinan, H. J. and Mann, J. (1954). “A study by infra-red spectroscopy of hydrogen bonding in cellulose,” J. Appl. Chem. 4(4), 204-211. DOI: 10.1002/jctb.5010040408
Mohanty, A. K., Misra, M., and Drzal, L. T. (2001). “Surface modifications of natural fibers and performance of the resulting biocomposites: An overview,” Compos. Interf. 8(5), 313-343. DOI: 10.1163/156855401753255422
Nishiyama, Y., Kuga, S., and Okano, T. (2000). “Mechanism of mercerization revealed by X-ray diffraction,” J. Wood. Sci. 46(6), 452-457. DOI: 10.1007/BF00765803
Norlander, L. (1998). “Method of preparation of a cellulosic pulp, cellulosic pulp to be used in absorbent products, and such absorbent product,” EPO Patent Application SE 508898 C2.
Oh, S. Y., Yoo, D. I., Shin, Y., Kim, H. C., Kim, Y. H., Chung, Y. S., Park, W. H., and Youk, J. H. (2005). “Crystalline structure analysis of cellulose treated with sodium hydroxide and carbon dioxide by means of X-ray diffraction and FTIR spectroscopy,” Carbohydr. Res. 340(15), 2376-2391. DOI: 10.1016/j.carres.2005.08.007
Qi, H. S., Cai, J., Zhang, L., and Zhang, L. (2008). “Influence of finishing oil on structure and properties of multi-filament fibers from cellulose dope in NaOH/urea aqueous solution,” Cellulose 15(1), 81-89. DOI: 10.1007/s10570-007-9142-z
Sealey, J. E. and Hevenor, M. (2011). United States Patent Application US20110108227 A.
Sikorski, P., Wada, M., Heux, L., Shintani, H., and Stokke, B. T. (2004). “Crystal structure of cellulose triacetate I,” Macromol. 37(12), 4547-4553. DOI: 10.1021/ma0498520
Wang, J. (2013). Technology Optimization and Mechanism of Fluff Pulp Board, Xi’an, China, pp. 6-7.
Wu, J., West, H., and Grant, T. M. (2001). United States Patent Application US6296737 B.
Xie, L. S. and Zhan, H. Y. (2008) Pulping Principle and Engineering (Second Edition), China Light Industry Press, Beijing, China.
Xu, Y. J., Pu, W. J., Xiang, X. M., and Ma, C. X. (2006). “An investigation to the twist of fluff pulp board during its defiberation,” Pulp Pap. Ind. 27(4), 50-53.DOI: 10.3969/j.issn.1007-9211.2006.04.011
Yang, S. H. (2009). Plant Fiber Chemistry (Third Edition), China Light Industry Press, Beijing, China.
Zhao, H. B., Kwak, J. H., Zhang, Z. C., Brown, H. M., Arey, B. W., and Holladay, J. E. (2007). “Studying cellulose fiber structure by SEM, XRD, NMR and acid hydrolysis,” Carbohydr. Polym. 68(2), 235-241. DOI: 10.1016/j.carbpol.2006.12.013
Zheng, M. X., Li, L. Q., Zheng, M. Y., Wang, X., Ma, H. L., and Wang, K. J. (2012). “Effect of alkali pretreatment on cellulosic structures of corn stover,” Environ. Sci. Technol. 35(6), 27-31.
Zugenmaier, P. (2001). “Conformation and packing of various crystalline cellulose fibers,” Prog. Polym. Sci. 26(9), 1341-1417. DOI: 10.1016/S0079-6700(01)00019-3
Article submitted: July 23, 2015; Peer review completed: October 15, 2015; Revised version received and accepted; October 26, 2015; Published: November 16, 2015.
DOI: 10.15376/biores.11.1.336-353
